
INTRODUCTION
The rising worry about well-being and life quality has urged individuals to work out, eat healthy food, and decrease their utilization of nourishments rich in sugar, salt, and fat. The persistent utilization of sugar-improved drinks has likewise been continuously connected to an assortment of well-being concerns, for example, corpulence, type 2 diabetes, and metabolic disorder (Swithers, 2013; Swithers et al., 2012). Increased consumer interest in reduced sugar intake has led to the production of food products made with nonsugar sweeteners (Amin et al., 2016). These concentrated sugars give the sweet taste of sucrose, are not utilized in the body, and do not prompt calorie admission. Five artificial sugars are endorsed by the US Food and Drug Administration: aspartame, saccharin (Sac), sucralose, acesulfame potassium, and neotame (Erbas et al., 2018; Sylvetsky and Rother, 2016).
Saccharin (1,1-dioxo-1,2-benzothiazol-3-one), the most seasoned counterfeit sugar, is a nonnutritive, noncaloric, extraordinary fake sugar that has 300–500 times the sweetness of sucrose with a slight unpleasant persistent flavor (Anderson and Young, 2008). Sac is still widely used and is particularly prescribed for diabetics. Its use has been a matter of controversy due to its tumor-promoting abilities in second-generation rats Andreatta et al., 2008; Nicolson et al. (2018). As a result, saccharin was thought to be unfit for human consumption (Sharma et al., 2016). It is heatstable and along these lines utilized in hot drinks, canned vegetables, bread kitchen items, and low-sugar jams (Amin et al., 2016). Sac goes legitimately through the human stomach-related framework without digestion or metabolism and in this manner gives no food energy (Okoduwa et al., 2013). There are various types of Sac, including sodium saccharin, calcium saccharin, potassium, and corrosive saccharin. Sac is known under the E-number (added substance code) E954. The acceptance limit for daily consumption of saccharin is 2.5 mg/kg bw (Amin et al., 2016). Worries concerning the safety of Sac are of incredible general well-being criticalness and of extraordinary enthusiasm to people in general, since saccharin is devoured by a large number of individuals, including kids and embryos (Uçar and Yilmaz, 2015). coenzyme Q10 (COQ10) is the main source for adenosine triphosphate (ATP) generation by means of oxidative phosphorylation due to the exchange of electrons through the respiratory chain in the cell mitochondria (Song et al., 2017). COQ10 has additionally been uncovered as a redox-marker, cancer prevention agent, and lipoprotein compound found in the phospholipid bilayer of the cell membrane (Quiles et al., 2005). It is a viable characteristic cancer prevention agent, with a principal function in cell bioenergetics. COQ10 is the main lipid-soluble cancer prevention agent combined endogenously and is available in all cell membranes and blood, and in both high-density lipoprotein (HDL) and ow-density lipoprotein (LDL) (Laredj et al., 2014). It assumes a significant part in cell digestion, serves as an electron transporter in both mitochondrial and extramitochondrial films, shields layers, lipoproteins from protein oxidation, and lipid peroxidation (Camacho et al., 2018). The biosynthesis of COQ10 happens in the mitochondria of the liver, heart, kidneys, and muscles, which all require a more noteworthy measure of energy for their various natural capacities (Acosta et al., 2016). Due to its basic capacity in cell tissues, COQ10 insufficiency is a typical disorder in certain pathological conditions of the aging cell (Song et al., 2017). Meat, fish, nuts, and a few oils are the most extravagant wholesome wellsprings of COQ10, while much lower levels can be found in most dairy items, vegetables, organic products, and oats. Huge varieties in the COQ10 substance of certain nourishments and food items have been discovered because of their diverse topographical inceptions (Bentinger et al., 2010; Pravst et al., 2010). In the above-mentioned setting, the point of this examination was to analyze the impacts of saccharin and COQ10 on memory and neuronal endurance and to explore the expected relationship of saccharin, oxidative stress, and metabolic syndrome.
MATERIALS AND METHODS
Male albino rats weighing 150–180 g were used for this experiment. Rats were obtained from the animal house of the National Organization of Drug Control and Research (Dokki, Cairo, Egypt). They were housed for at least 1 week in the laboratory room prior to testing under a 12 hours alternating light/ dark cycle. Animals were fed standard laboratory pellets with water ad libitum. All animal procedures were carried out in accordance with the Ethics Committee of the National Research Centre, Egypt (registration number 17/004), and the Guide for the Care and Use of Laboratory Animals of the National Institutes of Health, as well as guidelines from the Canadian Council on Animal Care.
Drugs and chemicals
Sac was obtained from Cornell Lab (Al-Maadi, Cairo City, Egypt), as a white crystalline powder and was dissolved in distilled water according to the study by Alsoufi et al. (2017). COOQ10 was obtained from the Arab Company for Pharmaceuticals and Medicinal Plants (Mepaco-Medifood, Enshas El Raml, Sharkeia, Egypt; M.O.H Reg. No. 895/2012) and was dissolved in corn oil according to the study by Olama et al. (2018).
Treatments
During the first experiment, six doses of saccharin (12.5, 15, 17.5, 20, 22.5, and 25 g/kg bw) were given orally to six groups of eight rats in order to determine the lethal dose 50 (LD50) of Sac from 0 % to 100 % mortality. The animals were observed for 2 hours and then again at hours 4, 6, and 24 for any toxic signs and symptoms. After 24 hours, the number of rats in each group was counted and the percentage of mortality was calculated using the method described by Miller and Tainter (1944).
In the second experiment, rats were randomly allocated into six groups (10 rats/group) for object recognition testing. Rats received each of the treatments listed below via oral gavage every day for 30 days.
- Group 1 (G1): normal control, received distilled water as 1 ml/100 g bw.
- Group 2 (G2): received COQ10 (20 mg/kg bw).
- Group 3 (G3): received 1/10 of saccharin LD50 (2 g/kg bw).
- Group 4 (G4): received 1/20 of saccharin LD50 (1 g/kg bw).
- Group 5 (G5): received 1/10 of saccharin LD50 (2 g/kg bw) plus COQ10 (20 mg/kg bw).
- Group 6 (G6): received 1/20 of saccharin LD50 (1 g/kg bw) plus COQ10 (20 mg/kg bw).
Behavioral tests
Each rat was tested with the Morris water maze (MWM). Specifically, we tested the latency time and time spent in the platform quartile zone (in seconds) according to the method published by Morris (1984). We also tested the rats using the Please confirm the term “open field box test” (OFT) according to Brown et al. (1999).
Brain homogenate preparation for biochemical analysis
Rats were euthanized by decapitation following the behavioral tests and the whole brain was carefully excised. Next, the cortical and hippocampal brain tissues were isolated and immediately weighed to avoid any effects from drying and then stored at −80°C. The homogenate was centrifuged using a cooling centrifuge (2k15; Sigma/Laborzentrifugen) at 4,000 rpm for 5 minutes, and the resulting supernatant was used to determine the neurotransmitter contents in the brain, along with their metabolites [norepinephrine (NE), dopamine (DA), serotonin 5-hydroxytryptamine (5-HT), 5-hydroxyindoleacetic acid (5-HIAA), and 3,4-dihydroxyphenylacetic acid (DOPAC)], as well as each brain’s malondialdehyde (MDA) content.
Preparation of serum samples for biochemical investigations
Blood samples were collected after decapitation in clean, dry centrifuge tubes. Blood samples were centrifuged at 5,000 rpm for 20 minutes at 4°C in order to obtain serum. Serum was separated and kept at –20°C in order to determine superoxide dismutase (SOD) activity and thyroid hormone levels (T3 and T4).
Histopathological examination
Histopathological examination of the brain tissue was carried out according to Bancroft and Gamble’s (2008) study.
Statistical analysis
The resulted values are expressed as mean ± SE. Reported data represent the means from eight animals. Statistical analysis was carried out with one-way analysis of variance, followed by post-hoc least significant difference analysis (Duncan). Statistical analysis was carried out using the Statistical Package for Social Science for Windows software (Version: 17). The value of p < 0.05 was considered statistically significant.
RESULTS
Effect of saccharin dose
Mortality rate
The mortality rate for each Sac dose is given in Table 1 and Figure 1. The mortality rate was directly proportional to the increases in the saccharin dose. The highest mortality rate was found in the 25 g/kg bw Sac dose, followed by Sac doses at 22.5, 20, 17.5, and 15 g/ kg bw, respectively. The lowest mortality rate for Sac was found at 12.5 g/kg bw. The LD50 of Sac was found to be at 20 g/kg bw.
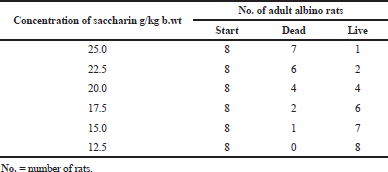 | Table 1. Mortality rate of rats’ groups given different doses of saccharin. [Click here to view] |
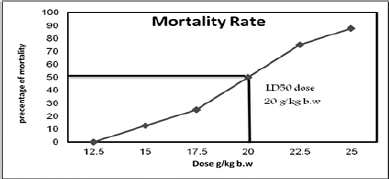 | Figure 1. Mortality rate and LD50 of saccharin in adult male rats’ groups. [Click here to view] |
Effect of different doses of saccharin-induced metabolic syndrome against COQ10-treated group on behavioral tests (MWM and open field test)
Morris water maze
The data in Figures 2 and 3 show that Sac markedly decreased the behavioral parameters in rats. The decline of activity in the Sac groups was gradually linear with the concentration levels given for each treatment. The COQ10 groups recovered the declined behavioral parameters at various doses (G2 and G5), particularly at the highest dose (G6). On the contrary, the Sac group markedly decreased the amount of time they spent in the quartile zone. COQ10 rats showed gradual, linear recovery from this deterioration.
Open field test
Table 2 shows that Sac markedly increased the time spent by rats freezing, defecating, urinating, and grooming. Rats treated with Sac also increased the percentage of time they spent in the center of the test. Sac-treated groups also markedly decreased their rearing behavioral parameters. On the contrary, the COQ10 group showed marked amelioration, with values near to the control groups in a dose-dependent manner.
Biochemical investigation
Effect of different doses of saccharin-induced metabolic syndrome against COQ10-treated group on brain neurotransmitter levels and their metabolites
The brain neurotransmitter levels of NE, DA, and 5-HT and their metabolites, DOPAC and 5-HIAA, are illustrated in Table 3. The obtained data showed no significant differences between COQ10 and the control group after 1 month of treatment. On the contrary, treatment with saccharin at high (G3) and low doses (G4) in rats was associated with a marked decrease in the brain neurotransmitters levels of 5-HT, NE, and DOP. Moreover, these were accompanied by increases in the 5-HT and DOP turnover ratios (i.e., ratios of 5-HIAA/5-HT and DOPAC/DOP). In the same manner, the group treated with a high dose of saccharin and COQ10 (G5) showed a significant decrease in DA and 5HT levels and a significant recovery of NE. Also, there was a marked increase in the 5-HT and DOP turnover ratios for this group (i.e., 5-HIAA/5-HT and DOPAC/DOP, resp.), as compared with the control group.
The G5 group (high dose of saccharin plus COQ10) showed a significant increase in brain neurotransmitter levels and a significant decrease in their metabolites as compared with the groups treated only with Sac. In addition, the G6 group (COQ10 plus low dose Sac) showed a significant amelioration for NE and 5HT and the 5HT and DOP turnover ratios, in comparison with the control group, while demonstrating a significant increase in brain levels of 5-HT, NE, and DOP, respectively, and decreasing the 5-HT and DOP turnover, as compared to the saccharin-treated groups at different levels. Finally, G6 (COQ10 plus low dose Sac) did not show any significant differences in NE or DA, but did increase in 5HT, while decreasing the 5HT and DOP turnover ratios in comparison with the G5 group. Regardless of these differences, the G5 and G6 groups still had levels that were near normal.
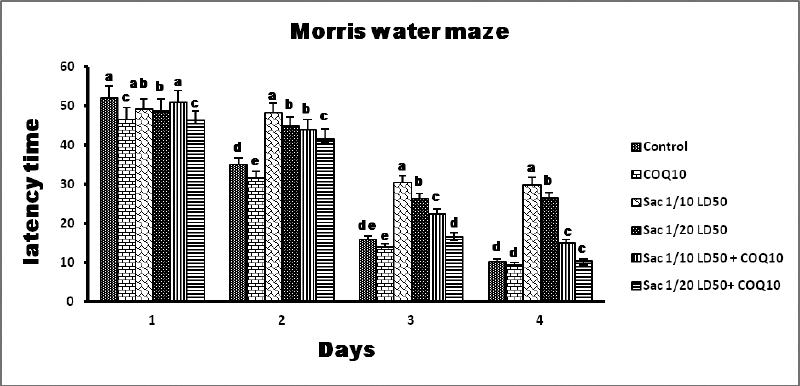 | Figure 2. MWM results from the different groups. [Click here to view] |
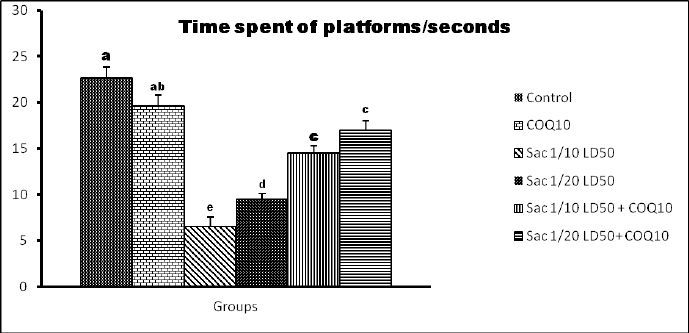 | Figure 3. Time spent on the platforms of the quartile zone (seconds) for the different groups. [Click here to view] |
Effect of different doses of saccharin-induced metabolic syndrome against COQ10-treated group on MDA content of brain tissue and SOD activity of serum
The brain MDA content and the SOD activity of the serum are illustrated in Table 4. The MDA content in the G2 group exhibited a significant decrease in MDA content, compared to the control group. On the contrary, the G3 group (Sac 1/10 LD50) and the G4 group (Sac 1/20 LD50) showed a significant elevation in MDA content compared to the control group (p ≤ 0.05).
Finally, there was a marked recovery in MDA content in G5 (Sac 1/10 LD50 + COQ10) and G6 (Sac 1/20 LD50 + COQ10) in comparison with the Sac-treated groups (G3 and G4), but this difference did not reach the normal level at p ≤ 0.05.
No significant difference was observed in the serum SOD activity in G2 (COQ10 group) compared to the control. On the contrary, there was a significant decline in serum SOD activity for G3 (Sac 1/10 LD50) and G4 (Sac 1/20 LD50) treated groups. In G5 (Sac 1/10 LD50 + COQ10) and G6 (Sac 1/20 LD50 + COQ10), there was a significant increase in serum SOD activity as compared to G3 and G4. This is a significant recovery in serum SOD activity for G3 and G4 compared to the control group. Also, the serum SOD activity for G5 (Sac 1/10 LD50 + COQ10) and G6 (Sac 1/20 LD50 + COQ10) had nonmarked increases as compared to the COQ10 group (G2), but the G5 and G6 values were still near normal at (p < 0.05).
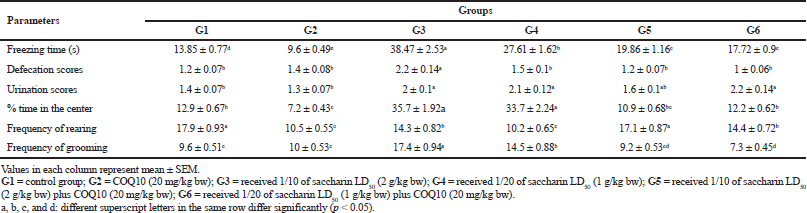 | Table 2. The effect of different doses of saccharin on the induction of metabolic syndrome compared to the COQ10-treated group on behavioral tests [Click here to view] |
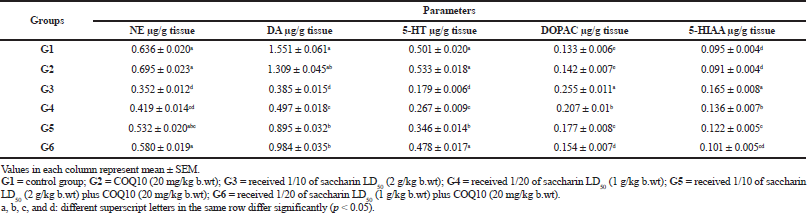 | Table 3. Brain neurotransmitter levels and their metabolites: NE, DA, 5HT, DOPAC, and 5-HIAA,(μg/g tissue) in different treatment groups. [Click here to view] |
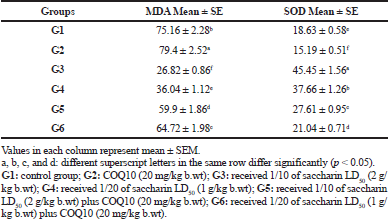 | Table 4. The brain MDA (nmole/g) and SOD activity in serum (u/g) of different treated groups. [Click here to view] |
Effect of different doses of saccharin-induced metabolic syndrome against COQ10-treated group on triiodothyronine (T3) and thyroxine (T4) of serum
The results for the triiodothyronine and thyroxine measurements are illustrated in Table 5. A significant increase in serum T3 levels for the COQ10 group (G2) was observed compared to the control group. There was a significant decrease in serum T3 levels in the low and high doses of saccharin-treated groups (G3 and G4) after 1 month of treatment at p value ≤ 0.05.
Meanwhile, the serum T3 level for groups G5 (Sac 1/10 LD50 + COQ10) and G6 (Sac 1/20 LD50 + COQ10) showed a significant increase in comparison to G3 and G4.
At the same time, a significant decrease in the serum T3 levels was observed between these groups (G5 and G6) and the COQ10 group (G2). G6 also did not show any significant differences in serum T3 level compared with the control group, so it was still near to normal at p value ≤ 0.05.
There was no marked change for the serum T4 level in G2 (COQ10-treated group) in comparison with the control group. On the contrary, the serum T4 level in G3 and G4 (Sac 1/10 LD50 and Sac 1/20 LD50) exhibited a marked decline as compared to the control group. In the same manner, the serum T4 levels in G5 showed a significant recovery in comparison to G3 (Sac 1/10 LD50), while there were nonsignificant changes in the serum T4 level for G5 (Sac 1/10 LD50 + COQ10) as compared to the G4 (Sac 1/20 LD50) group. There was a marked recovery in serum T4 levels in G6 (Sac 1/20 LD50 + COQ10) as compared to G3 and G4 after 1 month of treatment. In addition, there was no marked change between the control, G2 (COQ10), G5 (Sac 1/10 LD50 + COQ10), and G6 (Sac 1/20 LD50 + COQ10) groups. G6 remained near to normal at p value ≤ 0.05.
Histological investigation of brain
A. Cortex
Histological examination of the frontal area of the control rat brain group showed normal architectural organization of the cerebral cortex (Fig. 4A). Sections revealed neuronal organization in six layers from outside inwards. Layer I, the molecular layer, lies beneath the meninges and contains neutrophil and few neuron cell bodies. Layer II is the external granular cell layer. Layer III, the external pyramidal cell layer, is composed of small pyramidal cells. Layer IV is the internal granular cell layer. Layer V is the internal pyramidal cell layer containing large pyramidal cells. Layer VI is the multiform layer, with elongate fusiform neurons. In the higher magnification, the common cells inside these layers are the neurons especially pyramidal and granule cells in addition to neuroglial cells including astrocytes, oligodendrocytes, and microglia (Fig. 4B). The pink stained background, the neutrophil, was a mat of neuronal and glial cell processes. Histological examination of the frontal area of rat brain treated with COQ10 group showed nearly normal architectural organization of the cerebral cortex (Fig. 4C). High magnification revealed that normal cellularity included neuronal and glial cells and neutrophil; however, some cells have perinuclear halo (Fig. 4D). In Sac 1/10 LD50-treated group, microscopic examination of brain cerebral cortex of rat (Fig. 4E) revealed histopathological lesions characterized by a heterogeneous organization, including neutrophil vacuolation, some neuronal cells appeared darkly stained irregular, distorted, and shrunken with pericellular haloes together with darkly stained nuclei, and less number of glial cells included astrocytes, oligodendrocytes, and microglia which showed degeneration and necrosis. The degenerated astrocytes and oligodendrocytes have perinuclear haloes similar to fried egg appearance (Fig. 4F). Examination of the brain cerebral cortex of rats treated with Sac 1/20 LD50 revealed neutrophil vacuolation, dilated blood vessels, and vacuolated glial cells (Fig. 4G). Less number of glial cells was detected. Some astrocytes and oligodendrocytes have a perinuclear halo and revealed necrosis or apoptosis. Few neuronal cells appeared darkly stained irregular, distorted, and shrunken with pericellular haloes together with darkly stained nuclei (Fig. 4H). Microscopic examination of the brain cerebral cortex from a rat treated with Sac 1/10 LD50 + COQ10 revealed restoration of the normal histological organization (Fig. 4I). Despite little neurophil vacuolation, few neuronal cells appeared darkly stained irregular, distorted, and shrunken with pericellular haloes together with darkly stained nuclei, and less number of glial cells (Fig. 4J). Examination of the brain cerebral cortex of rat treated with Sac 1/20 LD50 + COQ10 revealed normal cellular architectural organization with neurophil having some vacuoles (Fig. 4K). A few astrocytes and oligodendrocytes appeared darkly stained and have a perinuclear halo and the majority have a normal appearance. Little neuronal cells appeared darkly stained and have pericellular haloes (Fig. 4L).
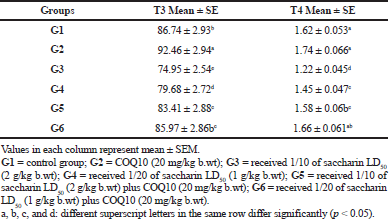 | Table 5. Triiodothyronine (T3) and thyroxine (T4) levels in serum (ng/dl) of different treated groups. [Click here to view] |
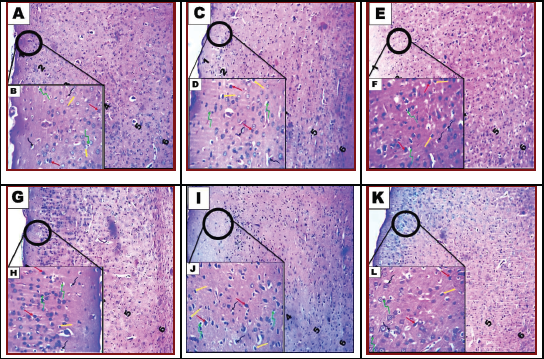 | Figure 4. Photomicrograph of cerebral cortex of brain tissue of rats. Control group showing normal architectural organization of the cerebral cortex (A and B). Group II: COQ10-treated rats (C and D) and group III: rat treatment with saccharin Sac 1/10 LD50 (E and F). Group IV: rat treatment with saccharin Sac 1/20 LD50 (G and H). Group V: combined treatment with saccharin Sac 1/10 LD50 and COQ10 (I and J). Group VI: combined treatment with saccharin Sac 1/20 LD50 and COQ10 (K and L). A, C, E, G, I, and K show the general histological structure of the cerebral cortex. Note: molecular layer (1), outer granular layer (2), outer pyramidal layer (3), inner granular layer (4), inner pyramidal layer (5), and the multiform layer (6). B, D, F, H, J, and L: show neuron (red arrow), astrocytes (yellow arrow), oligodendrocytes (twisted green arrow), and microcytes (twisted black arrow) (H&E, A, C, E, G, I, and K; 100x) (H&E, B, D, F, H, J, and L; 200x). [Click here to view] |
B. The hippocampal
Histological section from control rat brain revealed normal hippocampal appearance which composed of proper DG and subiculum (Fig. 5A). The hippocampal DG contained dense granule cells; and the Cornu Ammonis CA1–CA4 regions contained pyramidal neurons. CA1 and CA2 were formed of small pyramidal cells; CA3 and CA4 were formed of large pyramidal cells. CA4 projects into the concavity of DG that is formed of small granule cells. The subiculum is an outward continuation of the CA1 region. The higher magnification revealed the areas in between the compact zones of cells comprising the molecular layer which consists of neuronal processes (axons and dendrites), glial cells, and scattered nerve cells. The DG and the Cornu Ammonis have three layers: polymorphic layer, pyramidal layer, and the molecular layer (Fig. 5B). In the COQ10-treated group, the normal hippocampal appearance was observed (Fig. 5C). Hippocampal DG revealed normal thickness of dense granule cellular layer and normal molecular layer. However, few vacuoles and vacuolated granule cells were seen in high magnification (Fig. 5D). The hippocampal DG histopathological lesions associated with the treatment of rats with Sac 1/10 LD50. (Fig. 5E) were characterized by a thin compact cellular layer and vacuolation in the molecular layer. Some necrotic and apoptotic glial cells and the vacuolation were seen in high magnification (Fig. 5F). Histological observation of hippocampal DG of rat brain treated with Sac 1/20 LD50 group revealed thinning of dense granule cellular layer and vacuolation in the molecular layer (Fig. 5G). A decrease in the number of neuronal pyramidal cells and granular cells; apoptotic granule cells; neuronal darkly stained irregular, distorted, and shrunken cells with pericellular haloes and neurophil vacuolation was seen in high magnification (Fig. 5H). The hippocampal DG histopathological lesions associated with treatment with Sac 1/10 LD50+ COQ10 (Fig. 5I) were decreased by COQ10. However, the dense cellular layer revealed a few cellular vacuolations in the molecular layer. Few necrotic and apoptotic glial cells were seen in high magnification (Fig. 5J). Histological examination of hippocampal DG from rat brain treated with Sac 1/20 LD50+ COQ10 revealed a nearly normal organization of dense granule cellular layer thick (Fig. 5K). Restoration of neuronal pyramidal cells number and granule cells and nearly normal neutrophil were seen in high magnification (Fig. 5L).
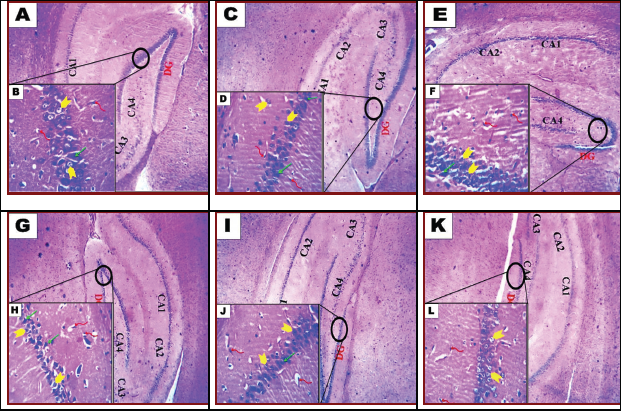 | Figure 5. Photomicrograph of hippocampal of brain tissue of rats. Control group (A and B). G2 (COQ10-treated rats) (C and D) and G3: rat treatment with saccharin 1/10 LD50 (E and F). G4: rat treatment with saccharin 1/20 LD50 (G and H). G5: combined treatment with saccharin 1/10 LD50 and COQ10 (I and J). G6: combined treatment with saccharin 1/20 LD50 and COQ10 (K and L). A, C, E, G, I, and K show the dentate gyrus (DG). Next come a series of Cornu Ammonis areas: first CA4 (which underlies the DG), then CA3, then a very small zone called CA2, then CA1. B, D, F, H, J, and L: Microglia (twisted red arrow), granular (yellow arrow), and pyramid cell (green arrow). (H&E, A, C, E, G, I, and K; 100x); (H&E, B, D, F, H, J, and L; 200x). [Click here to view] |
DISCUSSION
In this study, various MWM behavioral parameters were tested that involved several components consisting of attention, reference memory, working memory, and relearning for memory assessment (Saxena et al., 2016). Changes in learning and memory were assessed using the MWM test on day 4 of the experiment. In the saccharin-treated groups (G3 and G4), latency time was significantly prolonged, with significantly less time spent on the platforms as compared to G2 (COOQ10) and the control groups. These results indicate a failure in learning performance due to Sac toxicity. These results agree with Kumar et al. (2017), who affirmed that learning and memory were impeded by saccharin treatment or ingestion. These spatial memory hindrances, which are by and large brought about by hippocampal injuries, might be because of the aggravation of the hippocampal circuit and vast connections since the hippocampus is vital for the combination of spatial data. Consequently, the memory loss or dysfunction may be identified with modifications in various cell and subatomic boundaries in the hippocampus or potentially other mind regions. (Kaoud et al., 2010; Lamtai et al., 2018). The OFT results displayed a significant increase in the freezing time, defecation scores, urination scores, percentage of time spent in the center of the test, and grooming frequency in G3 and G4 (Sac groups) compared to the control group. On the contrary, there was a significant decrease in the frequency of rearing in these groups. Results from Bagi et al. (2017) are in support of these findings. In that study, it was concluded that sucrose and saccharin administration, especially at higher doses, produced anxiety and harmful effects on psychological and physiological disorders in rats, as shown by parameters of the OFT test when compared with the negative control. The anxiety might have been due to low levels of gamma-aminobutyric acid, a neurotransmitter that reduces activity in CNS, and contributes to anxiety (Flora et al., 2008). In the current examination, there was a marked decrease in all Sac-treated rats in the distinctive synapse substance (monoamines) of the brain. This distinction was joined by an increase in 5HT and DA turnover proportions, in contrast to the control group. Monoamines can adapt to neuronal action and function. In addition, the realized adjustments of flagging monoamine can prompt modifications in mood and behavior. The outcomes distributed by Abhilash et al. (2014) demonstrated that artificial sugars at a high portion caused aggravation in the ionic homeostasis and incited apoptosis in the brain. These outcomes uncovered that there was a critical reduction of DA in the corpus striatum and cerebral cortex and a decline of 5-HT in the corpus striatum, just as a huge change in the tyrosine hydroxylase action and amino acids levels in the cerebrum. These outcomes might be because of its impact on electrolyte homeostasis and monoamine synapse amalgamation portion conditionally and this may possibly affect psychological capacities (Tsakiris et al., 2006). There is a positive relationship between the successive drinking of improved refreshments and sorrow. As a rule, diet drinks frequently utilize counterfeit sugars, for example, saccharin and aspartame, for their improved, sans calorie taste (Humphries et al., 2008; Whitehouse et al., 2008). Guo et al. (2014) found that the expansion of these artificial sugars to tea or others was related to a higher danger of despondency. Upset digestion of catecholamine and different synapses seems to assume a significant function in the pathogenesis of neuropsychiatric indications, for example, changes in the state of brain, comprehension, learning, engine action, rest, and discouragement (Cowen, 2016). Steady with the current examination, Ahmed-Farid et al. (2016) demonstrated that intensely depressed mice are related to a reduction in 5-HT and an expansion in its metabolite, 5-HIAA, which reverse the expanded digestion of 5-HT. An expanded 5-HT turnover proportion was likewise watched. In addition, depressed mice were found with a reduction in mind DA content, with an expansion in its metabolite DOPAC, showing an expanded DA turnover (i.e., an increment in the proportion DOPAC/DA). Bian et al. (2017) uncovered that saccharin utilization could build irritation in mice, and this change might be the result of annoyances of the gut microbiota and metabolites emerging from Sac utilization. Another significant objective of proinflammatory cytokines is monoamine carriers. Monoamine carriers assume a significant part in the guideline of serotonergic, dopaminergic, and norepinephrinergic neurotransmission and in the arrangement of monoaminergic metabolites. An expanding measure of proof focuses on a function for expanded 5-HT carrier movement in light of proinflammatory cytokines (Tsao et al., 2008; Zhu et al., 2010). The expanded action of monoamine carriers prompts debilitating of monoaminergic signals and the expanded accessibility of monoamines for the corruption of 5-HT and DA to 5-HIAA and DOPAC, individually, by monoamine oxidase (MAO). Cytokines may likewise be influenced by monoaminergic neurotransmission by means of this course (Isingrini et al., 2016). In this investigation, it was shown that there was a huge increment in the cerebrum substance of 5-HT and DA and its turnover, with a decline in the metabolites 5-HIAA and DOPAC in the COQ10-, Sac 1/10 LD50 COQ10-, and Sac 1/20 LD50 COQ10-treated gatherings) contrasted with the saccharin-treated gatherings at various levels. In concurrence with the current outcomes, Yousef et al. (2019) saw that COQ10 expanded the degrees of monoamine synapses in the cerebrum, accordingly constricting the impacts of Sac. This impact might be attributed to the powerful effect of COQ10 on the reinforcement cell, which builds the monoamine level and forestalls degenerative changes in neurons. Additionally, COQ10 especially diminished the cerebrum substance of the metabolites 5-HIAA and DOPAC. This might be because of the MAO inhibitor action, which is the degradation of neurotransmitters (Finberg and Rabey, 2016). COQ10 speaks to significant cell reinforcement with calming and neuroprotective properties. It represses proinflammatory cytokine creation, expanded synapse levels, and diminished their metabolites, 5-HIAA and DOPAC, by diminishing the action of the monoamine carriers that lead to a debilitating of the monoaminergic and expanded accessibility of monoamines for debasement (Vaváková et al., 2015). There was a critical increment in mind tissue MDA in Sac-treated gatherings at various levels (G3 and G4) when contrasted with the benchmark group. ErbaÅŸ et al. (2018) saw that a noteworthy debilitation in memory execution followed the treatment of saccharin and aspartame, which may have been because of an expansion in oxidative worry as identified by plasma MDA levels. Also, these indicated altogether higher GFAP reactivity in the hippocampal CA1–CA3 regions contrasted with controls. There was a huge increment in serum SOD in G2 (COQ10), G3 (1/10 LD50), G5 (Sac 1/10 LD50 + COQ10), and G6 (Sacin 1/20 LD50 + COQ10) in correlation with the saccharin-treated gatherings at various levels. Corresponding with the current outcomes, Sanoobar et al. (2013) announced that following 12 weeks of treatment with COQ10 in different sclerosis patients, there was a huge abatement in MDA levels, improved serum total antioxidant capacity (TAC), and expanded SOD and Glutathione peroxidase (GPx) action contrasted and the benchmark group. This is because of the cancer prevention of COQ10, which expands nutrient E accessibility, and because of COQ10’s regulation of NO-related signaling. Likewise, Modi et al. (2006) displayed that COQ10 expanded the SOD movement in the liver homogenates of diabetic rats, which might be the consequence of a lessening in oxidative pressure. COQ10 smothers superoxide anion creation in two likely manners: (1) COQ10 lessens cytoplasmic Nicotinamide adenine dinucleotide (NADH) focus by upgrading electron transport systems and (2) COQ10 gathers electrons from the cell membrane (Kornatowska et al., 2010). COQ10 likewise may stifle superoxide anion creation through a circuitous system, by recovering α-tocopherol, which straightforwardly responds with superoxide (Lass and Sohal, 2000). The utilization of artificial sugars might be connected to the advancement of a sort of hypothyroidism called Hashimoto’s thyroid malady, which includes the invulnerable interceded pulverization of the thyroid organ that continuously prompts thyroid organ disappointment. Creature contemplates report that counterfeit sugars influence the insusceptible framework and decrease thyroid pivot movement (Helal et al., 2019; Jain, 2019). Information from this examination concurs with Sachmechi et al. (2018), who announced that the relationship between Hashimoto’s thyroiditis and the exorbitant utilization of sugar substitutes appeared by the fast return of thyroid hormones (T3 and T4) and immune response levels to typical subsequent to killing the utilization of fake sugars. This recommends that the counterfeit sugars were the offender in the advancement of Hashimoto's thyroiditis in patients. Nicolson (2014) demonstrated that the loss of mitochondria function can bring about fatigue weakness and different side effects that are basic objections in the pressings of the patient. This decrease in mitochondrial capacity may have happened because of the accompanying changes: (1) lost support of the electrical and compound transmembrane capability of the internal mitochondrial layer, (2) modifications in the capacity of the electron transport chain, or (3) a decrease in the vehicle of basic metabolites into the mitochondria. Thus, these progressions bring about decreased effectiveness of oxidative phosphorylation and a decrease in the creation of ATP structures. The current study is predictable with those revealed by Nicolson et al. (2018), who showed by clinical preliminaries the utility of oral supplements, of l-carnitine, alpha-lipoic corrosive, COQ10, phospholipids, and different immune enhancer. These enhancements can essentially decrease exhaustion and different side effects related to the disease and can normally reestablish mitochondrial function, even in patients alongside immovable weakness Anderson and Young, (2008), Camacho et al. (2018). COQ10 has been demonstrated to be extremely compelling in expanding mitochondrial capacity and diminishing weakness by lessening Reactive oxygen species (ROS)/ reactive nitrogen species (RNS) levels and forestalling some level of oxidation of mitochondrial layer phospholipids Acosta et al. (2016), Morris (1984). The presented data and biochemical parameters were confirmed by histological examination and showed recovery in G5 and G6 (Sac 1/10 LD50 + COQ10 and Sac 1/20 LD50 + COQ10, resp.) and deterioration in G3 and G4, particularly at the high Sac dose.
CONCLUSION
The obtained data concludes that COQ10 ameliorates oxidative stress, acts as a neuromodulator in the brain, and stimulates monoamine secretion.
AUTHOR CONTRIBUTIONS
All authors made substantial contributions to conception and design, acquisition of data, or analysis and interpretation of data; took part in drafting the article or revising it critically for important intellectual content; agreed to submit to the current journal; gave final approval of the version to be published; and agree to be accountable for all aspects of the work.
FUNDING
There is no funding to report.
CONFLICTS OF INTEREST
The authors report no conflicts of interest in this work.
ETHICAL APPROVAL
This study is approved by Ethics Committee of the National Research Centre, Egypt (registration number 17/004),
REFERENCES
Abhilash M, Alex M, Varghese V, Mathews R, Harikumaran N. Chronic effect of aspartame on ionic homeostasis and monoamine neurotransmitters in the rat brain. Int J Toxicol, 2014; 33(4):332–41. CrossRef
Ahmed-Farid OAH, Ahmed RF, Saleh DO. Combination of resveratrol and fluoxetine in an acute model of depression in mice: Prevention of oxidative DNA fragmentation and monoamines degradation. J Appl Pharm Sci, 2016; 6(06):001–7. CrossRef
Alsoufi MA, Aziz RA, Hussein ZG. Effect of some artificial sweeteners consumption in biochemical parameters of rats. Curr Res Microbiol Biotechnol, 2017; 5(3):1095–9.
Amin KA, Al-muzafar HM, Abd Elsttar AH. Effect of sweetener and flavoring agent on oxidative indices, liver and kidney function levels in rats. Indian J Exp Biol, 2016; 54(1):56–63.
Andreatta MM, Munoz SE, Lantieri MJ, Eynard AR, Navarro A. Artificial sweetener consumption and urinary tract tumors in Cordoba, Argentina. Prev Med, 2008; 47(1):136–9. CrossRef
Bagi SJ, Daniel EE, Rabiu KM, Ezekiel I, Sulaiman SO. Effect of oral administration of some selected sweeteners on anxiety in wistar rat model. Res Neurosci, 2017; 6(2):28–34.
Bancroft JD, Gamble M. 2008. Theory and practice of histological techniques. Churchill Livingstone Publisher and Distributor, London, UK.
Bentinger M, Tekle M, Dallner G. Coenzyme Q–biosynthesis and functions. Biochem Biophys Res Commun, 2010; 396(1):74–9. CrossRef
Bian X, Tu P, Chi L, Gao B, Ru H, Lu K. Saccharin induced liver inflammation in mice by altering the gut microbiota and its metabolic functions. Food Chem Toxicol, 2017; 107(Pt B):530–9. CrossRef
Brown RE, Corey SC, Moore AK. Differences in measures of exploration and fear in MHC-congenic C57BL/6J and B6-H-2K mice. Behav Genet, 1999; 29(2):263–71. CrossRef
Cowen PJ. Neuroendocrine and neurochemical processes in depression. J Exp Psychopathol, 2016; 3(1):3–15. CrossRef
ErbaÅŸ O, ErdoÄŸan MA, Khalilnezhad A, Solmaz V, Gürkan FT, YiÄŸittürk GHA, Eroglu HA, Taskiran D. Evaluation of long-term effects of artificial sweeteners on rat brain: a biochemical, behavioral and histological study. J Biochem Mol Toxicol, 2018; 32(6):22053–8. CrossRef
Finberg JPM, Rabey JM. Inhibitors of MAO-A and MAO-B in psychiatry and neurology. Front Pharmacol, 2016; 7(1):340–6. CrossRef
Flora SJ, Mittal M, Mehta A. Heavy metal induced oxidative stress & its possible reversal by chelation therapy. Indian J Med Res, 2008; 128(4):501–23.
Guo X, Park Y, Freedman ND, Sinha R, Hollenbeck AR, Blair A, Chen H. Sweetened beverages, coffee, and tea and depression risk among older us adults. PLoS One, 2014; 9(4):94715–20. CrossRef
Helal EGE, Abdelaziz MA, Taha NM, El-Gamal MS. The influence of acesulfame-k and aspartame on some physiological parameters in male albino rats. Egypt J Hosp Med, 2019; 75(1):1976–81.
Humphries P, Pretorius E, Naudé H. Direct and indirect cellular effects of aspartame on the brain. Eur J Clin Nutr, 2008; 62(4):451–62. CrossRef
Isingrini E, Perret L, Rainer Q, Sagueby S, Moquin L, Gratton A, Giros B. Selective genetic disruption of dopaminergic, serotonergic and noradrenergic neurotransmission: insights into motor, emotional and addictive behavior. J Psychiatry Neurosci, 2016; 41(3):169–81. CrossRef
Jain A. Autoimmune thyroiditis with hypothyroidism induced by sugar substitutes in Ayurveda - comparative study. Int J Sci Res, 2019; 8(10):59–61.
Kaoud H, Kamel MM, Abdel-Razek H, Kamel GM, Ahmed K. Neurobehavioural, neurochemical and neuromorphological effects of cadmium in male rats. J Am Sci, 2010; 6(5):189–202.
Kornatowska KK, Corresponding JC, Motyl J, Szewczyk-Golec K, Kozakiewicz M, Pawluk H, KÄ™dziora J, BÅ‚aszczak R, Banach M, Rysz J. Effects of coenzyme Q10 supplementation on activities of selected antioxidative enzymes and lipid peroxidation in hypertensive patients treated with indapamide. Arch Med Sci, 2010; 6(4):513–8. CrossRef
Kumar KS, Mamatha CH, Deepika N, Sushma B, Suthakaran R. Effects of dietary food ingredients on recognition memory by using object recognition test in mice. Res J Pharmacol Pharmacodyn, 2017; 9(2):57–60. CrossRef
Lamtai M, Chaibat J, Ouakki S, Berkiks I, El-Housseine R, El Hessni A, Mesfioui A, Tadlaoui AH, Ahyayauch H, Essamri A, Ouichou A. Effect of chronic administration of cadmium on anxiety-like, depression-like and memory deficits in male and female rats: possible involvement of oxidative stress mechanism. J Behav Brain Sci, 2018; 8(5):240–68. CrossRef
Laredj LN, Licitra F, Puccio HM. The molecular genetics of coenzyme Q biosynthesis in health and disease. Biochimie, 2014; 100(1):78–87. CrossRef
Lass A, Sohal RS. Effect of coenzyme Q10 and a-tocopherol content of mitochondria on the production of superoxide anionradicals. FASEB J. 2000; 14(1):87–94. CrossRef
Miller CL, Tainter ML. Estimation of LD and its error by means of log-probit graph paper. Proc Soc Exp Biol Med, 1944; 57(2):261–4. CrossRef
Modi KP, Santani D, Goyal RK, Bhatt P. Effect of coenzyme q10 on catalase activity and other antioxidant parameters in streptozotocin-induced diabetic rats. Biol Trace Elem Res, 2006; 109(1):25–34. CrossRef
Nicolson GL, Ferreira G, Settineri R, Ellithorpe RR, Breeding P, Ash ME. Mitochondrial dysfunction and chronic disease: treatment with membrane lipid replacement and other natural supplements mitochondrial dysfunction and chronic disease: treatment with membrane lipid replacement and other natural supplements. Mitochondrial Biol Exp Ther, 2018; 2(1):499–522. CrossRef
Nicolson GL, Settineri R, Ellithorpe R. Glycophospholipid formulation with NADH and COQ10 significantly reduces intractable fatigue in western blot-positive chroniclyme disease patients: preliminary report. Funct Foods Health Dis, 2012; 2(3):35–47. CrossRef
Nicolson GL. Mitochondrial dysfunction and chronic disease: treatment with natural supplements. Integr Med (Encinitas), 2014; 13(4):35–43.
Okoduwa SIR, Ebiloma GU, Baba J, Ajide S. The metabolism and toxicology of saccharin. Infohealth Aware Artic, 2013; 1(1):14–9.
Olama NK, Taha M, Rady HY. The potential protective role of coenzyme q10 on the cyclophosphamide induced lung toxicity in adult male albino rats: a histological and ultrastructural study. Int J Sci Rep, 2018; 4(9):225–34. CrossRef
Pravst I, Zmitek K, Zmitek J. Coenzyme Q10 contents in foods and fortification strategies. Crit Rev Food Sci Nutr, 2010; 50(4): 269–80. CrossRef
Quiles JL, Ochoa JJ, Battino M, Gutierrez-Rios P, Nepomuceno EA, Frías ML, Huertas JR, Mataix J. Life-long supplementation with a low dosage of coenzyme q10 in the rat: effects on antioxidant status and DNA damage. Biofactors, 2005; 25(1–4):73–86. CrossRef
Sachmechi I, Khalid A, Awan SI, Malik ZR, Sharifzadeh M. Autoimmune thyroiditis with hypothyroidism induced by sugar substitutes. Cureus, 2018; 10(9):3268–72. CrossRef
Sanoobar M, Eghtesadi S, Azimi A, Khalili M, Jazayeri S, Gohari MR. Coenzyme Q10 supplementation reduces oxidative stress and increases antioxidant enzyme activity in patients with relapsing-remitting multiple sclerosis. Int J Neurosci, 2013; 123(11):776–82. CrossRef
Saxena AK, Phyu HP, Al-Ani IM, Oothuman P. Improved spatial learning and memory performance following Tualang honey treatment during cerebral hypoperfusion-induced neurodegeneration. J Transl Sci, 2016; 2(5):264–71. CrossRef
Sharma A, Amarnath S, Thulasimani M, Ramaswamy S. Artificial sweeteners as a sugar substitute: are they really safe? Indian J Pharmacol. 2016; 48(3):237–40. CrossRef
Song MH, Kim HN, Lim Y, Jang IS. Effects of coenzyme Q 10 on the antioxidant system in SD rats exposed to lipopolysaccharide-induced toxicity. Lab Anim Res, 2017; 33(1):24–31. CrossRef
Swithers SE. Artificial sweeteners produce the counterintuitive effect of inducing metabolic derangements. Trends Endocrinol Metab. 2013; 24(9):431–41. CrossRef
Swithers SE, Laboy AF, Clark K, Cooper S, Davidson TL. Experience with the high-intensity sweetener saccharin impairs glucose homeostasis and GLP-1 release in rats. Behav Brain Res, 2012; 233(1) :1–14. CrossRef
Sylvetsky AC, Rother KI. Trends in the consumption of low-calorie sweeteners. Physiol Behav, 2016; 164(Pt B):446–50. CrossRef
Tsakiris M, Prabhu G, Haggard P. Having a body versus moving your body: how agency structures body-ownership. Conscious Cogn, 2006; 15(2):423–32. CrossRef
Tsao CW, Lin YS, Cheng JT, Lin CF, Wu HT, Wu SR, Tsai WH. Interferonalpha-induced serotonin uptake in Jurkat T cells via mitogen-activated protein kinase and transcriptional regulation of the serotonin transporter. J Psychopharmacol, 2008; 22(1):753–60. CrossRef
Uçar A, Yilmaz S. Saccharin genotoxicity and carcinogenicity. Adv Food Sci, 2015; 373(2):138–42.
Vaváková M, ÄŽuraÄková Z, Trebatická J. Markers of oxidative stress and neuroprogression in depression disorder. Oxid Med Cell Longev, 2015; 2015:1–12. CrossRef
Whitehouse CR, Boullata J, McCauley LA. The potential toxicity of artificial sweeteners. Workplace Health Saf, 2008; 56(6) :251–9. CrossRef
Yousef AS, Fahad AA, Abdel Moneim AE, Metwally DM, El-khadragy MF, Kassab RB. The neuroprotective role of coenzyme q10 against lead acetate-induced neurotoxicity is mediated by antioxidant, anti-inflammatory and anti-apoptotic activities. Int J Environ Res Public Health. 2019; 16(16):2895–900. CrossRef
Zhu CB, Lindler KM, Owens AW, Daws LC, Blakely RD, Hewlett A. Interleukin-1 receptor activation by systemic lipopolysaccharide induces behavioral despair linked to MAPK regulation of CNS serotonin transporters. Neuropsychopharmacology, 2010; 35(2):2510–20.