INTRODUCTION
About 40% of finished dosage forms contain chiral pharmaceutical substances, and only a quarter of them are individual enantiomers (Calcaterra and D’Acquarica, 2018). As a rule, the pharmacological activity of chiral substances is limited by one of the enantiomers – the eutomer. In some cases, the inactive enantiomer (distomer) can cause unwanted side reactions and even toxicity. The ballast nontoxic enantiomer that undergoes biotransformation exerts an additional burden on the body.
The pharmacy domain that has been actively developed during the last decade is associated with the creation of enantioselective drugs from already already known racemic substances (Challener, 2016; McConnell et al., 2007). This so-called “chiral switching” allows the eutomer to be registered as a new drug. Reducing the development time of a chiral drug largely depends on the efficiency of determining the absolute configuration and the enantiomeric purity of a substance (Calcaterra and D’Acquarica, 2018). In scientific research and the pharmaceutical industry, the X-ray crystallography, nuclear magnetic resonance, enantioselective chromatography, vibrational circular dichroism, and polarimetry are used for the recognition and separation of enantiomers (Sangamithra et al., 2019). It was proposed to create the tool kit “Chiral Technology” as a set of methods for determining the absolute stereochemistry and enantioseparation of chiral molecules (McConnell et al., 2007). The need for pure enantiomers requires the selection of the most cost-effective method of analysis, as well as the expansion of the bank of chiral instruments (Challener, 2016). The search for new reliable systems for the recognition of optical isomers is expanding. It should be directed toward methods of identification without destruction and preliminary sample preparation of a pharmaceutical substance.
These criteria are met by the method of two-dimensional dynamic light scattering (2D-LS) using the developed device and original software (Lesnikov et al., 2016).
The method has successfully proven itself in assessing the quality of liquid dosage forms: suspensions, emulsions, tinctures, and determining the authenticity of medicinal and table waters without opening the package, as well as the stability of cluster structures in waters of different isotopic composition (Bunkin et al., 2018; Goncharuk et al., 2011; Karpov et al., 2011; Koldina et al., 2019; Ul'yantsev et al., 2009). Reliability of measurements, nondestructive nature, low cost, simplicity of calibration procedures, and short measurement times are important advantages of the method in the analysis of pharmaceutical substances.
This work presents the results of applying the method of 2D-LS for the recognition of the antipodes of optically active pharmaceutical substances without preliminary sample preparation.
MATERIALS AND METHODS
The following pharmaceutical substances were a subject of research: L-valine (≥ 98% for HPLC (High Performance Liquid Chromatography), V0500), D-valine (≥ 98%, 855,987), racemic mixture L, D-valine (≥ 99.0%, 94,640), L-glucose (≥ 99 %, G5500), D-glucose (≥ 99.5%, G8270), L-ascorbic acid (≥ 99.0%, A5960). All substances were obtained from Sigma-Aldrich (Saint Louis, MO).
Dispersion of substances was carried out by grinding in a mechanical cutting knife mill (F-306, HT Machinery, Japan) by means of free, direct impact (according to Rumpf) for 20 minutes in a pulse mode (Uspenskaya et al., 2020). The particle size distribution of glucose enantiomers (before and after dispersion) was recorded by low-angle laser light scattering on a Malvern 3,600 particle counter. The radiation source was a low-power helium-neon laser emitting monochromatic light (λ = 633 nm). The measurements were carried out with stirring by placing the substances in an inert solvent (n-hexane). The distribution of the proportion (%) of particles of a given size from the total number was presented in the range 1–120 μm (Fig. 1).
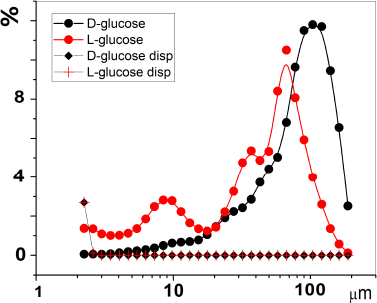 | Figure 1. Particle size distribution of glucose optical isomers before and after dispersion (m = 0.03 g; V = 3 ml; stirring; solvent n-hexane). [Click here to view] |
The distributions by volume and number fractions (“size spectra”) of D-glucose substance had one maximum at 100 µm, while L-glucose is characterized by the existence of three maxima at 10, 40, and 70 µm. After the dispersion, the particle sizes were in the submicron range.
A digital microscope (Levenhuk DTX 30) with high spectral density LEDs (Light-Emitting Diode) and a video camera connected to a personal computer was used to register instant 2D-LS. The measurements were carried out every second during 120 seconds and were repeated six times (n = 720). The data obtained were mathematically processed using the original computer program “Vidan” (Certificate No. 2005612135). The program processes a mathematical model for folding a 2D-LS pattern into descriptors that are analogs of topological indices in the method of quantitative structure-activity correlations (Sprous et al., 2010). The following 10 descriptors were used as criteria for the difference in the 2D distribution of the scattered light intensity: d1, d2, d3, standard deviation (SD)(d1), SD(d2), SD(d3), R1, R2, R3, and r (Koldina et al., 2019). The measurement results made it possible to reveal differences in the nature of the studied samples.
RESULTS AND DISCUSSION
The surface of pharmaceutical substances is a unique characteristic and its properties depend on the chemical nature of the analyzed object and the features of the synthesis. The possibility of describing the frequency and amplitude of surface microvibrations opens prospects for determining the authenticity of a substance up to the assessment of the authenticity of optical antipodes and their racemates.
The integral characteristics of the 2D-LS pattern can be represented in different ways. The primary values of the i-th descriptor on time can be used to calculate the SD and plot the dependence of the average SD of the i-th descriptor on its value . In addition, it is possible to plot the spectra of relative frequency (RF) of descriptors in coordinates “di – RF (di).” As an example of using the listed mathematical processing methods of light scattering patterns by the first descriptor (d1), the substances of L-ascorbic acid, L-valine, and L-glucose are considered (Fig. 2). As a consequence, it is easy to identify pharmaceutical substances within the framework of the chosen mathematical model. For the function RF(d1) = F(d1), a set of characteristics such as the position of the maxima, their width, and shape can be used as criteria for authenticity.
The use of mechanochemical treatment of substances in the pharmaceutical industry to increase their biological activity requires new approaches to assessing their quality (Syroeshkin et al., 2019). It was found that the dispersion of enantiomeric substances led to a change in the dynamic light scattering patterns.
Thus, the identification of glucose enantiomers after dispersion becomes impossible since the RF spectra RF(d1) = F(d1) are superimposed on each other. At the same time, native substances occupy separate areas in the range of values of the selected descriptor and can be easily identified (Fig. 3). The absence of differences in the RF of the descriptor for the substances of the D- and L-glucose optical isomers subjected to dispersion correlates with the results obtained using a low-angle laser dispersion meter (see Fig. 1). The absence of particles in the micrometer range is accompanied by the disappearance of differences in the characteristics of dynamic light scattering. Thus, light scattering by particles with a diameter of less than 1 micron does not depend on the nature of the substance. Similar patterns were observed for valine (Fig. 4).
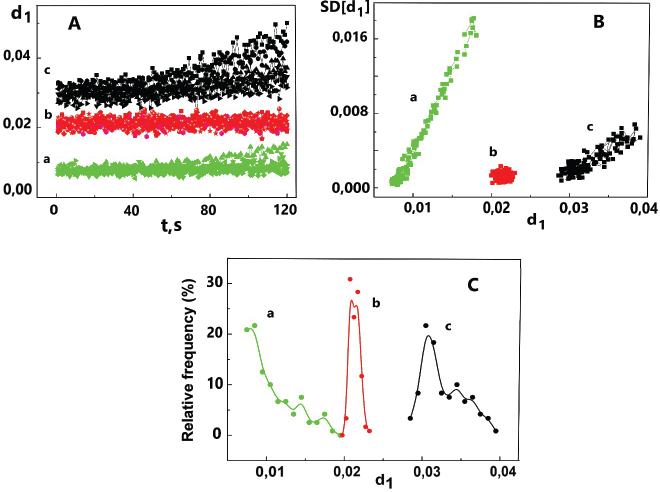 | Figure 2. Evaluation of light scattering patterns of pharmaceutical substances in the form of functions: (A) d1 = F(t); (B) SD(d1) = F(d1); (C) RF(d1) = F(d1), the relative frequency of the descriptor d1. L-ascorbic acid (a), L-valine (b), and L-glucose (c). n = 720. [Click here to view] |
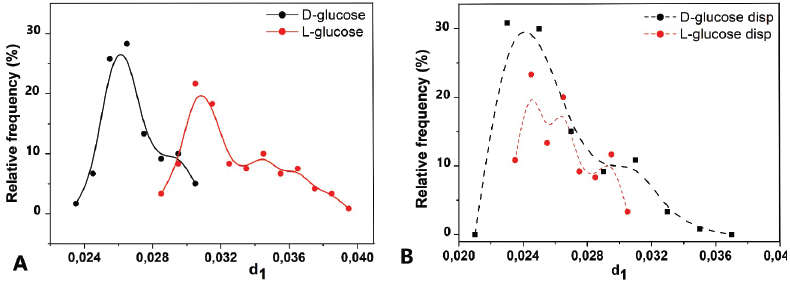 | Figure 3. 2D-LS diagrams of glucose enantiomers substances before (A) and after (B) dispersion. n = 720. [Click here to view] |
Changes in the light scattering on the time of the sample surfaces, described using the descriptors and SD(d1) = F(d1)), made it possible to identify three substances: racemic valine and its optical antipodes, D-valine, and L-valine. It should be emphasized that the identified substances are chemically indistinguishable, but the peculiarities of their spatial structure are the basis for the observed specificity of dynamic light scattering. All characteristics selected within the mathematical model framework demonstrated the possibility of identifying both enantiomers and racemate. At the same time, the dispersion of substances led to the leveling of surface differences, which was reflected in the formation of a common range of the descriptor values d1, SD(d1), and overlapping of the RF bands RF(d1).
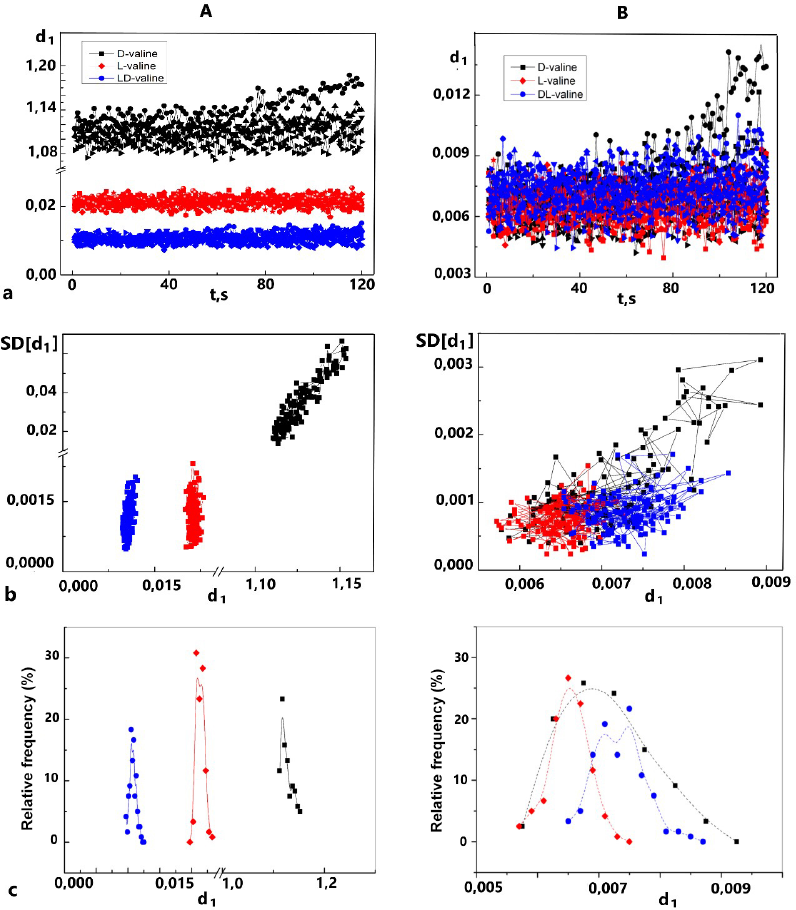 | Figure 4. 2D-LS diagrams of the valine optical antipodes and racemic mixture before (A) and after (B) dispersion: a – d1 = F(t); b – SD(d1) = F(d1), c – RF(d1) = F(d1), and n = 720. [Click here to view] |
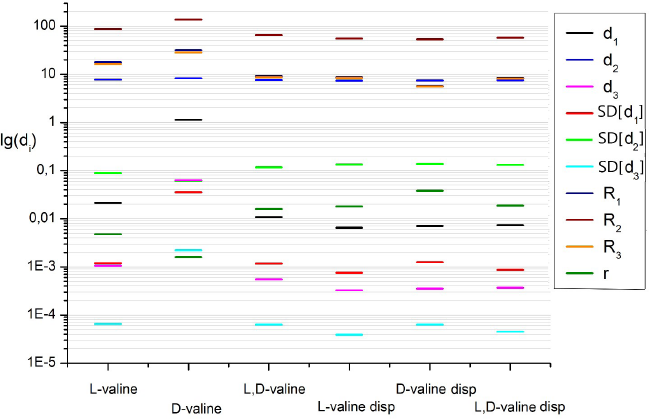 | Figure 5. Two-dimensional (2D) diagrams (“fingerprints”) of 10 descriptors of pharmaceutical substances: L-, D-, and L, D-valine. [Click here to view] |
The research was not limited to the consideration of individual descriptors. For a more detailed analysis, a multidescriptor set was used – a “fingerprint.” It also proved to be specific for the optical antipodes of valine and glucose. This is reflected in the 2D diagram (Fig. 5).
Thus, the light scattering patterns of crystals of amino acid enantiomers have clear topological differences, which make it possible to unambiguously identify the L- and D- isomers and their racemic form. At the same time, the dispersion of crystals of pharmaceutical substances led to a pronounced shift and alignment of the values of all descriptors relative to each other.
Further development of the 2D-LS method opens up prospects for its application for the analysis of the purity and authenticity of optically active and achiral pharmaceutical substances, as well as their finished dosage forms.
CONCLUSION
The use of a mathematical model of folding a 2D-LS pattern into separate descriptors makes it possible to quickly identify compounds that have the same composition and differ in spatial structure. Reliability of measurements, nondestructive nature, low cost, simplicity of calibration procedures, and short measurement times are important advantages of the method in the analysis of pharmaceutical substances, including optical antipodes.
ABBREVIATIONS
2D-LS Two-dimensional light scattering
RF Relative frequency
ACKNOWLEDGMENTS
The publication has been prepared with the support of the “RUDN University Program 5–100,” Moscow, Russian Federation.
AUTHORS’ CONTRIBUTIONS
Anton V. Syroeshkin is the author of the new method and contributed to the design of the experiment and theoretical interpretation of experimental results. Olga V. Levitskaya played a significant role in conducting the experiment and interpreting the data. Tatiana V. Pleteneva played a leading role in interpreting the data and writing this article. Elena V. Uspenskaya and Maria A. Tribot-Laspiere made significant contributions to the writing and final editing of this article. Irina V. Tarabrina made an active contribution to the acquisition, analysis, and interpretation of data for the article.
CONFLICT OF INTEREST
The authors declare no conflicts of interest related to the publication of this article.
FUNDING
This research received no external funding.
REFERENCES
Bunkin NF, Shkirin AV, Kozlov VA, Ninham BW, Uspenskaya EV, Gudkov SV. Near-surface structure of Nafion in deuterated water. J Chem Phys, 2018; 149:164901–10. CrossRef
Calcaterra A, D’Acquarica I. The market of chiral drugs: Chiral switches versus de novo enantiomerically pure compounds. J Pharm Biomed, 2018; 147:323–40. CrossRef
Challener C. Expanding the chiral toolbox: recent chiral advances demonstrate promise for API synthesis. J Pharm Biomed Anal, 2016; 40(7):28–9.
Goncharuk VV, Lapshin VB, Karpov OV, Lesnikov EV, Balakhanov DM, Dan’kin DA, Syroeshkin AV. Nanoparticles in artesian waters. J Water Chem Technol, 2011; 33(3):135–9. CrossRef
Karpov OV, Balakhanov DM, Lesnikov EV, Dankin DA, Lapshin VB, Paliy AA, Syroeshkin AV, Zagaynov VA. Agranovskii IE. Nanoparticles in ambient air. Measurement methods. Meas Tech, 2011; 54(3):269–74. CrossRef
Koldina AM, Uspenskaya EV, Borodin AA, Pleteneva TV, Syroeshkin AV. Light scattering in research and quality control of deuterium depleted water for pharmaceutical application. Int J Appl Pharm, 2019; 11(5):271–8. CrossRef
Lesnikov EV, Balakhanov DM, Syroeshkin AV. Methods and means of measuring the dispersion parameters of aerosols, suspensions and powder materials. Publishing House VNIIFTRI, Moscow, Russia, 2016. [in Russ.]
McConnell O, Bach A, Balibar C, Byrne N, Cai Y, Carter G, Ho D. Enantiomeric separation and determination of absolute stereochemistry of asymmetric molecules in drug discovery–building chiral technology toolboxes. Chirality, 2007; 19(9):658–82. CrossRef
Sangamithra R, Nagappan KV, Mukkamala S, Karthika A, Narenderan ST, Gullapalli K. A validated LC-ESI-MS/MS method for the quantification of selegiline hydrochloride in bulk and pharmaceutical formulation. J Appl Pharm Sci, 2019; 9(07):106–10. CrossRef
Sprous DG, Palmer RK, Swanson JT, Lawless M. QSAR in the pharmaceutical research setting: QSAR models for broad, large problems. Curr Top Med Chem, 2010; 10(6):619–37. CrossRef
Syroeshkin AV, Uspenskaya EV, Pleteneva TV, Morozova MA, Maksimova TV, Koldina AM, Makarova MP, Levitskaya OV, Zlatskiy IA. Mechanochemical activation of pharmaceutical substances as a factor for modification of their physical, chemical, and biological properties. Int J Appl Pharm, 2019; 11(3):118–23. CrossRef
Ul'yantsev AS, Uspenskaya EV, Pleteneva TV. Popov PI, Syroeshkin AV, Samsoni-Todorov AO, Goncharuk VV. Rapid determination of the identity of aqueous drug solutions. Pharm Chem J, 2009; 43(12):687–91. CrossRef
Uspenskaya EV, Revtova AY, Kazymova IV, Koldina AM, Pleteneva TV, Syroeshkin AV. Pham My Hanh. Grinding activation as a way to change the biological activity and physical‒chemical properties of drugs using nicotinamide as an example. Med Pharm J, 2020; 22(2):61–6.