
INTRODUCTION
Flavonoids are a group of natural products with several nutraceutical, pharmaceutical, medicinal, and cosmetic applications (Panche et al., 2016). These metabolites have been widely studied in the plants of Passiflora, a genus on which the research has increased in recent years, due to its many beneficial effects in health. Several methods have been described for the extraction of these compounds in Passiflora species, with methods varying according to the part of the plant studied: specifically for the leaves, the classical processes such us Soxhlet, sonication, percolation, decoction, and infusion have been reported. However, there are few available studies related to the optimization and validation of the extraction process (Gadioli et al., 2018). A nonconventional extraction method that has shown a potential for the processing of plant material is ultrasound-assisted extraction. This is mainly based on the cell disruption capacity of the ultrasonic waves and the cavitation phenomenon, which produce a mechanical effect that allows a greater penetration of the solvent into the matrix, and therefore, faster diffusion of plant components toward the solvent. It is, therefore, simpler, more economic, and more effective than other extraction techniques (Toma et al., 1999; Wang and Weller, 2006).
Passiflora ligularis is a species with distribution from Mexico to Bolivia, but especially along the Andes (Ocampo et al., 2015). It is associated with multiple popular medicinal uses such as nasal decongestant antitussive, regulation of digestion, and antidiarrheal properties, to treat gastritis, ulcers, and insomnia, among others (Carvajal et al., 2014). According to the previous studies conducted by the research group, extracts obtained from the leaves present promising hypoglycemic effects (unpublished data). The aim of this study was to optimize the extraction of flavonoids from the leaves of P. ligularis, employing ultrasound-assisted extraction to improve the hypoglycemic activity previously found in beverages obtained by infusion, a conventional extraction method used in traditional medicine.
MATERIALS AND METHODS
Materials
Ethanol 99.5% (PanReac AppliChem) was used for the ultrasound-assisted extraction. HPLC-grade acetonitrile (Merck®), formic acid RA (Carlo Erba), and ultrapure water (Milli-Q System Millipore®) were used for the ultra high-performance liquid chromatography (UHPLC) analysis. Isoquercetin (quercetin-3-O-β-D-glucoside, ≥90%, HPLC, Sigma-Aldrich®) was the analytical standard. Bovine serum albumin fraction V (BSA, Roche), D(-)-Ribose, extra pure (Scharlau), and quercetin ≥ 95%, (HPLC, Sigma-Aldrich®) were used for the antiglycation assay. Glucose and glibenclamide were obtained from Sigma-Aldrich®.
Plant material
The leaves of P. ligularis were collected at Anolaima, Cundinamarca, Colombia (Longitude: 74° 29.97′ O; Latitude: 4° 50.0172′ N). They were stored in the laboratory under freezing conditions at −80ºC for subsequent lyophilization for 48 hours. The lyophilized leaves were milled and sieved, and the material retained in a 40-μm mesh was selected for extraction by one of the two methods: infusion, following conditions previously reported (Costa et al., 2013), or ultrasound-assisted extraction.
A voucher specimen was deposited at the Colombian National Herbarium (COL 602878).
Ultrasound-assisted extraction (UAE)
Experimental design
A Box–Behnken experimental design was used. Three levels, low (−1), medium (0), and high (1), were evaluated for the factors of time (20, 40, and 60 minutes), temperature (30ºC, 50ºC, and 70ºC ), and percentage of ethanol (60%, 80%, and 100%), respectively. A total of 15 treatments with three replicates in the central point were made. Response surface methodology and desirability function were used to optimize the ultrasound extraction conditions for the highest flavonoid content. The optimal extraction conditions were evaluated on three different days, in triplicate, to verify the validity of the model and reproducibility of the process.
UAE experiment
A Digital Ultrasonic Cleaner (PS-30A, Shenzhen Huatai Ultrasonic Cleaning Machine Co., Ltd., Shenzhen, China) with a capacity of 6.5 l, frequency of 40 KHz, and power of 180 W was used. The plant material powder (1 g) was soaked with 20 ml of the hydroethanolic solution in a 50-ml centrifuge tube with a lid and then placed inside the ultrasonic cleaning bath. The extracts obtained under the different experimental design conditions were filtered by gravity, concentrated under reduced pressure at 40°C, frozen, and finally lyophilized for the subsequent analysis and quantification of total flavonoids by UHPLC.
Total flavonoid content (TFC) quantification
The UHPLC analysis was carried out on a Thermo Scientific Dionex Ultimate 3,000 chromatograph equipped with a Dionex Ultimate 3,000 diode array detector (DAD), Dionex Ultimate 3000 RS quaternary pump, in-line degasser, and automatic injector. The data were processed using Chromeleon Client software, version 6.80 SR15.
A Phenomenex® Kinetex C18 column (100 mm × 2.1 mm, 2.6 μm) was used at a temperature of 40°C, the flow was kept constant at 0.5 ml/minutes, and the injection volume was 10 μl. The gradient system combined 1.0% formic acid (phase A) and acetonitrile (phase B), beginning at 5%–10%B (0–10 minutes), 10%–13%B (10–20 minutes), 13%–18%B (20–25 minutes), 18%–25%B (25–32 minutes), 25%–40%B (32–38 minutes), and 40%–50%B (38–40 minutes). The analytical standard employed was isoquercetin. A calibration curve of six points was prepared at the concentrations between 5.841 and 292.7 μg/ml. Detection was performed at a wavelength of 350 nm, with DAD spectra acquired between 200 and 450 nm.
The analytical method was validated according to the guidelines of the International Conference on Harmonization (ICH, 2005). The validated parameters were linearity, precision (repeatability and intermediate precision), accuracy, limit of detection (LOD), and limit of quantification (LOQ).
TFC was quantified by the sum of all chromatographic signals with characteristic absorption spectra of flavonoids, being expressed as milligram equivalent of isoquercetin/g dry extract. All the evaluated samples were dissolved in methanol:water (1:1), in triplicate, and filtered through a 0.22-μm membrane before injection.
BSA-ribose antiglycation assay
The experimental conditions proposed by Derbré et al. (2010) with slight modifications, were followed (Sato et al., 2017). Briefly, different reaction mixtures (final volume of 100 μl) were incubated in 96-well microtiter plates. The assay solution consisted of 70 μl of BSA (10 mg/ml), 10 μl of D-ribose (0.5 M), and 5 μl of the samples (extracts or quercetin) in 50-mM phosphate buffer (pH 7.4, NaN3 0.02%). The samples were prepared in dimethyl sulfoxide (DMSO) and diluted in a buffer solution to reach the final concentrations of 500 μg/ml for all extracts and 70 μg/ml of quercetin as the positive control. The intrinsic fluorescence of the samples incubated with BSA (10 mg/ml) was subtracted from each measurement. The controls of 100% inhibition of advanced glycation end (AGE) formation consisted of BSA alone, and 100% AGE formation wells contained BSA (10 mg/ml) and D-ribose (0.5 M). Incubation was performed for 24 hours, at 37ºC, in a Heidolph Polymax 1040-Incubator 1000. AGE fluorescence measurement was made in a TECAN GENios FL spectrofluorometer (λexc: 360 nm and λem: 465 nm). The percentage of AGE inhibition was calculated as follows: % AGE inhibition = 1 – [(FIBSA + ribose + sample − FIBSA + sample) / (FIBSA + ribose − FIBSA)] × 100, where FI means fluorescence intensity.
Hypoglycemic activity
Animals
The animals were supplied by the Pharmacy Department of the National University of Colombia. Adult female Swiss ICR (Institute for Cancer Research) mice were employed for the evaluation of the hypoglycemic activity (24 animals, 47–52 weeks old, weighing of 30–43 g). The animals were acclimatized under constant temperature conditions (22°C ± 1°C) and 12-hour light/dark cycles, with feed and water ad libitum, for 1 week before the bioassay. The bioassays were carried out in accordance with the Guide for the Care and Use of Laboratory Animals (1996, published by National Academy Press, 2101 Constitution Ave. NW, Washington, DC). This study was approved by the local Research Ethics Committee (Act 09/2018 Faculty of Science).
Glucose tolerance test
To evaluate the hypoglycemic activity of the optimized extract and compare its effect with respect to the extract obtained by infusion method (crude extract), the oral glucose tolerance test was carried out by following the conditions previously established by the research group, with minor modifications (Echeverry et al., 2018). Fasting time was 6 hours; blood glucose levels (BGL) were measured before the oral administration of each treatment and glucose overload (2,000 mg/kg) at 30, 60, and 120 minutes thereafter, using an Accu-Chek Performa® device. Four groups of animals were studied: Group I: vehicle (distilled water), group II: glibenclamide as a positive control (200 mg/kg suspended in distilled water), group III: aqueous crude extract (250 mg/kg dissolved in distilled water), and group IV: the optimized hydroalcoholic extract (250 mg/kg dissolved in distilled water).The administration dose of groups III and IV was based on the previous studies conducted by the research group.
Statistical analysis
The experimental design, data analysis, and optimization of extraction conditions were performed with Minitab® software (version 17 State College, PA). GraphPad Prism® software (version 6, San Diego, CA) was employed for the correlation analysis between the antiglycation activity and the TFC and for the analysis data of glucose tolerance test.
RESULTS AND DISCUSSION
Analytical method
The concentration range between 5.841 and 292.7 μg/ml showed a high correlation with the response variable. According to the hypothesis tests of the Student’s t-test statistic (Table 1), the slope coefficient showed a statistically significant difference from 0 (estimated tb > tcr critical value), contrary to the intercept (ta < tcr). It was confirmed with 95% confidence that the data fit a linear regression model (tr > tcr). The results of the precision and accuracy of the method are shown in Table 2.
Optimization of total flavonoids by UAE
The conditions considered for evaluation through the Box–Behnken design were selected based on the literature and previous experiments conducted by the research group. A drug:solvent ratio of 1:20 was selected as a constant factor since it is an accepted laboratory scale proportion and has been previously reported as an optimum flavonoid ultrasound extraction condition (Safdar et al., 2017; Vinatoru, 2015; Wang et al., 2012). Relatively high temperatures (30ºC–70ºC) were selected because increases in temperature lead to a greater number of cavitation bubbles, a larger solid-solvent contact area, and a decrease in solvent viscosity, generating faster diffusion of the metabolites (Pingret et al., 2013; Tomaz et al., 2016). The test extractions were carried out to confirm that the compounds did not degrade at the maximum temperature. Ethanol–water mixtures were chosen as a nontoxic, environmental-friendly solvent.
The results obtained in the response variable [TFC] of the 15 Box–Behnken experiments are shown in Table 3. According to the analysis of variance (ANOVA) (Table 4), the regression model is significant and fits a linear model (p < 0.01). Besides, the p-value > 0.05 for the lack-of-fit and the coefficient of determination (R2 = 0.9613) indicate that the model has the capacity to explain correctly the variation in the response. Therefore, the following equation is adequate to predict the content of flavonoids within the design range:
 | Table 1: Sensitivity and linearity (Student’s t-test) of the isoquercetin calibration curve. [Click here to view] |
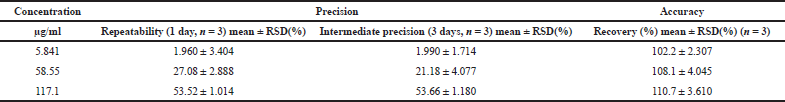 | Table 2: Precision and accuracy data of the isoquercetin calibration curve. [Click here to view] |
[TFC] = −14.2 – 0.366 f1 − 0.085 f2 + 2.347 f3 − 0.00433 f1* f1 + 0.00277 f2* f2 − 0.01878 f3* f3 + 0.00319 f1* f2 + 0.00684 f1* f3 − 0.00312 f2* f3
where f1: time, f2: temperature, and f3: ethanol percentage.
On the other hand, the only significant factor for the extraction of flavonoids was the percentage of ethanol. There is no significant interaction effect between any of the factors (time * temperature, time * ethanol, and temperature * ethanol, p > 0.05) that could affect the dependent variable.
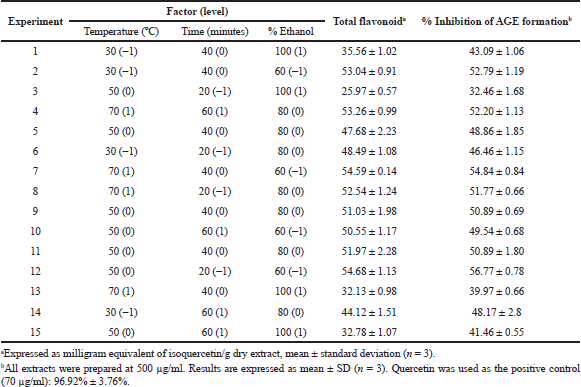 | Table 3: TFC and percentage inhibition of AGE formation in extracts obtained under the experimental design conditions. [Click here to view] |
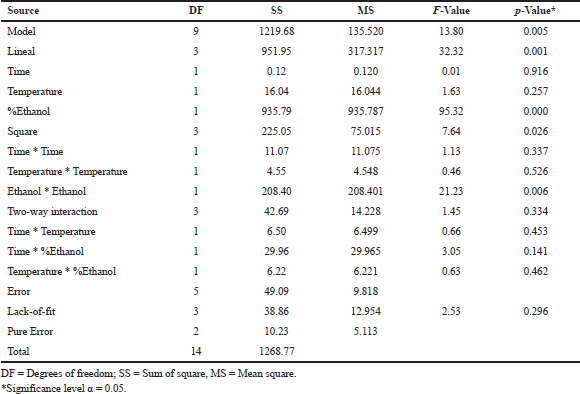 | Table 4: Analysis of variance of the model. [Click here to view] |
Response surface and contour plots are the graphical representation of the regression equation (1) used to visualize the interactive effects of two of the three variables on the content of flavonoids. As shown in Figures 1A and 2A, the changes in ethanol percentage are the ones that affect the TFC value the most. Both contour plots, Figures 1B and 2B, clearly show that hydroethanolic mixtures between 60% and 70% ethanol lead to the highest flavonoid amount (>50 mg-equivalent isoquercetin/g dry extract): in the first case, with temperatures between 60ºC and 70ºC, and in the second, independently of time. On the contrary, at the ethanol concentration levels higher than 75%, the TFC starts to decrease. The use of hydroalcoholic mixtures has been demonstrated as effective in the extraction of this type of compound (Md Yusof et al., 2019; Paini et al., 2016). The less polar character given by the ethanol allows a greater penetration of cell walls and dissolution of metabolites (Lapornik et al., 2005); meanwhile, the relative polarity of the water increases the surface area for solute-solvent contact by increasing the effective swelling of the plant material and lowering the viscosity of the mixture (Hemwimol et al., 2006; Paini et al., 2016). Figure 3A and B show that the time and temperature for the highest flavonoid content are around 40 minutes and 65ºC–70ºC, respectively. Thus, the optimal ultrasound extraction conditions with the highest desirability (1.000) are 63% ethanol, 70ºC, and 33 minutes.
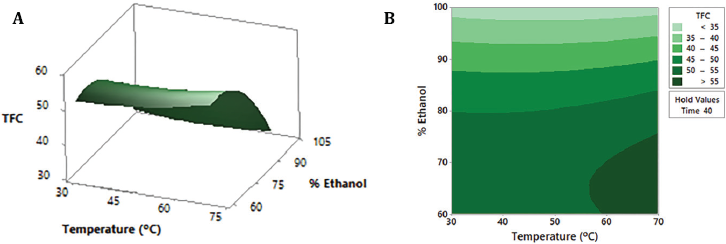 | Figure 1: Response surface (A) and contour plot (B) of TFC (mg-equivalent isoquercetin/g dry extract) as a function of ethanol percentage and temperature, maintaining the time factor at a constant medium level (40 minutes). [Click here to view] |
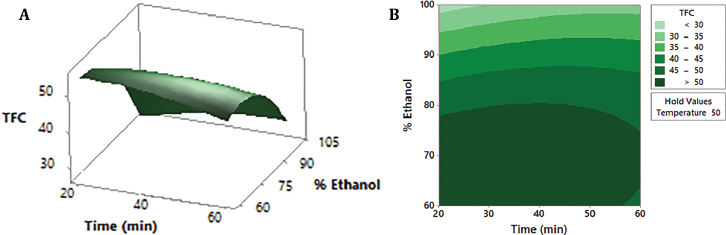 | Figure 2: Response surface (A) and contour plot (B) of TFC (mg-equivalent isoquercetin/g dry extract) as a function of ethanol percentage and time, maintaining the temperature factor at a constant medium level (50°C). [Click here to view] |
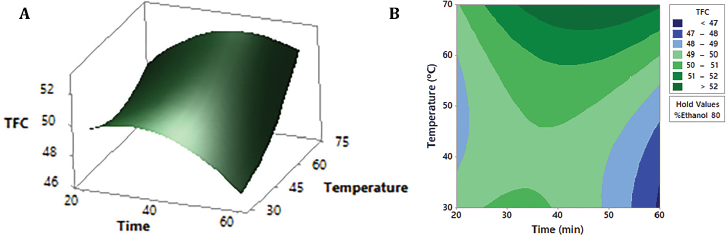 | Figure 3: Response surface (A) and contour plot (B) of TFC (mg-equivalent isoquercetin/g dry extract) as a function of temperature and time, maintaining the ethanol factor at a constant medium level (80%). [Click here to view] |
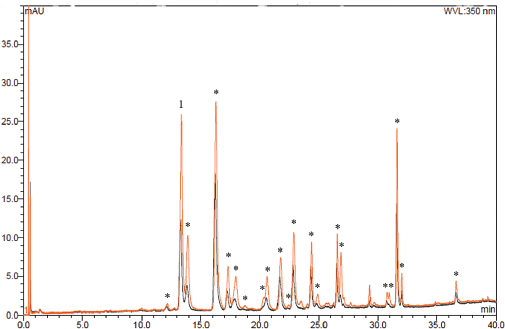 | Figure 4: Chromatogram of the extract optimized by ultrasound (orange) and the extract obtained by infusion (black). 1: Peak corresponding to isoquercetin. *: Peaks identified as flavonoids. Chromatographic conditions described in TFC quantification. [Click here to view] |
Reproducibility of the extraction process and comparison between the optimized and crude extracts
The response variable predicted by the model was 57.77 mg-equivalent isoquercetin/g dry extract, which was consistent with the TFC obtained experimentally, 59.76 ± 1.90 mg-equivalent isoquercetin/g dry extract, relative standard deviation (RSD) < 5% for the 3 days (3.18%). It demonstrates the effectiveness of the response surface modeling, in which the extraction process for P. ligularis leaves is reproducible.
Besides, this study aimed to increase the TFC in the optimized extract respect to the crude extract. Figure 4 shows the chromatographic profile of both extracts; a generalized increase in the absorbance of the metabolites is observed at 350 nm; and according to the quantification of total flavonoids, the optimization of the extraction process produced a 33% increment of TFC, compared to the infusion extract (40.22 ± 0.95 mg-equivalent isoquercetin/g dry extract).
As mentioned above, few studies related to the extraction process optimization have been performed in Passiflora species. Conditions for classical extraction techniques such as percolation and maceration have been optimized for Passiflora quadrangularis leaves (in the first case) (Echeverry et al., 2018) and Passiflora alata and Passiflora edulis by both methods (Noriega et al., 2012). However, these extraction processes are time and solvent consuming, and a lower recovery of metabolites can be obtained (Biesaga, 2011; Sun et al., 2011). On the other hand, the best supercritical fluid for the extraction (SFE) of glycosylated flavonoids from P. edulis has been studied (Moraes et al., 1997), and the optimization of the accelerated solvent extraction (ASE) of flavonoids in 17 species of Passiflora has also been reported though P. ligularis was not included (Gomes et al., 2017). Although the last two methodologies share certain advantages with the UAE, such as the reduced time and solvent consumption, and the use of environmental-friendly solvents, the ASE method is unsuitable for thermolabile compounds, and SFE requires high capital investment and maintenance costs (Ajila et al., 2011). On the contrary, ultrasound-assisted extraction is an efficient, economically viable method that can be used for the extraction of thermolabile compounds and has been effective in the extraction of phenolic compounds from different natural sources (Ajila et al., 2011; Yahya et al., 2018). First, the ultrasound mechanical wave acts as a piston that produces a displacement of the medium molecules which are compressed and can collide with others; then, a pressure decrement during the rarefaction phase pulls them apart. If the negative pressure is enough to exceed the attraction forces between them, a void or cavitation bubble is created. Once the bubbles reach a critical size and collapse near the surface of the vegetal material, an elevated pressure and temperature are released, producing microjets and shock waves that impact and induce damages in the matrix, releasing cell content or forcing the solvent into the cell, dissolving the interior components, and transporting them outside. As a consequence of this physical process of creation, enlargement, and implosion of the microbubbles, the ultrasound enhances mass transfer and cell disruption and improves penetration for metabolite extraction (Mason et al., 2005; Toma et al., 1999).
Inhibitory activity of AGE formation
Plasma proteins exposed to elevated BGL for a prolonged period of time undergo several chemical modifications and glycation reactions between the carbonyl group of reducing sugars and free amino group of proteins which lead to the formation of highly stable compounds, the advanced glycation end products (AGEs) (Ulrich and Cerami, 2001). AGE formation is accelerated in hyperglycemia, and their accumulation is associated with diabetes, diabetic nephropathy, microangiopathy, and atherosclerosis (Aldini et al., 2013). Therefore, the study of drugs with antiglycation activity represents a suitable approach to prevent or delay diabetic complications.
The inhibitory percentages of AGE formation of all design experiments shown in Table 3 were correlated with the TFC by Spearman’s correlation coefficient (ρ). A high and significant correlation between the variables was found: ρ = 0.9821, p < 0.0001. Spearman’s correlation indicates that there is a monotonic relationship between the variables (Fig. 5), whereby a higher content of flavonoids is associated with higher inhibition activity of AGE formation. This was confirmed by the inhibition percentage obtained for the optimized extract (500 μg/ml): 58.79 ± 0.51, which showed a higher inhibitory activity and TFC than the 15 treatments analyzed by Spearman’s correlation.
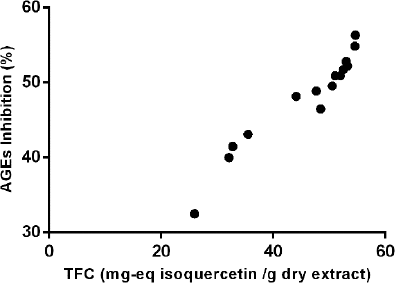 | Figure 5: Monotonic relationship between TFC and the antiglycation activity of P. ligularis leaf extracts. [Click here to view] |
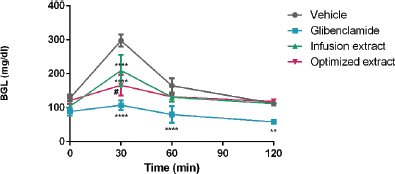 | Figure 6: Hypoglycemic activity of P. ligularis leaf extracts. Infusion and optimized extract: 250 mg/kg. Glibenclamide: 200 mg/kg. Vehicle: distilled water. Data are expressed as mean ± SEM, n = 6 animals per group. Two-way ANOVA post-test Tukey; ** p < 0.01 and **** p < 0.0001 respect to the vehicle group; # p < 0.05 respect to the infusion extract. [Click here to view] |
The antiglycation activity of some Passiflora species has been previously evaluated in glucose–fructose–BSA glycation assays. P. alata and P. edulis showed the inhibition percentages between 10% and 20% at the concentrations of 1, 5, and 10 μg/ml (Rudnicki et al., 2007), and Passiflora manicata significantly decreased the arbitrary units of fluorescence compared to total glycated BSA, at the concentrations of 1, 10, and 100 μg/ml (Da Silva Morrone et al., 2013).
Hypoglycemic effect
The hypoglycemic activity of both P. ligularis extracts, by infusion and ultrasound optimized extract, is shown in Figure 6. Although no difference between the treatments and the vehicle is seen at the times of 60–120 minutes, it is clear that the extracts attenuated the pronounced increase in BGLs 30 minutes after glucose oral overload administration and that the optimized extract exhibited an even greater hypoglycemic effect.
Although the activity of the extract may be due to the mixture of different groups of metabolites, flavonoids have been shown to play an important role in the control of glycemia and diabetes (Ballard et al., 2019; Cazarolli et al., 2008; Nicolle et al., 2011). With these results, it is confirmed that the optimization of TFC in P. ligularis leaf extract increases its hypoglycemic activity.
CONCLUSION
The optimization of flavonoids from P. ligularis leaves was successfully accomplished by ultrasound-assisted extraction. This is a method that has several advantages and had not been previously described in Passiflora extract optimization to the best of authors’ knowledge. The statistical model obtained by response surface methodology satisfactorily predicted the optimal values of the dependent variable, and the extraction process proved to be reproducible. Besides, the hypothesis of an incremented activity based on the optimization of flavonoids content was demonstrated, due to the higher effect exerted by the optimized extract in the in vitro antiglycation assay and its greater hypoglycemic activity compared to the crude extract in the glucose tolerance test.
ACKNOWLEDGMENTS
The authors acknowledge the Departamento Administrativo de Ciencia, Tecnología e Innovación, COLCIENCIAS, for funding this project through Contract No. 836, 2017. The ANLA and Ministerio de Ambiente y Desarrollo Sostenible granted permission to collect samples and perform this research (“BIOSPROSPECCION DE ESPECIES DE SOLANUM, PASSIFLORA, PHYSALIS, HYPERICUM, CECROPIA E ILEX”, código 38024, resolución 0699 de Abril 26 de 2018, Ministerio de Ambiente y Desarrollo Sostenible OtroSi No7 al contrato 121 del 22 de enero del 2016).
LIST OF ABBREVIATIONS
TFC = total flavonoid content; UHPLC = Ultra high-performance liquid chromatography; UAE = ultrasound-assisted extraction; DAD = diode array detector; ICH = International Conference on Harmonization; LOD = limit of detection; LOQ = limit of quantification; BSA = bovine serum albumin; AGEs = advanced glycation end products; ANOVA = analysis of variance; ASE = accelerated solvent extraction; SFE = supercritical fluid extraction; BGLs = blood glucose levels.
CONFLICT OF INTEREST
None.
FUNDING
Departamento Administrativo de Ciencia, Tecnología eInnovación, COLCIENCIAS, Contract No. 836, 2017.
REFERENCES
Ajila CM, Brar SK, Verma M, Tyagi RD, Godbout S, Valéro JR. Extraction and analysis of polyphenols: recent trends. Crit Rev Biotechnol, 2011; 31:227–49. CrossRef
Aldini G, Vistoli G, Stefek M, Chondrogianni N, Grune T, Sereikaite J, Sadowska-bartosz I, Bartosz G. Molecular strategies to prevent, inhibit, and degrade advanced glycoxidation and advanced lipoxidation end products. Free Radic Res, 2013; 47:93–137. CrossRef
Ballard CR, Roberto M, Junior M. Health benefits of flavonoids, In: Segura MR (ed.). Bioactive compounds: health benefits and potential applications. Woodhead Publishing, Cambridge, UK, pp 185–201, 2019. CrossRef
Biesaga M. Influence of extraction methods on stability of flavonoids. J Chromatogr A, 2011; 1218:2505–12. CrossRef
Carvajal LM, Turbay S, Álvarez LM, Rodríguez A, Álvarez JM, Bonilla K, Restrepo S, Parra M. Relación entre los usos populares de la granadilla (Passiflora ligularis Juss) y su composición fitoquímica. Biotecnol en el Sect Agropecu y Agroind, 2014; 12:185–96.
Cazarolli LH, Zanatta L, Alberton EH, Reis MS, Folador P, Damazio RG, Pizzolatti MG, Mena FR. Flavonoids: cellular and molecular mechanism of action in glucose homeostasis. Mini Rev Med Chem, 2008; 8:1032–8. CrossRef
Costa G, Gazola A, Madóglio FA, Zucolotto SM, Reginatto FH, Castellanos L, Ramos FA, Duque C, Schenkel EP. Vitexin derivatives as chemical markers in the differentiation of the closely related species Passiflora alata curtis and Passiflora quadrangularis linn. J Liq Chromatogr Relat Technol, 2013; 36:1697–707. CrossRef
Da Silva Morrone M, De Assis AM, Da Rocha RF, Gasparotto J, Gazola AC, Costa GM, Zucolotto SM, Castellanos LH, Ramos FA, Schenkel EP, Reginatto FH, Gelain DP, Moreira JCF. Passiflora manicata (Juss.) aqueous leaf extract protects against reactive oxygen species and protein glycation in vitro and ex vivo models. Food Chem Toxicol, 2013; 60:45–51. CrossRef
Derbré S, Gatto J, Pelleray A, Coulon L, Séraphin D, Richomme P. Automating a 96-well microtiter plate assay for identification of AGEs inhibitors or inducers: application to the screening of a small natural compounds library. Anal Bioanal Chem, 2010; 398:1747–58. CrossRef
Echeverry, SM, Medina, HI, Costa, GM, Aragón, DM, Optimization of flavonoid extraction from Passiflora quadrangularis leaves with sedative activity and evaluation of its stability under stress conditions. Rev Bras Farmacogn, 2018; 28:610–7. CrossRef
Echeverry SM, Valderrama IH, Costa GM, Ospina-Giraldo LF, Aragón DM. Development and optimization of microparticles containing a hypoglycemic fraction of calyces from Physalis peruviana. J App Pharm Sci, 2018; 8(05):010–018.
Gadioli IL, da Cunha MSB, de Carvalho MVO, Costa AM, Pineli LLO. A systematic review on phenolic compounds in Passiflora plants: exploring biodiversity for food, nutrition, and popular medicine. Crit Rev Food Sci Nutr, 2018; 58:785–807. CrossRef
Gomes SVF, Portugal LA, dos Anjos JP, de Jesus ON, de Oliveira EJ, David JP, David JM. Accelerated solvent extraction of phenolic compounds exploiting a Box-Behnken design and quantification of five flavonoids by HPLC-DAD in Passiflora species. Microchem J, 2017; 132:28–35. CrossRef
Hemwimol S, Pavasant P, Shotipruk A. Ultrasound-assisted extraction of anthraquinones from roots of Morinda citrifolia. Ultrason Sonochem, 2006; 13:543–48. CrossRef
ICH. Validation of analytical procedures: text and methodology - Q2(R1), Ed. EMEA, London, UK, 2005. 15p.
Lapornik B, Prosek M, Golc A. Comparison of extracts prepared from plant by-products using different solvents and extraction time. J Food Eng, 2005; 71: 214–22. CrossRef
Mason TJ, Riera E, Vercet A, Lopez-buesa P. Application of ultrasound, In: Sun DW (ed.). Emerging technologies for food processing. Academic Press, London, UK, pp 323–351, 2005. CrossRef
Md Yusof AH, Abd Gani SS, Zaidan UH, Halmi MIE, Zainudin BH. Optimization of an ultrasound-assisted extraction condition for flavonoid compounds from Cocoa Shells (Theobroma cacao) using response surface methodology. Molecules, 2019; 24:1–16. CrossRef
Moraes MDLL, Vilegas JHY, Lan FM. Supercritical fluid extraction of glycosylated flavonoids from Passiflora leaves. Phytochem Anal, 1997; 8:257–60. CrossRef
Nicolle E, Souard F, Faure P, Boumendjel A. Flavonoids as promising lead compounds in Type 2 diabetes mellitus: molecules of interest and structure-activity relationship. Curr Med Chem, 2011; 18:2661–72. CrossRef
Noriega P, Mafud D de F, de Souza B, Soares-Scott M, Rivelli D, Barros SB. de M, Bacchi, EM. Applying design of experiments (DOE) to flavonoid extraction from Passiflora alata and Passiflora edulis. Braz J Pharmacogn, 2012; 22:1119–29. CrossRef
Ocampo J, Arias JC, Urrea R. Colecta e identificación de genotipos de élite de granadilla (Passiflora ligularis Juss.) en Colombia Rev Colomb. Ciencias Hortícolas, 2015; 9:9. CrossRef
Paini M, Casazza AA, Aliakbarian B, Perego P, Binello A, Cravotto G. Influence of ethanol/water ratio in ultrasound and high-pressure/high-temperature phenolic compound extraction from agri-food waste. Int J Food Sci Technol, 2016; 51:349–58. CrossRef
Panche A, Diwan A, Chandra S. Flavonoids: an overview. J Nutr Sci, 2016; 5:1–15. CrossRef
Pingret D, Fabiano-Tixier AS, Farid C. Ultrasound-assisted Extr. In: Rostagno MA, Prado, M, (eds.). Natural product extraction: principles and applications. RSC Publishing, Cambridge, UK, pp 89–112, 2013. CrossRef
Rudnicki M, de Oliveira MR, Veiga FH, Dal-Pizzol F, Fonseca JC. Antioxidant and antiglycation properties of Passiflora alata and Passiflora edulis extracts. Food Chem, 2007; 100:719–24. CrossRef
Safdar MN, Kausar T, Nadeem M. Comparison of ultrasound and maceration techniques for the extraction of polyphenols from the mango peel. J Food Process Preserv, 2017; 41:e13028. CrossRef
Sato N, Li W, Tsubaki M, Higai K, Takemoto M, Sasaki T, Onoda T, Suzuki T, Koike K. Flavonoid glycosides from Japanese Camellia oil cakes and their inhibitory activity against advanced glycation end-products formation. J Funct Foods, 2017; 35:159–65. CrossRef
Sun Y, Liu Z, Wang J. Ultrasound-assisted extraction of five isoflavones from Iris tectorum Maxim. Sep Purif Technol, 2011; 78:49–54. CrossRef
Toma M, Vinatoru M, Mason TJ. Ultrasonically assisted extraction of bioactive principles from plants and their constituents. In: Mason TJ, (ed.). Advances in sonochemistry. JAI Press Inc, Stamford, CT, pp 209–47, 1999. CrossRef
Tomaz I, Maslov L, Stupic D, Preiner D, Ašperger D, Karoglan J. Multi-response optimisation of ultrasound-assisted extraction for recovery of flavonoids from red grape skins using response surface methodology. Phytochem. Anal, 2016; 27:13–22. CrossRef
Ulrich P, Cerami A. Protein glycation, diabetes, and aging. Recent Prog Horm Res, 2001; 56:1–21. CrossRef
Vinatoru M. Ultrasonically assisted extraction (UAE) of natural products some guidelines for good practice and reporting. Ultrason Sonochem, 2015; 25:94–5. CrossRef
Wang L, Weller CL. Recent advances in extraction of nutraceuticals from plants. Trends Food Sci Technol, 2006; 17:300–12. CrossRef
Wang X, Wu Q, Wu Y, Chen G, Yue W, Liang Q. Response surface optimized ultrasonic-assisted extraction of flavonoids from Sparganii rhizoma and evaluation of their in vitro antioxidant activities. Molecules, 2012; 17:6769–83. CrossRef
Yahya N, Attan N, Wahab R. An overview of cosmeceutically relevant plant extracts and strategies for extraction of plant-based bioactive compounds. Food Bioprod Process, 2018; 112:69–85. CrossRef