
INTRODUCTION
Hesperidin (HSP) (Fig. 1), a well-known flavonoid in citrus fruit, is the active component of the skin of oranges and mandarins: anti-inflammatory action of cross-linked citrus fruits by inhibiting the synthesis of eicosanoids (Crespo et al., 1999) and other physiological activities including hypotensive effect, lowering cholesterol rate, sepsis protective agent, and diuretic and antioxidant activities (Garg et al., 2001; Tanaka et al., 1997). It also has a protective role against intoxication due to heavy metal poisoning. It is also used to treat some cases of diabetes and gastroesophageal reflux. Before being absorbed by the intestinal mucosa, the intestinal microflora converts HSP into hesperetin.
Diosmin (DSM) (Fig. 2), also called DSM aglycone or diosmetin, is a flavonoid synthetic drug derived from HSP. It is an oral venotonic phlebropathic medicine indicated in the treatment of hemorrhoidal and venous diseases, particularly in the cases of chronic insufficiency. It has a potential effect on the case of neurodegenerative diseases including Alzheimer’s disease and has demonstrated its actions on neuron cells, especially antiapoptotic and anti-inflammatory actions. It decreases venous pressure in patients with chronic venous insufficiency. It increases the frequency of the lymphatic contraction and also its intensity. It promotes the development of lymphatic drainage in a better way by increasing the number of functional lymphatic capillaries (Srilatha et al., 2013).
 | Figure 1. Structure of HSP. [Click here to view] |
 | Figure 2. Structure of DSM. [Click here to view] |
Based on extensive literature search, several methods of analysis have been found for determination of DSM and HSP simultaneously such as spectrophotometric method (Chen et al., 2002; Srilatha et al., 2013), fluorometric method (Mir et al., 2013), chromatographic methods (AlpdoÄŸan et al., 2002; El-Shahawi et al., 2006; Janeczko et al., 2004; Pooralhossini et al., 2017), electrophoresis method (El-Zinati and Abdellatif, 2015), colorimetric method, and stripping adsorptive voltammetry (Erk, 2002).
As mentioned before and according to an extensive literature search, no spectrophotometric method by derivation or absorbance ratio was mentioned for the synchronous dosage of HSP with DSM in a binary mixture; hence, the interest for developing a spectrophotometric method can be validated for the simultaneous dosage of DSM and HSP.
The main purpose of this study is to develop two simple, fast, accurate, and economical methods for simultaneous dosage of DSM and HSP in the binary mixture and present their applications to determine the quantity of these active substances in the pharmaceutical form and to make a monitoring synthesis of DSM from HSP.
MATERIALS AND METHODS
The present work was conducted in the Laboratory of Analytical Chemistry, Faculty of Medicine and Pharmacy of Rabat.
Reagents
DSM and HSP with working standards and with different synthesis standards were purchased from Dioma Laboratory, Morocco.
A commercially available drug product was procured from a local pharmacy containing 500 mg of purified micronized flavonoid fraction corresponding to 90% of DSM (450 mg) and 10% of HSP (50 mg). Acetonitrile, methanol, DMSO, and sodium hydroxide were purchased from Merck Chemicals. Water of all dilutions was collected by using purification system of water.
Apparatus
A double-beam UV–visible spectrophotometer (PerkinElmer Lambda 12) with a wavelength accuracy of 0.3 nm and a spectral bandwidth of 1 nm was used.
Methods
Spectra of DSM and HSP with various solvents mentioned previously were recorded. 0.2 N NaOH was the best solvent of dissolution for the two substances which present the best absorbances.
The zeroth-order UV absorption spectrum of each solution was established against 0.2 N NaOH as a blank, and the wavelengths of DSM and HSP were selected.
Two different methods were developed.
First derivative method (Method A)
Method A is the derivative spectrophotometry by measurements in the zero-crossing, i.e., at λmax of product 1, the absorbance of product 2 is 0. The first derivative absorption spectra of UV spectrum for each solution against NaOH as a blank were recorded, and the curves were established.
The calibration curve was obtained by plotting the maxima of the first derivative at λmax corresponding to zero-crossing of HSP versus the corresponding concentrations. The same procedure was used for the determination of the DSM content in mixtures using the second wavelength.
Ratio absorbance peak (Method B)
Method B is used to calculate the ratio of the absorbance peak of DSM and HSP in a binary mixture.
Different mixtures of DSM and HSP were scanned, and the absorbances were noted. After that, the calibration curves are plotted to calculate the concentration of two substances in a mixture. The percentage of DSM and HSP was determined. Two ratios were chosen, and the percentage of DSM was calculated by two different ways:
For ratio 1: % DSM = ADSM/AHSP
For ratio 2: % DSM = AHSP – ADSM/AHSP
where ADSM is the absorbance of DSM (at 268 nm) and AHSP is the absorbance of HSP (at 285 nm).
The method validation
The studied methods were validated precisely according to the ICH Q2 guidelines with respect to the following parameters: linearity, precision, and accuracy (International Conference Harmonization guideline ICH Q2 (R1), 2015).
The method application
Analysis of tablet formulation
Six 500-mg tablets of commercially available drug were analyzed, and each tablet was prepared by dissolving in 500 ml of NaOH (0.2 N) after suitable dilution. The sample contains HSP and DSM diluted to 5 and 50 μg/ml−1, respectively. The absorbances were recorded, respectively, in the corresponding wavelengths for both methods A and B.
Monitoring of the synthesis of DSM
The monitoring of the synthesis of DSM was realized by method B. Different samples were taken from DSM synthesis. These samples were prepared by NaOH solution (0.2 N). After the dilution, the absorbances were scanned at λmax1 and λmax2, respectively. Three determinations were conducted at each level of the amount.
RESULTS AND DISCUSSION
For DSM and HSP determination in a mixture, zeroth-order absorption spectra of both drugs were recorded. It was found that DSM could be determined at λmax1 = 268 nm and HSP at λmax2 = 285 nm without interferences (Fig. 3).
First derivative method (Method A)
The first derivative (by zero-crossing measurements) gave two lambda values specific to each substance: 262.5 and 269 nm for DSM and HSP, respectively (Fig. 4). The calibration curve of the first derivative was established (Fig. 5a and b).
 | Figure 3. The spectra of HSP and DSM in NaOH. [Click here to view] |
 | Figure 4. First derivative spectra of HSP and DSM. [Click here to view] |
Ratio absorbance method (Method B)
The mixtures with ratios ranging from 0% to 100% were measured for DSM and HSP at 285 and 268 nm, respectively, for (ADSM/AHSP or AHSP-DSM/AHSP). Two absorbances were noted at λmax1 of DSM and λmax2 of HSP. The ratios were calculated, and the calibration lines were established (Fig. 5a and b).
Linearity was established by the least-squares linear regression analysis of calibration curve, and the calibration curves were linear in the range of 0%–100% [0%, 25% (1/4), 50% (1/2), 75% (3/4), and 100%], respectively, for absorbance ratios and absorbance difference ratios.
The method validation
Linearity
The linearity was established by the linear regression analysis of calibration curves for both the methods. For method A, the calibration curves were plotted by the absorbances as a function of the concentrations. The concentration range was 16–84 μg/ml−1 for DSM and 3–25 μg/ml−1 for HSP.
For method B, the calibration curves were plotted by the absorbance ratio of 1 or 2, and the range was from 0% to 100%. Table 1 shows all the parameters of linearity.
Precision
An appropriate statistical evaluation has been established to test the repeatability of the studied method. The concentrations of two substances were analyzed three times a day at an interval of a few days. The standard deviation (SD) and the relative SD (RSD) were calculated for both the methods (Table 2).
Accuracy
Recovery was carried out by the method of assaying a sample of drug tested at a known standard amount. For method A, the DSM and HSP samples corresponding to claims 80%, 100%, and 120% of the standard were added. For method B, mixtures [HSP%–DSM%] corresponding to [100%–0%], [80%–20%], and [60%–40%] were prepared and measured. For each sample, three determinations were made (Table 3).
The method application
Analysis of tablet formulation
For the determination of the amount of DMN and HSP in tablet formulation, the absorbances were noted, respectively, in the wavelengths of 262.5/269 nm for method A and 268/285 nm for method B. Table 4 shows the results of the determination of DMN and HSP in the tablets: quantity found (method A), percentages found (method B), and the percentages of claims on the label and RSD of the two methods.
These results showed a good agreement between the results found and the quantities labeled by the manufacturer. There is no difference between the methods A and B, and both the methods present the satisfactory results.
These methods are faster and simpler than several techniques, and hence, there was the interest in using these methods which can be considered as a useful alternative to the chromatography techniques [high-performance liquid chromatography (HPLC)] used routinely for the quality control of finished products, allowing not only qualitative information but also quantitative information to be obtained simultaneously and quickly with inexpensive instrumentation and reagents. These methods offer a clear improvement compared to conventional absorption spectrophotometry, especially in the characterization of a compound (Erk, 2000; Haripriya et al., 2013).
Monitoring the DSM synthesis
The ratio absorbance method can be used for the control of the process for the synthesis of DMN from HSP without interferences with other substances such as excipients or products used for synthesis.
The absorbances were noted at the wavelength fixed by this study (268–285 nm), and at each step, three determinations were made (Table 5).
The different spectra established for all the standards taken during the synthesis show a change in the shape of the spectrum from HSP starting product to the synthesis of DMN (Fig. 7), which consolidates the results obtained in Table 5 .
The verification of the result of monitoring was realized by another reliable method which is the HPLC. The different mixtures studied before are analyzed by HPLC, and the chromatograms confirm the results obtained by spectrophotometry. The example of chromatograms is shown in Figure 8 . The interference effect with excess reagents and byproducts on spectrophotometric analysis is very negligible in the early stages of monitoring so that the byproducts are detected separately from the DSM and HSP peaks on a scale trace.
 | Figure 5. Calibration curves of DSM after derivation at 262.5 nm (a) and HSP after derivation at 269 nm (b). [Click here to view] |
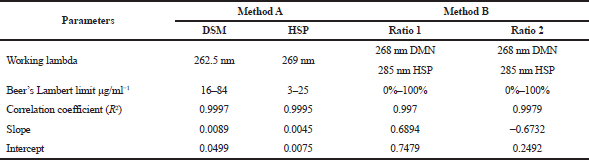 | Table 1. Parameters of linearity of methods A and B. [Click here to view] |
 | Table 2. Result of precision of methods A and B. [Click here to view] |
 | Table 3. Accuracy values of methods A and B. [Click here to view] |
 | Table 4. Analysis of tablet formulation by method A and method B. [Click here to view] |
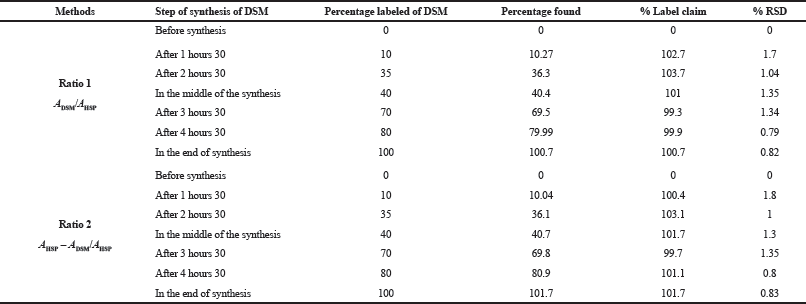 | Table 5. Analysis of different stages of the DMN synthesis by ratio absorbance method and % RSD values. [Click here to view] |
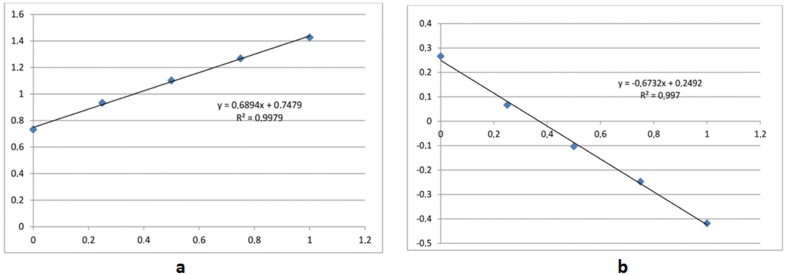 | Figure 6. Calibration lines of the ratios of absorbances (a) and ratios of the difference of absorbances (b) according to percentage in different mixtures. [Click here to view] |
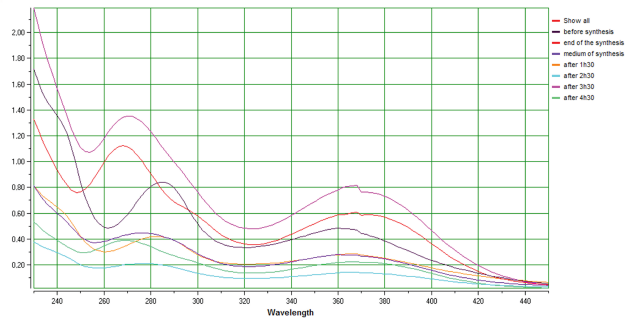 | Figure 7. Overlain spectrum of different stages of the DMN synthesis. [Click here to view] |
 | Figure 8. Chromatograms of DSM/HSP (1/4:25/75 and 3/4:75/25). [Click here to view] |
The various methods are reported in the prior art for the synthesis of DMN from HSP. There is a method that consists of the monobromination of acetylated flavanones in a chloroform solution by liquid bromide with ultraviolet radiation. The product obtained is a flavone derivative after the loss of hydrogen bromide and the deacetylation with an alcoholic alkali. Finally, the conversion of HSP to DMN is 37% (Kuntić et al., 2012).
There is also the bromination of acetylated HSP, N-bromosuccinimide in chloroform, and the benzoyl peroxide was used as a catalyst. The yield of DMN was 44% (Pavun et al., 2012).
The other methods describe the conversion of HSP, neohesperidin, and naringin to DSM, neodiosmin, and rhoifoline, respectively, by dehydrogenation with iodine in pyridine (El-Shafae and El-Domiaty, 2001) after separation and purification of DSM by macroporous resins and reported a 95% pure DSM (Campanero et al., 2010).
There is also a method describing the preparation of DSM by heating HSP, iodine, inorganic alkaline reagent, and reaction solvent in a mixture at 80°C–100°C (Mazzaferro et al., 2012). This method makes it possible to effectively avoid pyridine, which overcomes the defects of safety and product, and this is of the synthesis process that we will study in our study.
CONCLUSION
The methods presented are simple, selective, and reliable providing very good accuracy, with good specificity and good sensitivity. The results obtained are very good, and the agreement with reported protocol confirmed that the validated method can be considered as a good alternative to other costly techniques, in particular, chromatographic techniques. They could, therefore, be used easily and effectively for simultaneous dosage and determination of two active ingredients mixed in pharmaceutical form with precision. Given the time saved by these methods presented by the brief duration of the analysis. These methods can be used for both the quality control of pharmaceutical final forms and for monitoring the synthesis of DSM from HSP without interference by excipients.
CONFLICTS OF INTEREST
The authors declare no conflicts of interest in the publication of this research.
FUNDING
None.
REFERENCES
AlpdoÄŸan G, Karabina K, Sungur S. Derivative spectrophotometric determination of caffeine in some beverages. Turk J Chem, 2002; 26(2):295–302.
Campanero MA, Escolar M, Perez G, Garcia-Quetglas E, Sadaba B, Azanza JR. Simultaneous determination of diosmin and diosmetin in human plasma by ion trap liquid chromatography–atmospheric pressure chemical ionization tandem mass spectrometry: Application to a clinical pharmacokinetic study. J Pharm Biomed Anal, 2010; 51(4):875–81. CrossRef
Chen G, Zhang L, Zhao J, Ye J. Determination of hesperidin and synephrine in Pericarpium Citri Reticulatae by capillary electrophoresis with electrochemical detection. Anal Bioanal Chem, 2002; 373(3):169–73. CrossRef
Crespo M, Galvez J, Cruz T, Ocete M, Zarzuelo A. Anti-inflammatory activity of diosmin and hesperidin in rat colitis induced by TNBS. Planta Med, 1999; 65:651–53. CrossRef
El-Shafae AM, El-Domiaty MM. Improved LC methods for the determination of diosmin and/or hesperidin in plant extracts and pharmaceutical formulations. J Pharm Biomed Anal, 2001; 26(4):539–45. CrossRef
El-Shahawi M, Bashammakh A, El-Mogy T. Determination of trace levels of diosmin in a pharmaceutical preparation by adsorptive stripping voltammetry at a glassy carbon electrode. Anal Sci, 2006; 22(10):1351–4. CrossRef
El-Zinati AM, Abdel-Latif MS. Simultaneous determination of paracetamol and tramadol in pharmaceutical tablets by derivative UV–Vis absorption spectrophotometry. Open Anal Chem J, 2015; 8(1):1–6. CrossRef
Erk N. Quantitative analysis of chlorpheniramine maleate and phenylephrine hydrochloride in nasal drops by differential-derivative spectrophotometric, zero-crossing first derivative UV spectrophotometric and absorbance ratio methods. J Pharm Biom Anal, 2000; 23(6):1023–31. CrossRef
Erk N. Simultaneous determination of dorzolamide HCL and timolol maleate in eye drops by two different spectroscopic methods. J Pharm Biom Anal, 2002; 28(2):391–7. CrossRef
Garg A, Garg S, Zaneveld L, Singla A. Chemistry and pharmacology of the citrus bioflavonoid hesperidin. Phytother Res, 2001; 15(8):655–69. CrossRef
Haripriya M, Antony N, Jayasekhar P. Development and validation of uv spectrophotometric method for the simultaneous estimation of cilnidipine and telmisartan in tablet dosage form utilising simultaneous equation and absorbance ratio method. Intern J Pharma Biol Sci, 2013; 3(1):343–8.
International Conference on Harmonization guideline ICH Q2 (R1). Validation of analytical procedures: text and methodology. 2015. Available via: https://www.ich.org/fileadmin/Public_Web_Site/ICH_Products/Guidelines/Quality/Q2_R1/Step4/Q2_R1__Guideline.pdf (Accessed 30 October 2019).
Janeczko Z, Hubicka U, Podolak I, Krzek J. Qualitative and quantitative analysis of hesperidin in tablets by thin layer chromatography with densitometric UV detection. Chem Anal, 2004; 49(3):309–16.
Kuntić V, Pejić N, Mićić S. Direct spectrophotometric determination of hesperidin in pharmaceutical preparations. Acta Chim Slov, 2012; 59(2):436–41.
Mazzaferro LS, Breccia JD. Quantification of hesperidin in citrus-based foods using a fungal diglycosidase. Food Chem, 2012; 134(4):2338–44. CrossRef
Mir S, Ahangar A, Bhat A. A new, simple colorimetric method for assaying diosmin, and flavonoids in daflon tablets and orange peel extracts. Inter J Pharm Res, 2013; 5(2):341–8.
Pavun LA, Dimitrić-Marković JM, ÄurÄ‘ević PT, Jelikić-Stankov MD, Äikanović DB, Ćirić AR, Malešev D. Development and validation of spectrofluorimetric and LC–MS/MS methods for the determination of hesperidin in human plasma and pharmaceutical forms. J Serb Chem Soc, 2012; 77(11):1625–40. CrossRef
Pooralhossini J, Ghaedi M, Zanjanchi MA, Asfaram A. Ultrasonically assisted removal of Congo Red, Phloxine B and fast green FCF in ternary mixture using novel nanocomposite following their simultaneous analysis by derivative spectrophotometry. Ultrason Sonochem, 2017; 37:452–63. CrossRef
Srilatha D, Nasare M, Nagasandhya B, Prasad V, Diwan P. Development and validation of UV spectrophotometric method for simultaneous estimation of hesperidin and diosmin in the pharmaceutical dosage form. Int Scholarly Res Notices, 2013; 2013:Article ID 534830, 4. CrossRef
Tanaka T, Makita H, Kawabata K, Mori H, Kakumoto M, Satoh K, Akira H, Takashi S, Tsukasa T, Hiroshi O. Chemoprevention of azoxymethane-induced rat colon carcinogenesis by the naturally occurring flavonoids, diosmin and hesperidin. Carcinogenesis, 1997; 18(5):957–65. CrossRef