INTRODUCTION
Deflazacort (Fig. 1) is an oxazoline derivative of the well-known drug prednisolone that is chemically 11β, 21- dihydroxy-2' methyl-5'βH-pregna-1, 4-dieno [17, 16-d] oxazole 3, 20 dione 21-acetate. It produces pronounced anti-inflammatory as well as immunosuppressive activity (Markham and Bryson, 1995). It prevents the release of some chemical mediators which produces immunological responses as well as allergic responses, thereby resulting in inflammatory conditions (Joshi and Rajeshwari, 2009). The drug molecule is known to decrease white blood cells population in the circulating blood along with an acute decrease in the inflammatory chemical mediators, and therefore can be applied in organ transplants as it prevents attacking the tissues (Nayak and Acharjya, 2008). It is employed in the pharmacotherapeutics application of rheumatoid arthritis, nephrotic syndrome, pemphigus, juvenile chronic arthritis, uveitis, asthma, leukemia, and other airway diseases (Parente, 2017).
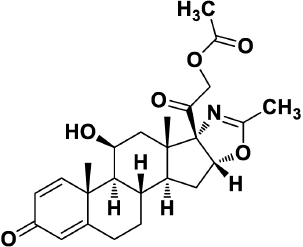 | Figure 1. Chemical Structure of Deflazacort. [Click here to view] |
The pharmacotherapeutic significance of this molecule gives rise toward the expansion of numerous assay methods. This particular molecule is not covered official in any pharmacopeia (Indian Pharmacopoeia, 2007). Numerous assay methods have been described for the complete analysis of deflazacort in pharmaceutical dosage forms [tablets (Ambalal and Patel, 2011), oral suspensions (Chougule and Naikwade, 2011), capsules (Corrêa et al., 2007), etc.] either alone or in combination with other drugs [tamsulosin (Rupapara et al., 2018), aprepitant, granisetron (Yehia and Elshabasy, 2019), etc.] as well as in the biological samples, such as plasma (Selvadurai and Meyyanathan, 2011), serum (Özkan et al., 2003), and urine (Mazzarino et al., 2008); i.e., high-performance liquid chromatography (HPLC) (Scremin et al., 2010), liquid chromatography-mass spectrometry (LC/MS) (Karthikeyan, 2013), spectrofluorimetry (Patel and Patel, 2011a), high-performance thin-layer chromatography (Patel and Patel, 2011b), etc. Literature survey reveals zero-order (Becket and Stenlake, 1997), first-order (Mohrana et al., 2011), and area under curve (AUC) (Manjunath et al., 2011) spectrophotometric methods for the determination of other drugs. Hence, after drawing inspiration from existing studies, an endeavor in developing both UV and HPLC methods for determining deflazacort in pharmaceutical tablet formulations with superior precision, simplicity, accuracy, reproducibility, robustness, and economy. Furthermore, the developed analytical method was validated as per International Council for Harmonisation (ICH) guidelines.
MATERIALS AND METHODS
Materials
Deflazacort bulk powder was obtained as a generous gift by Mahima Life Sciences Pvt. Ltd, Haryana, India. The commercially obtainable tablets of deflazacort (30 mg content) were acquired from the local market. Chemical reagents employed in this study (ethanol, potassium dihydrogen phosphate, disodium dihydrogen phosphate, methanol, acetonitrile, HPLC grade water, etc.) were of analytical grade and procured from HiMedia Ltd., Mumbai, India.
Instruments
Spectrophotometric studies were performed on a double beam UV-Visible spectrophotometer (Shimadzu Corporation, Koyto, Japan) equipped with 10 mm matched quartz cell, Model No. UV 2401 PC. The solvent used was ethanol for preparing standard stock and distilled water used for the serial dilutions of deflazacort bulk form. The samples were placed in 1 cm quartz cells and absorbance was recorded. The data was analyzed using Systronics software. HPLC analysis was carried out using Jasco PU-2089 plus, Intelligent HPLC, Quaternary Gradient Pump, Intelligent UV detector (Model No. 2070/2075 plus), ChromNav Chromatography data system, Jasco Corporation, Tokyo 192-8537, Japan. The isocratic mode containing mobile phase (acetonitrile:methanol:phosphate buffer pH 7.0) was used at a steady flow rate of 1 ml/min to determine the optimized ratio for analysis. The prepared mobile phases were sonicated (Model No. 1-5L50, PCI, Mumbai, India) and filtered through Whatman filter paper No. 41.
Preparation of stock solutions
UV spectrophotometry method
For UV spectrophotometry, 100 mg of deflazacort was weighed precisely and transferred to a volumetric flask of 100 ml volume. The solute was dissolved in ethanol to form the solution, further sonicated, and diluted to the desired mark to achieve a standard stock solution with deflazacort concentration 1,000 μg/ml. By proper dilution of the previously prepared standard stock solution in distilled water, 100 μg/ml concentration of working standard solution of deflazacort was formed. For the method development of A, B, and C, the wavelength(s) were recorded in the scanning range of 200–400 nm by first forming a standard solution of deflazacort of concentration 10 μg/ml from the working standard solution of concentration 100 μg/ml in distilled water. The simple UV, AUC spectra, and first derivative of solution were recorded.
HPLC method
For HPLC, acetonitrile:methanol:phosphate buffer pH 7.0 was used as the mobile phase. For preparation of the standard stock solution, 25 mg of deflazacort was accurately weighed and transferred to a 25 ml volumetric flask. The content dissolved in acetonitrile, further sonicated, and diluted to the desired marking to attain a standard stock solution having the final deflazacort concentration 1,000 μg/ml. By appropriate dilution of stock solution, 100 μg/ml working standard solution was prepared with the mobile phase. For the development of the method in the selection of wavelength(s), 10 μg/ml of deflazacort standard solution was prepared from the working standard solution (100 μg/ml) in the mobile phase. The 20 μl solution (10 μg/ml) was injected at a flow rate 1 ml/minute in C18 column at room temperature. The chromatogram was obtained and the peak areas were recorded.
Proposed methods
Method A is a simple absorptivity value method where the simple UV spectrum of deflazacort was acquired which displayed absorption maxima (λmax) at 247 nm. Aliquots of working standard solution were transferred into a series of volumetric flask of 100 ml volume and further diluted up to the mark with distilled water. The absorbance of the resulting solutions was measured at 247 nm against water as a blank. The calibration curve was plotted by measuring the absorbance versus concentration. The absorbance at 247 nm was recorded for the solution having concentration 10 μg/ml and the absorptivity value (A 1%, 1 cm) was calculated using formula No. 1. The calibration curve was plotted and it was found to be linear in the concentration range of 2.5–60 μg/ml.
Method B is a derivative spectrophotometric method where the simple UV spectrum of deflazacort was achieved (zero-order spectra) and derivatized to first-order derivative spectra. Maxima occur at 276.5 nm and minima at 228.2 nm. Aliquots of the working standard solution were transferred into a series of 100-ml volumetric flask and diluted up to the mark with water. First derivative spectra were attained which demonstrated absorbance maxima at 276.5 nm and minima at 228.2 nm. A calibration curve was plotted between the absorbance difference (∆A) maxima and minima versus concentration 2.5–60 μg/ml.
Method C is the AUC method which involves the calculation of the integrated value of absorbance with comparison to the wavelength between the two selected wavelengths at 230.2 and 264.4 nm. The calculation of the area bound the horizontal axis and by the curve is performed from area calculation tools. The horizontal axis is chosen by feeding the wavelength range over which the area has to be calculated. The wavelength range is chosen based on recurring examination so as to determine the linearity between the concentration and AUC. Aliquots of working standard solution were shifted into a series of 100 ml volumetric flask, diluted with water up to the mark and scanned from the wavelength range 200–400 nm in the spectrum mode. A calibration curve was plotting between the AUC versus concentration in the range of 2.5–60 μg/ml.
Method D is a HPLC method in which working standard solution is diluted with mobile phase to get concentration 10 μg/ml. The calibration curve was plotting between the peak area versus concentration range of 5–50 μg/ml.
Marketed formulation
Twenty tablets (marketed product) were weighed accurately and the average weight was estimated. The tablets were crushed uniformly to obtain a fine powder. The amount of powder corresponding to 100 mg of deflazacort was transferred into the volumetric flask of 100 ml volume, sonicated for 15 minutes with sufficient ethanol to dissolve the drug, and the volume was regulated up to the mark with the ethanol. The obtained solution was filtered using the Whatman filter paper No. 41. The obtained solution was diluted to 100 ml with distilled water to produce 10 μg/ml. This solution was analyzed by the above method (Method A, B, and C) and the % estimation was calculated using formula No. 2, 3, and 4 for methods A, B, and C, respectively.
where D.F = Dilution factor; A (1%, 1 cm) = absorptivity of deflazacort at 247 nm; and Wt = weight taken in gram.
For HPLC, tablet powder equivalent to 25 mg was accurately weighed and diluted up to 25 ml with acetonitrile, sonicated for 15 minutes. The solution obtained was filtered through Whatman filter paper No. 41 and further diluted using mobile phase to get concentration 10 μg/ml. The solution was analyzed by the above method (Method D) and % estimation was calculated using formula No. 5.
Validation
The proposed methods were validated with respect to accuracy, linearity, precision inter-day, precision inter-day, and different analyst studies and robustness with accordance to the Harmonization of Technical Requirements for Pharmaceuticals for Human Use (ICH) guidelines Q2A and Q2B and also in compliance with the US Pharmacopeia (Deodhe et al., 2017a).
Linearity
The linearity of the method was assessed at five different level concentrations ranging from 80% to 120% deflazacort test solution prepared by using the working standard solution. The linearity graph was drawn between the obtained average areas versus the drug concentration along with the expression of linear equation and regression coefficient value (r2) (Deodhe et al., 2017b).
Accuracy
The accuracy of the methods was carried out by estimating the deflazacort recovery by employing the standard addition method. The known quantities of standard solutions of deflazacort were added at 80%, 100%, and 120% levels to pre-quantified deflazacort sample solutions of 10 μg/ml. The quantity of deflazacort was determined by applying the obtained values using formula No. 6 (Sawale et al., 2017).
where A = % total amount of drug estimated; B = % amount of drug found on pre-analyzed basis; and C = % amount of pure drug added.
Precision
The precision of the method was determined by injecting the standard solution of deflazacort at three levels 50%, 75%, and 150%, three times in a single day (intra-day) and three different days (inter-day). The % RSD of the methods was recorded (Kanthale et al., 2019a).
Robustness
Robustness defines as the observed changes when a deliberate alteration is made to the chromatographic system with respect to the mobile phase composition, column temperature, detection wavelength, and flow rate while keeping other parameters constant (Kanthale et al., 2019b).
RESULTS AND DISCUSSION
The option of an analytical method depends on factors, such as the complexity of the sample, the nature of the drug, and the intended utilization of the method. For quality control in drug analysis, the fastest and simplest method is the most wanted. According to Görög, the principal method for the assaying the steroid drugs is reversed-phase HPLC (RP-HPLC) with UV detection (Gorog, 2004; 2005). However, spectrophotometric methods are also extensively employed as they are cheap and easy to perform.
Method A is a simple UV spectrophotometric method. In this method, the simple UV spectrum of deflazacort in ethanol and water was obtained which exhibits absorption maxima (λmax) at 247 nm (Fig. 2). The absorptivity value, A (1%, 1 cm) at 247 nm was calculated and found to be 360.4. The linearity regression equation was found to be Y = 0.0253x − 0.0077 with r2 value of 0.9985.
Method B is the derivative spectrophotometric method. In this method, the simple UV spectrum of deflazacort is derivatized to first-order- and second-order derivative spectra. In first-order derivative, the significant results were found and the absorption maxima observed at 276.5 nm and minima at 228.2 nm (Fig. 3). However, in second order derivative spectra, no result was found. That means higher order derivatization results in elevation of noise. The linearity regression equation was found to be Y = 0.006x − 0.0042 with r2 value of 0.9985.
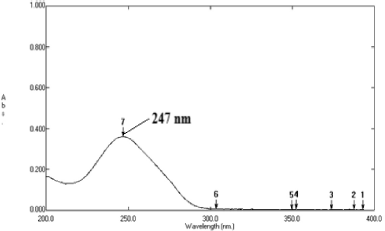 | Figure 2. Zero order spectrum of Deflazacort showing λmax at 247 nm (Method B). [Click here to view] |
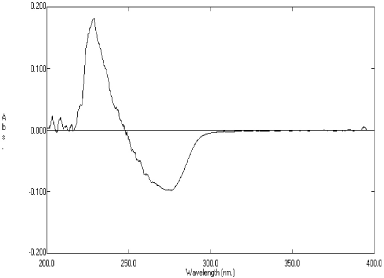 | Figure 3. First order derivative spectrum of Deflazacort showing maxima at 276.5 nm and minima at 228.2 nm (Method B). [Click here to view] |
Method C is the AUC method where the UV spectrum of deflazacort in ethanol was obtained and the area between the two chosen wavelengths was estimated. The area measured between 230.2 and 264.4 nm (Fig. 4). The linearity regression equation was found to be Y = 0.145x + 0.058 with r2 value of 0.999.
Method D is a HPLC method in which acceptable separations, with a retention time of 3.9 minutes for deflazacort, were obtained by use of a C18 column and acetonitrile: methanol: phosphate buffer pH 7.0, 90:5:5 (v/v), at 1.0 ml/minutes, as a mobile phase. A sharp, symmetrical peak was obtained for deflazacort when analyzed under these conditions (Fig. 5). This retention time enables the quick estimation of the drug molecule which is significant for the routine analysis. The detection wavelength was ï¬xed at 247 nm from UV spectra. No interference from diluents, impurities, or excipients present in the pharmaceutical formulations was observed at this detected wavelength. The linearity regression equation was found to be Y = 32295x + 4888 with r2 value of 0.998.
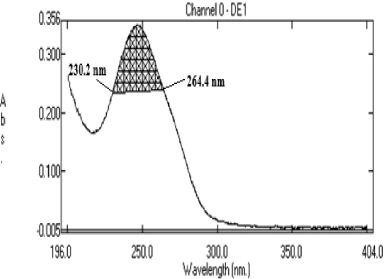 | Figure 4. AUC of Deflazacort at 230.2 nm and 264.4 nm (Method C). [Click here to view] |
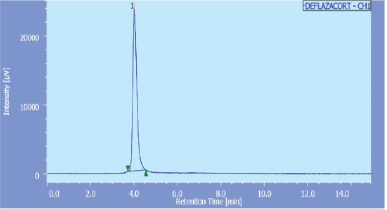 | Figure 5. Typical chromatogram of Deflazacort with retention time 4.025 minutes (Method D). [Click here to view] |
The linear correlation was observed in both spectrophotometric and chromatographic method in a concentration ranging from 2.5 to 60 μg/ml for UV and 5–50 μg/ml for HPLC. Beer’s law was well fitted in the developed linear concentrations in this analysis. Accuracy was determined by calculating the recovery, and the mean was determined (Table 1) which is in the range 98%–100% prescribed by USP, indicating that the method is free from interferences from excipients. The precision of method according to ICH guideline was ascertained by replicate estimation of the marketed formulation. It was expressed as ±SD and % RSD. This method was found to be rugged with a number of significant changes in the analytical conditions, such as different time (intra-day) (Table 2), different days (inter-day), etc (Table 3). The methods were successfully used to determine the amount of deflazacort present in tablets and calculated in terms of ±SD and % RSD value, which is in limit; i.e., less than 2 prescribed by USP for finished products (Table 4). All the validation parameters are summarized in Table 5.
When compared with one of the previous literature (Scremin et al., 2010), the present developed methods (UV-Vis and HPLC) is found to be much better in determining the amount of deflazacort present in tablets. The major disparity observed in this report was the mobile phase in HPLC method, which consists of acetonitrile:water (80:20, v/v) whereas in our case, acetonitrile:methanol:phosphate buffer pH 7.0 (90:5:5 v/v/v) is employed. The elution was observed to be far better in determining the amount of active deflazacort in tablets, as perceived exclusively from the accuracy and precision results. Acetonitrile has more eluting power than methanol but when acetonitrile:water in the ratios 80:20 v/v and 50:50 were employed, a noisy baseline and less intense peaks were observed. When the mobile phase composition; acetonitrile:methanol:water (90:5:5 v/v/v) was employed, a more intense peak was perceived. But, employing a phosphate buffer pH 7.0 instead of water resulted in a linear elution with less tailing. Asymmetry is a crucial factor in RP-HPLC where a value between 1 and 1.5 and NMT 2.0 is a seldom requirement as per ICH guidelines, which was awfully observed in case of acetonitrile: methanol: phosphate buffer mobile phase composition. The following observed characteristics: asymmetry (1.1732), column efficiency (718610.6), and standard deviation (0.5929868) indicated that this employed mobile phase has better eluting characteristics than the previously developed method. Although methanol is not a green solvent, but when acetonitrile: water was employed, a less intense peak was perceived. When methanol:water was utilized, signal splitting and base line noise was observed. However, the use of acetonitrile:methanol:water system leads to appearance of intense peaks in the chromatogram. Last, replacing the water with neutral phosphate buffer composition resulted in less tailing and proper system suitability parameters.
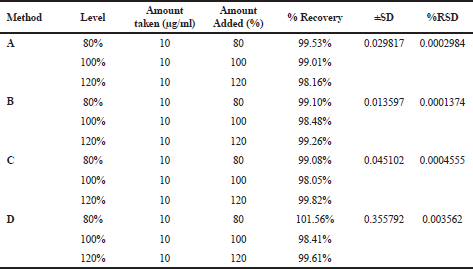 | Table 1. Accuracy of spectrophotometric and RP-HPLC method. [Click here to view] |
 | Table 2. Inter-day precision of UV and RP-HPLC method. [Click here to view] |
 | Table 3. Intra-day precision of UV and RP-HPLC method. [Click here to view] |
 | Table 4. Analysis of tablet formulation. [Click here to view] |
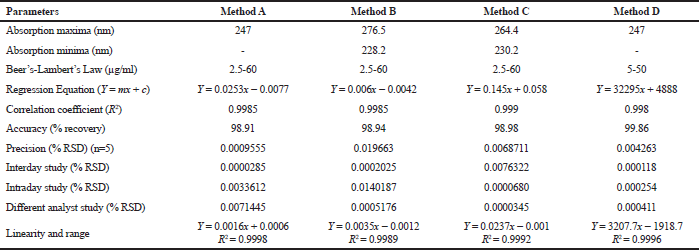 | Table 5. Summary of validation parameters. [Click here to view] |
CONCLUSION
The proposed spectrophotometric (absorptivity value method, derivative spectroscopy method, and AUC method) and RP-HPLC methods were developed and validated for the estimation of the deflazacort in the solid dosage form. The results showed that both these methods were statistically equivalent. The results of the validation parameter demonstrated that these analytical procedures are suitable and meet the criteria defined in ICH Q2A and Q2B. Analysis of deflazacort by these methods showed significantly % RSD values of less than 2, which indicated the validity of the method. Based on the study carried out, it may be concluded that the result obtained by these methods are in fair agreement, thus the analysis of solid dosage form of deflazacort may be successfully performed by the absorptivity value, derivative spectrophotometric, AUC, and RP-HPLC method.
CONSENT OF ETHICS
Not required.
CONFLICT OF INTEREST
FINANCIAL SUPPORT
No financial support declared.
REFERENCES
Ambalal PS, Patel NJ. Validated spectrophotometric methods for determination of deflazacort in tablet dosage form. Asian J Pharm Life Sci, 2011; 2231:4423.
Becket AH, Stenlake JB. Practice pharmaceutical chemistry. 4th edition, Part-II, CBS Publishers, New Delhi, India, p 285, 1997.
Chougule DD, Naikwade NS. Development and validation of high performance liquid chromatographic method for estimation of deflazacort in pharmaceutical formulation. Asian J Res Chem, 2011; 4(1):140–2.
Corrêa GM, Bellé LP, Bajerski L, Borgmann SH, Cardoso SG. Development and validation of a reversed-phase HPLC method for the determination of deflazacort in pharmaceutical dosage forms. Chromatographia, 2007; 65(9–10):591–4. CrossRef
Deodhe S, Dhabarde DM, Kamble MA, Mahapatra DK. Development and validation of a novel stability indicating RP-HPLC method for the estimation of entecavir in tablet formulation. Eur J Anal Chem, 2017a; 12(3):223–35. CrossRef
Deodhe S, Dhabarde DM, Kamble MA, Mahapatra DK. Novel stability indicating RP-HPLC method for the estimation of pinaverium bromide in tablet formulation: Assay development and validation. Eur J Anal Chem, 2017b; 12(2):3–16. CrossRef
Gorog S. Recent advances in the analysis of steroid hormones and related drugs. Analytical Sci, 2004; 20(5):767–82. CrossRef
Görög S. The sacred cow: the questionable role of assay methods in characterising the quality of bulk pharmaceuticals. J Pharm Biomed Anal, 2005; 36(5):931–7. CrossRef
Indian Pharmacopoeia. Indian Pharmacopoeia Commission (IPC). Ministry of Health & Family Welfare, Government of India, 2007.
Joshi N, Rajeshwari K. Deflazacort. J Postgrad Med, 2009; 55(4):296–300. CrossRef
Kanthale SB, Thonte SS, Mahapatra DK. Development of validated stability indicating RP-HPLC method for the estimation of glecaprevir and pibrentasvir in bulk and pharmaceutical dosage form. J Appl Pharm Sci, 2019a; 9(6):52–60. CrossRef
Kanthale SB, Thonte SS, Mahapatra DK. Stability indicating RP-HPLC method for the simultaneous estimation of ivabradin and metoprolol in bulk and tablet formulation. J Appl Pharm Sci, 2019b; 9(4):137–44. CrossRef
Karthikeyan S. A LC-MS/MS method for the quantification of deflazacort metabolite in human plasma: development, validation and application to a pharmacokinetic study. J Drug Deliv Therapeut, 2013; 3(2):75–82. CrossRef
Manjunath S, Chouhan V, Sandeep S. Spectrophotometric estimation of levosulpiride in bulk drug and formulations. Int J Pharm Sci, 2011; 3(2):135–7.
Markham A, Bryson HM. Deflazacort. Drugs, 1995; 50(2):317–33. CrossRef
Mazzarino M, Turi S, Botrè F. A screening method for the detection of synthetic glucocorticosteroids in human urine by liquid chromatography–mass spectrometry based on class-characteristic fragmentation pathways. Anal Bioanal Chem, 2008; 390(5):1389–402. CrossRef
Mohrana AK, Banerjee M, Panda S, Muduli JN. Development and validation of UV spectrophotometric method for the determination of mesalamine in bulk and tablet formulation. Int J Pharm Sci, 2011; 3(2):19–21.
Nayak S, Acharjya B. Deflazacort versus other glucocorticoids: a comparison. Indian J Dermatol, 2008; 53(4):167–70. CrossRef
Özkan Y, SavaÅŸer A, TaÅŸ Ç, Uslu B, Özkan SA. Drug dissolution studies and determination of deflazacort in pharmaceutical formulations and human serum samples by RP-HPLC. J Liq Chrom Relat Tech, 2003; 26(13):2141–56. CrossRef
Parente L. Deflazacort: therapeutic index, relative potency and equivalent doses versus other corticosteroids. BMC Pharmacol Toxicol, 2017; 18(1):1. CrossRef
Patel SA, Patel NJ. Development and validation of spectrofluorimetric method for estimation of deflazacort in tablets. J Appl Pharm Sci, 2011a; 1(7):127–31.
Patel SA, Patel NJ. High performance thin layer chromatographic method for estimation of deflazacort in tablet. J Appl Pharm Sci, 2011b; 1(07):94–8.
Rupapara VV, Dedania ZR, Dedania R. UV-spectroscopy method development and validation of deflazacort and tamsulosin hydrochloride in combined dosage form. World Journal of Pharmaceutical Research, 2018; 7(15):538–49.
Sawale V, Dhabarde DM, Mahapatra DK. Development and validation of UV spectrophotometric method for simultaneous estimation of olmesartan medoxomil and chlorthalidone in bulk and pharmaceutical dosage form. Eur J Anal Chem, 2017; 12(1):55–66. CrossRef
Scremin A, Piazzon M, Silva MA, Kuminek G, Correa GM, Paulino N, Cardoso SG. Spectrophotometric and HPLC determination of deflazacort in pharmaceutical dosage forms. Braz J Pharm Sci, 2010; 46(2):281–7. CrossRef
Selvadurai M, Meyyanathan SN. Determination of deflazacort in human plasma by liquid chromatography-mass spectrometry after liquid-liquid extraction and its application in human pharmacokinetics studies. Pharm Method, 2011; 2(2):106–11. CrossRef
Yehia AM, Elshabasy DA, Youssef NF. High-performance thin-layer chromatography for the simultaneous determination of co-administrated granisetron, aprepitant, and deflazacort used with chemotherapy: Application onto dosage forms and spiked plasma by liquid–liquid extraction. J Planar Chromatograph Modern TLC, 2019; 32(2):133–40. CrossRef