
INTRODUCTION
Malaria is an infectious disease commonly found in the tropical countries. Eukaryotic plasmodium parasites (mainly Plasmodium falciparum and Plasmodium vivax) are the root cause of this deadly disease. The mode of transmission includes the bite of anopheles mosquitoes (Mojab, 2012; Dua et al., 1998)
Pyrimethamine (PYR), an antimalarial drug, works by blocking the biosynthesis of pyrimidines and purines, which plays an important role in DNA synthesis and cell multiplication. This is achieved by inhibiting the dihydrofolatereductase of plasmodia. It is chemically 5-(4-Chloro phenyl)-6-ethylpyrimidine-2,4-diyl diamine (Meena and Sandhya, 2013). Sulfamethoxypyrazine (SLP) is a chemically 4-amino-N-(3-methoxypyrazine-2-yl)benzene-1-sulfonamide. It is long acting sulphonamide antibacterial used for the treatment of urinary tract infections, chronic bronchitis, and malaria. The combinations of PYR and SLP was more efficacious than the single one, the fixed dose regimen of combination is most promising since it is reducing the treatment period to a maximum of 24 hours (Molta et al., 1992).
The review of literature for PYR and SLP throws light on the studies performed on these drugs. There were many methods developed for PYR with a combination of sulfadoxine, by HPLC, HPTLC and spectrophotometric techniques (Acheampong et al., 2018; Green et al., 2002; Kumar et al., 2016; Onah and Odeiani, 2002; Meena and Sandhya, 2013; Meena and Sandhya, 2013; Nevado et al., 2000; Knupp et al., 1986). Pharmacokinetic study of PYR and bioavailability studies were also performed (Coleman et al., 1986; Dhapte et al., 2013). The study on fixed dose combination of artesunate/sulfamethoxypyrazine/pyrimethamine in treatment over 24 hours was also reported (Penali and Jansen, 2008). For this combination, only a single method was reported using LC/MS in plasma samples (Storme et al., 2006). Till date, no study was performed on the selected combination of drugs by HPLC method, to determine the % assay in marketed formulation. Thus, the present work demonstrates a new method for quantification of the pyrimethamine and sulfamethoxypyrazine in pharmaceutical formulation. According to ICH guidelines, the developed method was validated in terms of accuracy, precision, linearity, limit of detection, limit of quantitation, robustness, and stress degradation studies.
MATERIALS AND METHODS
Analytical grade PYR (purity ≥ 99%) and SLP (purity ≥ 99%) were obtained as gift samples from RL Fine Chemicals, Bangalore, India as a reference standard. Lari-500 (pyrimethamine-25 mg and sulfamethoxypyrazine-500 mg) tablets manufactured by IPCA laboratories Ltd., were purchased from a local pharmacy. Acetonitrile (HPLC grade) was purchased from Merck, India. Potassium dihydrogen orthophosphate used in the preparation of buffer, was procured from Sigma Aldrich, Mumbai. Milli pore HPLC grade water was obtained from Milli-Q system (Direct- Q).
Selection of wavelength for measurement
The solution of each drugs of PYR and SLP were dissolved in acetonitrile solvent was scanned over the range of 200–400 nm. It was observed that both the drugs showed significant absorbance at 254 nm of isobestic point was chosen as a desired wavelength for detection of both the drugs simultaneously (Fig. 1).
Instrumentation and chromatographic conditions
The method development was performed by Shimadzu gradient HPLC model: LC-20AD equipped with LC Solutions software having a PDA detector. HPLC column phenomenex C8 (250 mm × 4.60 mm, 5 μ) was used to analysis for a period of 10 minutes. Acetonitrile: potassium dihydrogen orthophosphate (60:40, v/v) at a flow rate 0.8 ml/minute was used as the mobile phase. Phosphate buffer prepared using Millipore water, and the phosphate solution filtered by 0.2 μm membrane filter to ensure highly pure mobile phase free from impurities. The pH of the buffer was maintained at 3.2 and the column temperature was set at room temperature. The wavelength of the detector was set at 254 nm.
 | Figure 1. Overlaid spectrum of PYR and SLP. [Click here to view] |
Sonicator (GT Sonic) facilitated uniform mixing of the drug in the diluent, pH meter (Systronics), was used for pH adjustment of the buffer. Digital balance (Shimadzu) aided in weighing of the drugs for preparation of stock solutions.
METHOD DEVELOPMENT
Preparation of standard solution
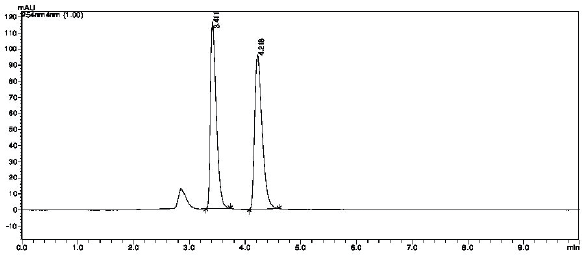
Accurately weighed 10 mg of active pharmaceutical ingredient (PYR and SLP) were added in two separate 100 ml volumetric flasks. Initial addition of 50 ml of acetonitrile, sonication for 3 minutes followed by making up the volume to100 ml was executed to achieve a concentration of 100 μg/ml for each drug. Further dilutions were made with acetonitrile having concentrations 2, 4, 8, 16, 24, and 32 μg/ml. Figure 2 demonstrates a chromatogram using final optimized conditions.
Sample preparation (Assay)
Accurately 20 tablets were weighed and crushed into a fine powder from different batches of the same formulation. Then, the weight equivalent to 10 mg each of PYR and SLP was transferred into a 100 ml volumetric flask, 50ml of acetonitrile added and sonicated for 10 minutes, further the volume made up with acetonitrile and filtered. Furthermore, 1 ml of this solution was diluted to 10 ml using acetonitrile. The filtered solution was injected five times into the HPLC system and response was recorded. The amount of drug in the formulation was calculated using the formula:
Analytical method validation
The validation of the method was done according to the ICH guidelines Q2 (R1). The developed method was validated by following validation parameters:
Linearity
Both drug linearity concentrations were prepared in the concentration range 2 to 32 μg/ml, and the calculated graph was plotted taking peak area versus concentration for the base fit line. Slope, intercept, and correlation coefficient were calculated from regression analysis of PYR and SLP.
Specificity
It is an ability to assess unequivocally the sample in presence of components which may be expected to present impurities, degrading agents, and excepients. Blank and sample solutions were prepared and analyzed to check the interference of mobile phase with the analyte (PYR and SLP).
 | Figure 2. Chromatogram of pyrimethamine and sulfamethoxypyrazine. [Click here to view] |
.png) | Figure 3. Linearity curve for (a) pyrimethamine and (b) sulfamethoxypyrazine. [Click here to view] |
Precision
Intraday precision. It was carried out by injecting six test solutions at 4, 16, and 32 μg/ml concentration and peak areas of test solutions were recorded. Results for % RSD of PYR and SLP were calculated.
Interday precision. Interday precision was carried out by injecting six test solutions 4, 16, and 32 μg/ml concentration and peak area on three successive days and conducted by different analyst under experimental condition. Results for %RSD of the peak areas of PYR and SLP were calculated.
Accuracy
According to ICH guidelines, the method was determined by recovery studies. The samples were spiked with pre-analyzed API sample solutions at three different levels of concentration in triplicate. Mean percentage recovery was calculated.
Limit of detection and quantification
The limit of detection (LOD) and limit of quantification (LOQ) is the smallest concentration of the analyte that gives a response which can be detected and measured, respectively. LOD and LOQ was calculated using the following formula:
Robustness
For robustness, following method development, the drug samples of PYR and SLP are subjected to variation in wavelength (shown in Table 4).
Stress Degradation Studies
According to ICH guidelines, the stress degradation studies were performed Q1A (R2). Using a validated analytical method, the stability studies of new drug substance and product were carried out and results were shown in Table 5.
Acid degradation studies
To 2 ml (20 μg/ml) solution of PYR and SLP stock solution, 2 ml of 0.1N HCl was added refluxed for 30 minutes at 60ºC. Later, the solution was neutralized with 2 ml of 0.1 N NaOH, then diluted to 10 ml with acetonitrile. Following the 10 μl of sample was injected and the chromatograms were recorded (Fig. 4).
Basic degradation studies / alkali degradation studies
To a 2 ml (20 μg/ml) solution of PYR and SLP stock solution, 2 ml of 0.1N NaOH refluxed for 30 minutes at 60ºC, then solution is neutralised with 2 ml of 0.1 N HCl, further it was diluted to 10 ml with acetonitrile. Following the 10 μl of sample was injected and the chromatograms were recorded (Fig. 5).
Oxidation
To a 2 ml (20 μg/ml) solution of PYR and SLP stock solution, 2 ml 3%H2O2 was added and refluxed for 30 minutes at 60°C, further it was diluted to 10 ml with acetonitrile. Following the 10 μl of sample injected and the chromatograms were recorded (Fig. 6).
Photolytic studies
The photolytic study has been performed by exposing 20 μg/ml solution in UV light by placing the beaker in UV chamber for 7 days or 200 Watt hours/m2 in photo stability chamber. Following the 10 μl of sample injected and the chromatograms were recorded (Fig. 7).
RESULTS AND DISCUSSION
Optimization of the method
Our study aimed at developing an accurate, precise, and simple method for simultaneous determination of PYR and SLP in their marketed formulation. Along these lines, initial trials were conducted using varying ratios of acetonitrile and water, in this the peak shape was not proper and tailing was observed. The selection of wavelength was based upon the isobestic point of the both drugs was shown in Figure 1. Later, the method was developed with the mobile phase as acetonitrile and potassium dihydrogen phosphate. The influence of the pH of the buffer on the retention properties was studied for this mobile phase adjusted with pH 3, 4, 5, and 6. Finally, based on the trail results, the peaks were completely separated at pH 3.2 with the ratio of 60:40 v/v. Initially, the method was developed using C18 column, but both PYR and SLP peaks were overlapping. So for effective resolution of components, changed the column to C8 with a flow rate 0.8ml/minute could effectively detected at a wavelength of 254 nm with excellent peak shapes of both PYR and SLP as shown in the Figure 2.
 | Figure 4. Chromatogram for acid degradation. [Click here to view] |
 | Figure 5. Chromatogram for basic degradation. [Click here to view] |
 | Figure 6. Chromatogram for peroxide degradation. [Click here to view] |
 | Figure 7. Chromatogram for UV degradation. [Click here to view] |
Method validation
The correlation coefficient was found to be 0.991 and 0.992 for PYR and SLP, respectively (Fig. 3). In specificity, there was no interference in blank peak so the analyte peak is not varied. For intraday precision, % RSD was found to be 0.449 and 0.739, respectively (Table 1). For interday precision, % RSD was found to be 1.022 and 1.028, respectively (Table 2). The percentage recovery of PYR and SLP at each level was within limits of 98% and 102% (Table 3). Hence, for the present work, accuracy was established and the method was found to be accurate. LOD for both PYR and SLP was found to be 2.983 and 2.297 μg/ml, respectively. LOQ for PYR and SLP was found to be 9.042 and 6.963 μg/ml, respectively. Robustness study revealed less than 2% variation in %RSD (Table 4). Degradation study results were as reported in Table 5. The results of % assay were calculated using the formula mentioned in sample preparation section and was found to be in the range of 98%–102%.
 | Table 1. Intraday precision. [Click here to view] |
 | Table 2. Interday precision. [Click here to view] |
Stress degradation studies
The degradation studies were performed as per the procedure described. The percentage of PYR in acidic and basic medium was found to be 98.132% and 96.256%, respectively. The percentage degradation for PYR, in acidic and basic medium was found to be 1.902% and 3.743%, respectively, whereas the percentage of SLP in acidic medium was found to be 94.294 % and basic medium was found to be 96.271 %. The percentage degradation of SLP in acidic is 5.70% and for basic medium is 3.728% (According to the standard values, the degraded % values are acceptable). The details of results for the same are shown in Table 5.
 | Table 3. Recovery studies. [Click here to view] |
 | Table 4. Robustness study results. [Click here to view] |
 | Table 5. Degradation study results. [Click here to view] |
An additional peak was observed for acid degradation at retention time 2.9 minutes indicating degradation of 7.6% for simultaneous analysis of PYR and SLP (Fig. 4). Additionally, basic degradation studies also revealed the presence of an extra peak at 2.9 minutes (Fig. 5). This specifies formation of degradation products with a degradation of 7.46% for simultaneous study of PYR and SLP. In case of oxidative and photolytic studies, no additional peaks were observed as well as there is no variation in drug peak area, representing degradation was not found for the drugs under oxidative (Fig. 6) and photolytic conditions (Fig. 7).
% Assay calculation in marketed formulation
CONCLUSION
The developed stability indicating method was validated in terms of accuracy, precision, linearity, limit of detection, limit of quantitation, robustness, and stress degradation studies in accordance with the ICH guidelines. From the above results, it was concluded that the HPLC method for simultaneous estimation of PYR and SLP was precise, accurate, rapid, specific, and economical. This validated method can be suggested for the routine simultaneous laboratory analysis of PYR and SLP.
ACKNOWLEDGMENT
The authors would like to thank JSS Academy of Higher Education and Research, Mysore for their facilities in successfully completion our research work.
CONFLICTS OF INTEREST
The authors affirm no conflicts of interest.
REFERENCES
Acheampong A, Gyebi A, Darko G, Apau J, OwusuGyasi W, Addai-Arhin S. Development and validation of RP-HPLC method for simultaneous estimation of sulfadoxine and pyrimethamine in tablet dosage form using diclofenac as internal standard. Cogent Chem, 2018; 4:1472198. CrossRef
Coleman MD, Thompson AJ, Edwards G, Braithwaite IM, Breckenridge AM. The pharmacokinetics of pyrimethamine in the rat: effect of mefloquine. J Pharm Pharmacol, 1986; 38 (11):840–2. CrossRef
Dhapte V, Kadam V, Pokharkar V. Pyrimethamine nanosuspension with improved bioavailability: in vivo pharmacokinetic studies. Drug Deliv Transl Res, 2013; 3(5):416–20. CrossRef
Dua VK, Sarin R, Gupta NC, Sharma VP. Sulfalene concentrations in plasma and blood cells of Plasmodium falciparum malaria cases after treatment with metakelfin using high-performance liquid chromatography. J Chromatogr B, 1998; 714(2):390–4. CrossRef
Green MD, Mount DL, Nettey H. High-performance liquid chromatographic assay for the simultaneous determination of sulfadoxine and pyrimethamine from whole blood dried onto filter paper. J Chromatogr B, 2002; 767(1):159–62. CrossRef
International Conference on Harmonisation (ICH), validation of analytical procedures: text and methodology, Q2(R1), 2005, Geneva, Switzerland.
Knupp G, Pollmann H, Jonas D. An improved HPTLC method for the rapid identification and quantification of sulfonamides. Chromatographia, 1986; 22(1–6):21–4. CrossRef
Kumar VA, Sindgi VM, Satla SR, Thimmaraju MK. Stability Indicating RP-HPLC method for the simultaneous estimation of pyrimethamine and sulphadoxine in bulk and tablet dosage form. J App Pharm Sci, 2016; 6(03):71–6. CrossRef
Meena S, Sandhya SM. Validated HPTLC method for simultaneous analysis of pyrimethamine and sulphadoxine in pharmaceutical dosage forms. J Chem, 2012; 2013. CrossRef
Meena S, Sandhya SM. Validated spectrophotometric methods for simultaneous analysis of pyrimethamine and sulphadoxine in pharmaceutical dosage forms. Asian J Pharm Clin Res, 2013; 6:121–3. CrossRef
Mojab F. Antimalarial natural products: a review. Avicenna J Phytomed, 2012; 2(2):52.
Molta NB, Daniel HI, Watila IM, Oguche SO, out TI, Ameh JO, Gadzama NM. Efficacies of chloroquine, pyrimethamine/sulphadoxine and pyrimethamine/sulphalene against P. falciparum in northeastern Nigeria. J Trop Med Hyg, 1992;95:253–9.
Nevado JB, Peñalvo GC, Bernardo FG. Simultaneous determination of sulfaquinoxaline, sulfamethazine and pyrimethamine by liquid chromatography. J Chromatogr A, 2000; 870(1–2):169–77. CrossRef
Onah JO, Odeiani JE. Simultaneous spectrophotometric determination of sulfadoxine and pyrimethamine in pharmaceutical formulations. J Pharmaceut Biomed, 2002; 30(3):851–7. CrossRef
Penali LK, Jansen FH. Single-day, three-dose treatment with fixed dose combination artesunate/sulfamethoxypyrazine/pyrimethamine to cure Plasmodium falciparum malaria. Int J Infect Dis, 2008; 12(4):430–7. CrossRef
Storme ML, Jansen FH, Goeteyn W, Van Bocxlaer JF. Simultaneous quantitative analysis of the antimalarials pyrimethamine and sulfamethoxypyrazine in plasma samples using liquid chromatography/tandem mass spectrometry. Rapid Comm Mass Spectrom, 2006; 20(19):2947–53. CrossRef