
INTRODUCTION
Tapentadol (TPD) is a synthetic analgesic drug which acts centrally. Analgesic activity of drug is due to μ-opioid agonist action and it prevents nor-epinephrine reuptake. Morphine is 18 times more potent than tapentadol to bind μ-opioid receptors and tapentadol is less effective in animals to induce analgesia. TPD increases noradrenaline concentrations by obstructing the nor-adrenaline reuptake at brain of the tats (Fidman and Nogid, 2010; Mahaparale and Samuel, 2015; Singh et al., 2013). TPD produce its analgesic effect without an active metabolite. It is chemically designated as 3-[(1R, 2R)-3-(dimethyl amino)-1- ethyl-2-methyl propyl ] phenol hydrochloride.
An average absolute bioavailability is 32% approximately due to first-pass metabolism after single-dose administration. Maximum TPD serum concentration was observed after 1.25 hours (after dosing). A multiple dose (every 6 hours) study with vary in dose from 75 to 175 mg TPD showed an average of 1.6 accumulation factor to parent drug and 1.8 is for main metabolite (TPD-O-glucuronide), which were estimated primarily by medicating interval and half-life of TPD and drug metabolite (Leonhart, 2009; Raffa, 2012; Tzschentke et al., 2006; WHO, 2014).
In humans, TPD HCl metabolism is extensive, because 97% of parent drug is metabolized. Most of the drug is metabolized through Phase-2 path, and few amount metabolized through Phase-1 pathway (oxidative). The major metabolism pathway of TPD is glucuronic acid conjugation to yield glucuronide. After administration of drug by oral route, 70% (O-glucuronide—55.0%, sulfate of TPD—15%) of the drug dose is eliminated as conjugated form in the urine (Nossaman et al., 2010; WHO, 2014).
Literature review unveils that one Liquid chromatography tandem mass spectrometry (LC-MS/MS) (Coulter et al., 2010) method and two High performance liquid chromatography (HPLC) methods (Gaurang and Hitendra, 2013; Mahaparale and Samuel, 2015) were described for the quantification of TPD. No reported technique was on bioavailability study on healthy rabbits. The goal of the research was to develop a fast and sensitive bioanalytical technique for the quantitation of TPD in plasma samples and application of pharmacokinetics in healthy rabbits by LC-MS/MS.
MATERIALS AND METHODS
Chemicals and materials
TPD (LS, purity: 99.7, Batch No.: T3A03,) and TPD-d3 (internal standard, Lot No.: CK-LT-365, purity: 98.85%) were bought from the MSN Labs, India, (chemical structure shown in Fig. 1) Acetonitrile and ammonium acetate were obtained from SD-Fine Chemicals, India. Acetic acid was acquired from MJ chemicals, Mumbai, India. Millipore water from Moscheim Cedex system utilized in processing of standard and sample solutions. SPE-cartridges were gained from Agela Technologies, China. The animal studies on healthy rabbits were approved by institutional ethical committee no-1292/ac/09/CPCSEA/17-43/A.
Liquid chromatography
Chromatographic separation achieved on LC-Shimadzu scientific instrument with Luna-C18 (5 μ, 100 mm × 4.6 mm) stationary column. Mobile phase ratio comprising ammonium acetate buffer (2 mM) and acetonitrile in the proportion of 10:90 % V/V was processed at 0.7 ml/minute flow rate. The chromatographic elution was completed in 4.5 minutes for each single analysis.
Mass system conditions
The mass detection was processed on mass system, MDS-Sciex atmospheric pressure chemical ionization (API)-4000 (Canada), furnished with electro-spray ionization ran in +MRM mode. The component and system source constraints were finalized through injecting TPD and TPD-d3 individual solutions into mass system. The optimized component parameters to monitoring TPD and TPD-d3 were as follows: Ccollision cell exit-potential: 6 V; entrance potential, 12 V; declustering potential, 36 V; and collision energy, 18 V. Mass instrument source conditions were optimized as: turbo-ion spray voltage, 5,000 V; nebulizer gas, 55 psi; collision-activated dissociation gas, 5 psi; heater gas, 45 psi; curtain gas, 18 psi and source temperature, 400 °C. Q1 and Q-3 were processed at unit resolution with dwell time of 200 ms for two analytes. Quantitation was processed by monitoring the transitions of tapentadol and tapentadol-d3 at m/z 222.2 → 177.1 and 228.2 → 183.1, respectively, in the positive ionization mode. Analyst software version 1.4.2 utilized for data acquisition and integration (MDS-Sciex, Canada) (Chen and Hsu, 2013; Jaivik et al., 2017; Patel et al., 2017).
 | Figure 1. Structure of Tapentadol. [Click here to view] |
Protocol for stock, quality control, and calibration standard solutions
Two separate TPD-stock solutions were processed for CS (calibration standard solutions) and QC (quality control solutions) samples for the method validation and sample analysis. TPD and TPD-d3 stock solutions were processed with acetonitrile to get 1 mg/ml concentration. CS and QC working solutions were processed through suitable dilution with 50%V/V acetonitrile in water. Blank plasma (K3EDTA) was infused into system before spiking to confirm that no matrix components interference at the retaining time of TPD and TPD-d3. An eight-point CS and QC-samples at four different concentrations were processed by spiking blank plasma with required quantity of TPD. CS solutions were prepared at concentration level of 0.1210, 0.3280, 1.6420, 4.1050, 10.2640, 17.1060, 28.5100, and 35.6370 ng/ml and quality control solutions at Lower limit of quantification quality control (LOQQC), Lower quality control (LQC), Medium quality control (MQC), and High quality control (HQC) at concentration level of 0.1220, 0.3590, 14.3580, and 28.7160 ng/ml, respectively (Badenhorst et al., 2000; Haritos and Ghabrial, 1999). The TPD-d3 working solution (150.0 ng/ml) was processed from TPD-d3-stock solution with 50%V/V acetonitrile in water.
Protocol for sample preparation
300 μl Plasma sample and 50 μl of TPD-d3 working solution (150 ng/ml) were transferred in ice-cold water bath and mixed well. To the resulting solution, buffer of 100 mM ammonium acetate (500 μl) was transferred and vortexed. The resulting samples were transferred into the pre-conditioned cartridge (Cleanert-PEP-3) and centrifuge (at 50,000 rpm) for 2 minutes at 2 to 10°C. The cartridges washed with 20% methanol (1 ml), and components were separated with 1 ml of acetonitrile. Then, extracted samples evaporated (at 40°C) to dryness under dry nitrogen stream utilizing Zymark Turbo-Vap-LV evaporator. Dried component was processed with 300 μl buffer of 5 mM ammonium acetate (pH-3.6) and acetonitrile in the proportion of 40:60 %V/V. 20 μl of resulting solution was infused into chromatographic system.
Method validation
The developed TPD-method was validated as per the guidelines of United States Food and Drug Administration (USFDA) and European Medicines Agency (EMEA) in human plasma. The technique was validated for specificity, precision, linearity, sensitivity, process efficiency, accuracy, re-injection reproducibility, matrix effect, dilution integrity, and stability study of TPD.
Selectivity and sensitivity
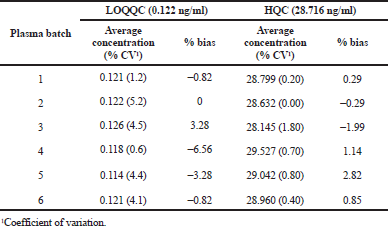
Selectivity of the method toward matrix metabolites, constituents, and associated medicaments were evaluated by screening 10 batches (2-lipemic, 2-haemolyzed, and 6-normal) of human plasma. The resulting processed samples were extracted with SPE and analyzed for TPD at limit of quantification (LOQ) level. The peak response of all the matrix components in the blank sample at TPD and IS retention times should be <20 and 5% of average peak response of TPD and TPD-d3 in LOQ level, respectively. Sensitivity of the method estimated by assessing the ratio between signal and noise (S/N) in 10 batches of screened and spiked LOQ-samples (Fahimirad et al., 2016; Rana et al., 2008; Titier et al., 2008). The S/N was measured by the following formula:
Precision and accuracy
The inter- and intra-day precision and accuracy were processed for TPD in human plasma. Within a day, intra-run and between days inter-run accuracy was analyzed six replica samples of LOQ-QC, low, medium, and high quality control levels. Method precision was evaluated by determination of % Relative standard deviation (RSD) for all quality control samples. The percentage deviation should be <15.0 (for LOQQC it should be <20.0). In the same way, the average accuracy should be ±15% ( for LOQQC it should be ±20%) (Kirchherr and Kuhn, 2006).
Linearity
To prove the linearity of technique, three calibration curves were utilized. The peak area ratios of TPD were utilized to calculate regression coefficient. Least square (1/X 2) technique was utilized to determine the linearity curves individually. TPD concentrations were determined from each calibrator using back calculation technique. Regression coefficient finding should be R2 > 0.99 desirable to all the linearity curves.
Process efficiency
TPD and TPD-d3 process efficiency (PE) at low, medium, and high quality control levels were estimated by observing the average peak area of TPD in six replica of extraction samples against the average peak area of TPD in un-extracted samples comprising TPD and TPD-d3 at concentration equals to those found in final TPD and TPD-d3 extraction samples. PE of TPD and TPD-d3 were measured by the following formula:
Matrix effect
It was estimated in the form of absolute matrix effect (AME) measured by the following formula:
If AME value is one, it indicates that no interference of matrix components, less than one indicates ion suppression, and more than one indicates ion-enhancement (Titier et al., 2008).
Dilution integrity
It was processed by making the sample concentration nearly two times the 90% upper limit of quantification (ULOQ) concentration. The resultant solution was made dilution (two and four times) with blank plasma to get the solution concentration within the calibration range. Furthermore, the resulting samples were evaluated against fresh CS solution. The acceptance norms were same as precision and accuracy parameter.
Reinjection reproducibility
It was processed by reinjecting quality control samples from accepted precision and accuracy lot in the course of validation. The concentration of reinjected solutions was evaluated against the calibration standard solutions of the same precision accuracy lot, which were estimated 48 hours before. The percentage difference between re-injected and original values was measured by utilizing the formula:
Stability
Low and High quality control samples (6) were regained from the freezer after three freeze and thaw cycles. Samples were stored at −30°C in three cycles of 24, 48, and 72 hours. For the long-term stability, QC samples were determined by analysis after 121 days of storage at −50°C. Bench-top stability was assessed for 6.5 hours period with standard concentrations. Stability solutions were prepared and extracted along with freshly spiked calibration standards. The accuracy and precision of the stability solutions should be ±15% of their nominal concentrations. The auto-sampler stability estimated after 72 hours under auto-sampler (at 10°C) condition. The freeze and thaw stability was performed by storing the QC samples at −50°C (frozen) and thawed at room conditions for three times. The change in analyte concentration was less (<15%) then the compound said to be stable (Kirchherr and Kuhn, 2006; Titier et al., 2008).
Pharmacokinetics in healthy rabbits
The kinetic constraints were measured by utilizing single dose by PK Solver from the results of plasma drug concentration verses time utilizing non-compartmental statistical method. The Cmax and Tmax were found directly from the concentration and time profiles. Linear trapezoidal technique was applied to estimate the AUC0-t. The AUC 0-∞ was determined up to the last quantifiable concentration and the terminal elimination-rate constant (Ke). The Ke value was determined from the slope of the terminal exponential phase of the plasma of the linear regression method. The terminal elimination half-life (t1/2) was calculated from 0.693/Ke.
RESULTS AND DISCUSSION
Internal standard selection
Identification and selection of IS was very important thing in an LC-MS/MS technique. The IS should have similar mass and chromatographic behavior with analyte to be determined. Stable isotope of particular analyte is the best and suitable IS for the technique. Therefore, TPD-d3 isotope chosen for TPD internal standard.
Optimization mass conditions
Negative mode Electro-spray ionization (ESI) technique was less effective when compared with positive ionization mode. Primarily, mass constraints were tried in ESI and API sources, but better results were obtained in APCI source.
Optimization of chromatography
To get the better separation of TPD and TPD-d3, different kinds of phenyl and C18 stationary columns, such as Ascentis express, Hypurity-advance, Kinetex-ODS, Zorbax SB-ODS, Sunshell-C18, Luna-ODS(2), ACE-ODS PFP, and kinetex-PFP were tried. TPD and IS were well separated using Luna-C18 100A (5 μm, 100 × 4.6 mm) column. However, mobile phase ratio comprising buffer of ammonium acetate (2 mM) pH-3.6 and acetonitrile in the proportion of 10:90 % V/V was established optimal.
Method validation
Validation of the developed method was processed as per the regulatory guidelines and around was no nosiness detected at the retention time of TPD and TPD-d3 in the lots of plasma. The blank, blank with IS, LOQ, ULOQ and incurred sample chromatograms were represented in Figure 2. The S/N-ratio during the method validation was found to be more than 25, which was acceptable in accordance with the guidelines of EMEA and USFDA.
The drug has LOQ value of 0.1210 ng/ml and the precision and accuracy values were found to be 8.62% and 98.12% at LOQQC concentration level. The linearity graph was linear over the concentration levels of 0.1210–35.6370 ng/ml for TPD. Linearity curve was made using peak response ratio of drug to IS and the “R2” value was estimated and the value was more than 0.99. Precision and accuracy were processed and the findings were tabulated in Table 1. The inter day and intra-day precision were measured in %RSD and the values were found between 1.730% and 11.380%, and the inter- and intra-day accuracy findings were present between 97.34% and 103.74%.
AME has an important role in ESI in mass system, which influences the ionization process of analyte by ion-suppression or enhancement. The AME was evaluated at quality control level and the % RSD values were found in the range of 0.84 to 4.50. The findings shows that there was no effect of matrix components for analyte after the extraction of sample. The method PE for TPD and TPD-d3 were stable across all the quality control levels. An average process efficiency of TPD and IS were found to be 77.380% and 75.040%, respectively. The % RSD of average process efficiency over low, medium, and high quality controls was less than 3. The findings of AME and PE were represented in Table 2 and the relative matrix effect findings were tabulated in Table 3.
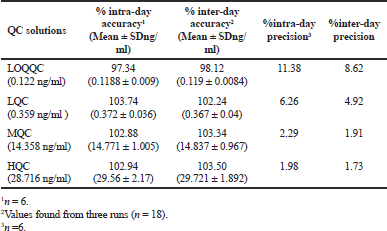 | Table 1. Intra- and inter-day results. [Click here to view] |
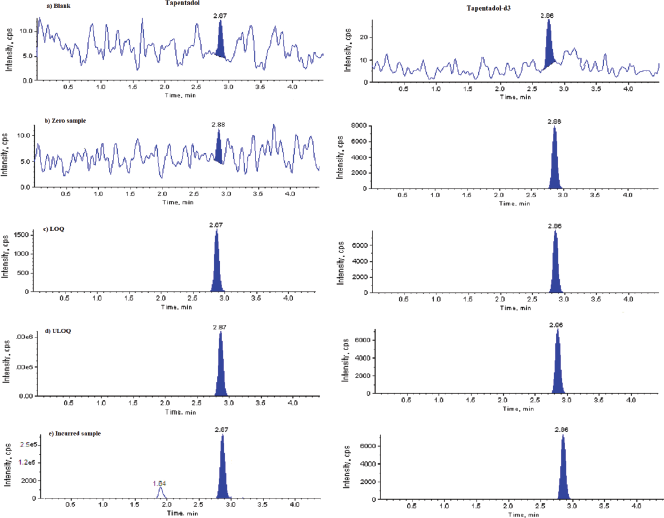 | Figure 2. Representative chromatograms. (a) Blank, (b) TPD-d3, (c) Limit of quantification, (d) Upper LOQ, and (e) Incurred sample. [Click here to view] |
Stability studies of TPD were processed for Auto-sampler stability (10°C, 76.90 hours), Bench top stability (ice-cold water, 6.5 hours), Freeze and thaw stability (3 freeze and thaw cycle), Long term stability (−50°C, 121 days) and all the findings were shown in Table 4. The detected average nominal concentrations of TPD were within ±15% of their particular nominal concentration. There was no change in the concentration of TPD drug in human-K3EDTA for 2.0 hours.
 | Table 2. Tapentadol process efficiency and absolute matrix effect. [Click here to view] |
 | Table 3. Tapentadol matrix effect. [Click here to view] |
Method Reinjection reproducibility was proven by reinjecting quality control solutions of precision and accuracy lot-3 and quantified against the actual estimated linear graph of precision and accuracy lot-3. The % change for all the reinjected quality control solutions were ≤7.450.
Application of pharmacokinetic study
Developed and validated technique was utilized in the estimation of TPD in human plasma samples to study the kinetics of single oral dose of 300 μg/1.8 kg body weight (equivalent to 4 mg capsule) in six healthy rabbits. Graph was plotted by taking plasma concentration of TPD on Y-axis and time on X-axis, the results were represented in Figure 3. This plot was plotted by considering the data between 0 and 12 hours. TPD shown Tmax of 2.27 ± 0.025 and mean Cmax, AUC0®t and AUC0®a for Test formulation is 294.82 ± 38.02, 852.72 ± 151.14, and 960.45 ± 205.069, respectively. The findings were shown in Tables 5 and 6.
 | Figure 3. Plasma (mean) concentration of TPD—time profile curve. [Click here to view] |
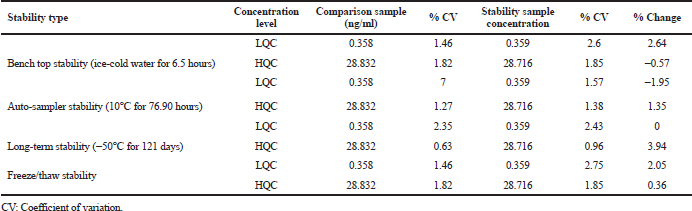 | Table 4. Tapentadol stability. [Click here to view] |
 | Table 5. Estimated plasma concentrations of healthy rabbits. [Click here to view] |
 | Table 6. Test animals estimated average values of PK parameters. [Click here to view] |
CONCLUSION
A rapid, specific, accurate, and sensitive LC-MS/MS technique was developed and validated to analyze tapentadol using tapentadol-d3 as IS in human plasma. This validated LC-MS/MS technique can be useful in high throughput analysis and has been effectively applied to study the pharmacokinetics of tapentadol in rabbits. The intra-day precision and inter-day precision in % RSD ranged from 1.73% to 11.38% and the intra-day and inter-day accuracy ranged from 97.34% to 103.74%. The average process efficiency of TPD and TPD-d3 by this technique were 77.38% and 75.04 %, respectively. LOQ was 0.121 ng/ml of TPD in plasma. The precision and accuracy at LOQQC concentration were 8.620% and 98.120%, respectively. The pharmacokinetic studies of tapentadol have shown Tmax of 2.27 ± 0.025 and mean Cmax, AUC0®t and AUC0®a for Test formulation is 294.82 ± 38.02, 852.72 ± 151.14, and 960.45 ± 205.069, respectively.
CONFLICTS OF INTEREST
The authors declare that there are no conflicts of interest.
REFERENCES
Badenhorst D, Sutherland FCW, De Jager AD. Determination of doxepin and desmethyldoxepin in human plasma using liquid chromatography-tandem mass spectrometry. J Chromatogr B, 2000; 742:91–8. CrossRef
Chen YA, Hsu KY. Development of a LC-MS/MS-based method for determining metolazone concentrations in human plasma: application to a pharmacokinetic study. J Food Drug Anal, 2013; 21:154–9. CrossRef
Coulter C, Taruc M, Tuyay J, Moore C. Determination of tapentadol and its metabolite n-desmethyltapentadol in urine and oral fluid using liquid chromatography with tandem mass spectral detection. J Anal Toxicol, 2010;34:458–63. CrossRef
Fahimirad B, Asghari A, Bazregar M. Application of tandem dispersive liquid–liquid microextraction for the determination of doxepin, citalopram, and fluvoxamine in complicated samples. J Sep Sci, 2016; 39:4828–34. CrossRef
Fidman B, Nogid A. Role of tapentadol immediate release (Nucynta)in the management of moderate-to-severe pain. Pharm Ther, 2010; 35(6):330–57.
Gaurang P, Hitendra S Joshi. Development and validation of stability indicating HPLC assay method for determination of tapentadol in tablet formulation. Int J Sci Eng Res, 2013; 4(4):1288–92.
Haritos H, Ghabrial JT Ahokas. Stereoselective measurement of Eand Z-doxepin and its N-desmethyl and hydroxylated metabolites by gas chromatography–mass spectrometry. J Chromatogr B, 1999; 736:201–8. CrossRef
Jaivik V, Shaha Priyanka A, Shaha Priya V, Shahb Mallika, Sanyalc Pranav S, Shrivastav. Fast and sensitive LC–MS/MS method for the simultaneous determination of lisinopril and hydrochlorothiazide in human plasma. J Pharm Anal, 2017; 7:163–9. CrossRef
Kirchherr H, Kuhn-Velten WN. Quantitative determination of forty-eight antidepressants and antipsychotics in human serum by HPLC tandem mass spectrometry: a multi-level, single-sample approach. J Chromatogr B, 2006; 843:100–13. CrossRef
Leonhart MM. Schedules of controlled substances: placement of tapentadol into schedule II. Fed Reg, 2009; 74(97):23790–93.
Mahaparale S, Samuel N. Quantitative estimation of tapentadol hydrochloride in human plasma by HPLC. Pharmacophore, 2015; 6(5):249–54.
Nossaman VE, Ramadhyani U, Kadowitz PJ, Nossaman BD. Advances in perioperative pain management: use of medications with dual analgesic mechanisms, tramadol & tapentadol. Anesthesiol Clin, 2010; 28(4):647–66. CrossRef
Patel NP, Sanyal M, Sharma N, Patel DS, Shrivastav PS, Patel BN. Highly sensitive LC–MS/MS method to estimate doxepin and its metabolite nordoxepin in human plasma for a bioequivalence study highly sensitive LC–MS/MS method to estimate doxepin and its metabolite nordoxepin in human plasma for a bioequivalence study. J Pharm Anal, 2017; 6:145–50.
Raffa RB, Buschmann H, Christoph T, Eichenbaum G, Englberger W, Flores CM, Hertrampf T, Kögel B, Schiene K, Straßburger W, Terlinden R, Tzschentke TM. Mechanistic and functional differentiation of tapentadol and tramadol. Expert Opin Pharmacother, 2012; 13(10):1437–49. CrossRef
Rana S, Uralets VP, Ross W. A new method for simultaneous determination of cyclic antidepressants and their metabolites in urine using enzymatic hydrolysis and fast GC-MS. J Anal Toxicol, 2008; 32:355–63. CrossRef
Singh DR, Nag K, Shetti AN, Krishnaveni N. Tapentadol hydrochloride: a novel analgesic. Saudi J Anaesth, 2013; 7(3):322–6. CrossRef
Titier K, Castaing N, Le-Deodic M. Quantification of tricyclic antidepressants and monoamine oxidase inhibitors by high-performance liquid chromatography-tandem mass spectrometry in whole blood. J Anal Toxicol, 1997; 21:200–7. CrossRef
Tzschentke TM, et al. Tapentadol hydrochloride. DrugsFuture, 2006; 31(12):1053.
WHO. Tapentadol: expert peer review on pre-review report (PDF). World Health Organization, Geneva, Switzerland, Retrieved 16 March 2014.