
INTRODUCTION
Curcumin is one of the lipophilic phenolic components of Curcuma longa which can be found in South of Asia, India, Indochina, and other Asia countries including Indonesia that is known as Curcuma domestica. The rhizome of Curcuma longa is the largest part containing curcuminoid, approximately 3%–5% in its alcoholic extract, which consists of curcumin (approximately 77%), demethoxycurcumin (approx. 18%), and bisdemethoxycurcumin (approx. 5%) (Kurita and Makino, 2013). Chemically, the International Union of Pure and Applied Chemistry name of curcumin is (1E,6E)-1,7-bis (4-hydroxy-3-methoxyphenyl)-1,6-heptadiene-3,5-dione; chemical formula C21H20O6; molecular weight 368.38 g/mol; and CAS number, 458-37-7 (NCBI, 2017).
Curcumin is used as a dietary agent, a coloring agent, and flavoring agent in the food industry. It is usually used in traditional medication as for the treatment of respiratory disease (asthma, hypersensitivity, bronchial, and allergy), sinusitis, rheumatism, fever, diabetes wound, and skin disease (Goel et al., 2008). It is also potentiated as a therapeutic agent because many research studies show that it has a pharmacologic effect such as anti-inflammatory, antioxidant, antiviral, anti-fungal, anti-bacterial, immunomodulatory, and anticancer (Maheshwari et al., 2006). Curcumin can inhibit tumor growth, angiogenesis, and induce apoptosis (Choudhuri et al., 2005; Lin et al., 2007). It also regulates the expression of cytokines inflammatory, enzymes, protein kinase, transcription factor, and growth hormone (Shishodia, 2012). Some studies in mouse and rats show that curcumin has low bioavailability in plasma and organ. Therefore, we need an accurate analytical method to assay the curcumin in biologist specimen so that we can understand the relation between the drug and its response.
Some analytical methods have been developed to quantify curcumin in biologist specimen, such as high-performance liquid chromatography with UV (Heath et al., 2003; Shoba et al., 1998; Song et al., 2011) or fluorescence detector (Schiborr et al., 2010). Another method such as LC-MS/MS is also used to analyze curcumin assay in plasma rat and it is more specific because the instrument can detect the agent in small quantity sample, especially sample which has low oral bioavailability. To know whether the method is accurate, specific, and robust, the method should be validated. In this study, we have developed and validated bioanalytical method to quantify curcumin in rat plasma and ovary based on European Medicine Agency (EMA) (2012) Guideline on bioanalytical method validation.
MATERIALS AND METHODS
Chemicals and reagent
Curcumin (ex. Plamed), internal standard (IS) (Propanolol), acetonitrile (ex. Merck), formic acid (ex. Merck), H2O, and tert-butyl methyl ether(MTBE) (ex. Merck).
UPLC-MS/MS system
The Ultra Performance Liquid Chromatography (UPLC)-Mass Spectrometry (MS)/MS system was performed using a Waters with an automatic liquid chromatography sampler and mass spectrometer equipped with an electrospray ionization (ESI) source. The separation of the sample used column Acquity UPLC® BEH C18 column (2.1× 50 mm, 1.7 μm). The system delivered as a constant flow with gradient mobile phase as showed in Table 1.
The volume of injection was 3 μl. Mobile phase was filtered through filter membrane 45 μm and had been sonicated before used.
The mass spectrometric detector parameters were optimized and set as follow: argon desolvation as 350°C with a flow rate of 500 l/hour and capillary voltage of 3.5 V. During analyses, ESI parameters were performed in positive ion mode and set as follow: parent m/z and cone voltage are 369 and 34 V for curcumin analysis and 260 and 42 V for IS analyses; daughter m/z and collision energy are 177 and 22 V for curcumin analyses and 183 and 17 V for IS analyses.
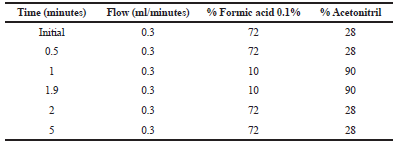 | Table 1. Phase mobile gradient. [Click here to view] |
Preparation of standard and internal standard solutions
Stock solution of curcumin and IS was prepared in acetonitrile in a concentration of 200 μg/ml separately. Stock solution of curcumin was diluted in acetonitrile to obtain a working solution at 10 μg/ml. From this working solution, the standard solution in specific concentration (10, 25, 50, 100, 250, and 500 ng/ml) was prepared by spiking 10, 25, 50, 100, 250, and 500 μl of working solution in 10 ml volumetric flask and adding 9,990, 9,975, 9,950, 9,900, 9,750, and 9,500 μl of acetonitrile to the flask. The calibration curve standard solution of curcumin in blank plasma was prepared by spiking 20 μl standard solution and 20 μl IS to 180 μl plasma, giving final concentrations of 1, 2.5, 5, 10, 25, and 50 ng/ml. In each validation and assay, a standard curve was made freshly from the working solution. The calibration curve sample was analyzed along with the quality control (QC) sample. Four different concentration levels were prepared for QC sample, which consist of lower limited of quantification (LLOQ) at 1 ng/ml, low QC at 3 ng/ml, medium QC at 20 ng/ml, and high QC at 40 ng/ml. IS concentration was prepared in the constant concentration (400 ng/ml) by diluting IS stock solution in distilled water. The calibration curve standard solution of curcumin in blank ovary homogenate was prepared by spiking 20 μl standard solution and 20 μl IS to 180 μl blank ovary homogenate, giving final concentrations of 1, 2.5, 5, 10, 20, and 30 ng/ml. Then, QC sample was also prepared at 1 ng/ml as LLOQ, 3 ng/ml as low QC, 15 ng/ml as medium QC, and 20 ng/ml as high QC.
Plasma blank preparation
Plasma blank (without analyte) was collected from female Sprague Dawley rat. Plasma was obtained by centrifuging blood at 3,000 rpm for 10 minutes at 4°C and stored at −80°C.
Ovary homogenate blank preparation
Ovary homogenate blank (without analyte) was collected from female Sprague Dawley rat. One hundred milligram ovary was homogenized in 1 ml saline by Ultraturax® homogenizer, then centrifuged at 12,000 rpm for 5 minutes at 20°C and stored at −80°C.
Sample processing
Two hundred microliter plasma or ovary homogenate contained a specific concentration of curcumin was added to 20 μl IS solution and 2 ml MTBE as an extracting solution. The sample was vortexed for 1 minute and centrifuged at 3,000 rpm for 10 minutes. The organic layer was transferred into a 10 ml glass tube and evaporated using nitrogen gas at 60°C for 2 minutes. The residue was diluted in 100 μl mobile phase, then centrifuged at 12,000 rpm for 5 minutes at 20°C. Transfer supernatant to vial for UPLC-MS/MS analyzing.
Validation method procedure
Validation method was carried out based on EMA Guideline on bioanalytical method validation (EMA, 2012). The parameters of rat plasma determined were curve calibration/linearity, precision, accuracy, dilution integrity, selectivity, matrix effect, and stability. However, we only performed partial validation on within run accuracy and precision for ovary homogenate.
Calibration curve/linearity
Calibration curve (y = ax + b) was attained by plotting the peak area ratio of curcumin to IS (y) versus curcumin concentration (x) using linearly weighted regression 1/x2. Standard solution of curcumin for calibration curve is 1, 2.5, 5, 10, 25, and 50 ng/ml for rat plasma and 1, 2.5, 5, 10, 20, and 30 ng/ml for rat ovary homogenate, in addition to the blank sample (processed matrix sample without analyte and without IS) and a zero sample (processed matrix with IS). The nominal value should be within 15% for QC sample and 20% for LLOQ when the calibration standards were calculated based on the linear regression equation (EMA, 2012). Five of six calibration standard levels must fulfill these criteria.
Accuracy and precision
Accuracy and precision were performed using five replicate samples of four curcumin concentrations that are LLOQ, low QC (three times of LLOQ), medium QC, and high QC running in the same and different day for analyzing within-run and between-run accuracy and precision. Evaluation of those parameters based on the mean concentration and the coefficient variation (CV) value for accuracy and precision, respectively. The nominal values and CV should be within 15% for the QC samples and less than 20% for the LLOQ (EMA, 2012).
Dilution integrity
Sample dilution was prepared by adding the blank plasma to sample [the concentration use higher than upper limited of quantification (ULOQ)]. The curcumin samples concentrations were 80 and 120 ng/ml spiking to blank plasma. This parameter was performed using five replicates of samples and evaluated in the accuracy and precision of the sample. The mean value and CV of samples should be within ±15% (EMA, 2012).
Selectivity
Selectivity method was evaluated by using at least six individual sources of the appropriate blank matrix compared to blank plasma which spiked the lowest concentration of curcumin (LLOQ) for interference analyzing. If there is an interference component on blank plasma, the responses should be below 20% for LLOQ and 5% for IS (EMA, 2012).
Matrix effect
Blank plasma from six lots was extracted and then spiked with curcumin at low and high QC and one level concentration IS called analyte and IS in the presence of matrix, to evaluate matrix effect of the analyte. The matrix factor (MF) of analyte was analyzed by comparing the peak area analyte in the presence of matrix to the peak area of analyte in the absence of matrix (analyte in pure solution without plasma), and also MF of IS was calculated in the same formula. The matrix effect was evaluated using CV of IS-normalized MF, where the IS-normalized MF could be obtained by comparing MF of the analyte to MF of the IS. The CV of the IS-normalized MF at low and high QC calculated from the six lots of matrix should be less than 15% (EMA, 2012).
Carry over
Carry-over was evaluated by analyzing a blank sample that injected after high concentration sample (50 ng/ml). Carry-over in the blank sample following the high concentration standard should not be greater than 20% of the LLOQ and 5% for the IS (EMA, 2012)
Stability
Stability test was conducted to evaluate the analyte stability in plasma sample under long-term (22 days) and freeze-thaw condition (two cycles). The test was performed using three replicates of low QC (3 ng/ml) and high QC (40 ng/ml) sample that are analyzed immediately after preparation and after the applied storage conditions for evaluation. Sample was considered to be stable if the mean value and CV at each level should be within ±15% for accuracy and precision (EMA, 2012).
Stability conditions that were performed are
- • Long-term stability: analyte was stored in the freezer for 22 days.
- • Freeze and Thaw stability: analyte sample was stored in the freezer for at least 12 hours, then thawed in room temperature. After that, the sample was stored again in the freezer for 12 hours and thawed again for analyzing.
DISCUSSION AND RESULT
Optimization of mass condition
In order to optimize ESI condition for curcumin and propranolol as IS, the MS parameters were tuned in both the positive and negative ionization mode. The best response was found in the positive ionization for both of them. By directly injecting a standard solution of curcumin and IS, the mass spectra for curcumin and IS were obtained during quantitative method development that displayed a precursor ions of [M + H]+ at m/z 369.25 (Fig. 1a) and 260.06 (Fig. 2a), respectively. The optimal values of collision energies were 22 and 17 eV for product ion at m/z 177.08 for curcumin (Fig. 1b) and 183.165 (Fig. 2b) for IS due to their high intensity and stability and no significant solvent adduct ions and fragments ions were observed. The same fragmentation of curcumin was reported by Antony et al. (2016).
Optimization of chromatographic condition
Chromatographic condition was optimized in several trials with the variation of the composition of mobile phase and flow rate. The composition of mobile phase plays a critical role in achieving a good separation between the analyte and IS due to polarity (Bélanger et al., 1997), and appropriate ionization, as well as short run time. The optimized mobile phase composition produced stable and acceptable peak shapes for curcumin and IS with 72:28 mixtures of 0.1% formic acid and acetonitrile as gradient elution (Table 1). The retention times of curcumin and IS were 2.5 and 1.6 minutes, respectively (Fig. 3). The total chromatographic run time was 5.0 minute.
 | Figure 1. Mass scanning of curcumin parent ion (a) and its daughter ion (b). [Click here to view] |
Optimization of sample processing
The sample was performed using a liquid-liquid extraction technique. This is a simple technique that can separate the analyte and IS from other component in biological matrixes in order to minimize interference that will disturb analyzing. The analyte, that was hydrophobic, will be dissolved due to its polarity in an organic solvent (Prabu and Timmakondu, 2012). Optimization of the extraction was carried out using different types of organic solvents, and MTBE was found the optimal solvent based on the highest area and the best shape of the peak of the analyte and IS.
Method validation
Calibration curve and linearity
The six points of calibration curves were linear of the concentration range 1–50 ng/ml for rat plasma and 1–30 ng/ml for rat ovary homogenate. The linear regression with intercept and weighted factor (1/x2) was selected to get the best fit relationship between concentration and ratio of the analytes in rat plasma and ovary homogenate in this study. The mean correlation coefficient (r) of the calibration curve generated in rat plasma and ovary homogenates was ≥0.99. Both of the curves have the same LLOQ, 1 ng/ml.
 | Figure 2. Mass scanning of IS parent ion (a) and its daughter ion (b). [Click here to view] |
Accuracy and precision
The within and between run accuracies and precisions in rat plasma and ovary homogenate were shown in Tables 2 and 3. The mean value concentration of within run accuracy and between run-in rat plasma and ovary homogenate was all within 100% ± 15% for QC sample and 100% ± 20% for LLOQ sample. The mean values of them were 98.9%–103.2% in rat plasma and 95.53%–109.78% in ovary homogenate for within accuracy and 98%–108.9% for between-run accuracy in rat plasma. The all CV of within and between run precision in rat plasma and ovary homogenate were not exceed more than 15% for QC sample and 20% for LLOQ sample. The CV of them are 8.81%–11.92% in rat plasma and 3.34%–9.14% in ovary homogenate for within precision, and 9.01%–10.47% for between precision in rat plasma. The result revealed high accuracy and precision due to EMA criteria (EMA, 2012).
 | Figure 3. Representative chromatogram UPLC-MS/MS of curcumin and IS in rat plasma. [Click here to view] |
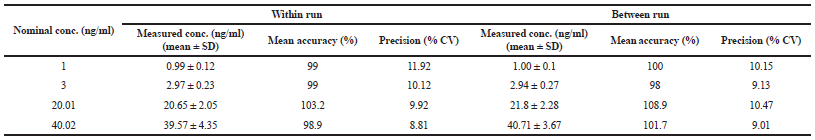 | Table 2. Within and between run accuracy and precision in rat plasma. [Click here to view] |
 | Table 3. Within-run accuracy and precision in rat ovary homogenate. [Click here to view] |
Dilution integrity
The samples analyte, whose levels were 80 and 120 ng/ml, could be diluted with blank rat plasma to make a final concentration of 40 ng/ml. The CV and the mean back-calculated dilution samples are less than 6% and within 15% of the nominal value, respectively. The result was it fulfills the requirement.
The accuracy and precision of dilution samples were shown in Table 4. The data showed that the sample of analyte could be diluted twice until three times dilution and the concentration after dilution has met the accuracy and precision criteria (EMA, 2012).
Selectivity
No interference peak was detected for curcumin and IS from six different sources of rat plasma. The percentage area between blank and LLOQ was below 14.69% and 0.69% for the analyte and IS, respectively. The method was found to be specific and no endogenous plasma component detected.
Matrix effect
Effect of biological matrix on ion suppression/enhancement was evaluated at two concentration levels (low QC and high QC) for curcumin and a single concentration for the IS. There was no difference between area response of analyte and IS both of in the presence and absence of matrix that showed as IS-normalized MF value. The CV of IS-normalized MF of curcumin was 14.9% and 9.39% at the low QC and high QC, respectively. It showed that no significant matrix effect in ion suppression/enhancement was observed in all sample rat plasma at low and high QC.
Carry over
The measured peak area of the blank plasma sample injected after ULOQ (50 ng/ml) was 14.59% of the peak area of the analyte at LLOQ and 0.38 % of the peak area of the IS then the area was within the requirements (EMA, 2012). It showed that high concentration didn’t interfere with low concentration if they are injected respectively.
Stability
The long-term and freeze-thaw stability data were shown in Tables 5 and 6. They showed that the analyte was stable until 22 days and two cycle freeze-thawed due to their accuracy and precision in each condition (EMA, 2012).
 | Table 4. Accuracy and precision of dilution integrity in rat plasma. [Click here to view] |
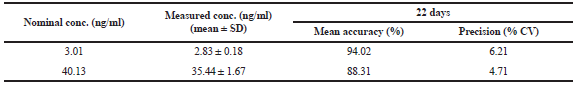 | Table 5. Accuracy and precision of long-term stability in rat plasma. [Click here to view] |
 | Table 6. Accuracy and precision of two freeze-thaw cycle stability in rat plasma. [Click here to view] |
CONCLUSION
In conclusion, the UPLC-MS/MS method with ESI positive mode for quantitative analysis of curcumin in rat plasma and ovary homogenate was successfully developed and validated. The method provides very rapid, sensitive, and specific measurement of curcumin concentration.
REFERENCES
Antony B, Benny M, Sheeja EC, Reshma M. Development of a validated UPLC-TQD-MS method for bioavailability study of curcuminoids and the metabolite in rat plasma. Human J, 2016; 7(2):1–17.
Bélanger, Jacqueline MJMR, Paré JRJ, Sigouin M. High performance liquid chromatography (HPLC): principles and applications. Instrument Methods Food Anal, 1997; 38–58.
Choudhuri T, Pal S, Das T, Sa G. Curcumin selectively induces apoptosis in deregulated cyclin D1-expressed cells at G2 phase of cell cycle in a p53-dependent manner. J Biol Chem, 2005; 280(20):20059–68.
European Medicine Agency (EMA). Guideline on bioanalytical method validation. 2012; 1–23.
Goel A, Kunnumakkara AB, Aggarwal BB. Curcumin as “Curcumin”: from kitchen to clinic. Biochem Pharmacol, 2008; 75:787–809.
Heath DD, Pruitt MA, Brenner DE, Rock CL. Curcumin in plasma and urine: quantitation by high-performance liquid chromatography. J Chromatogr B, 2003; 783:287–95.
Kurita T, Makino Y. Novel curcumin oral delivery systems. Anticancer Res, 2013; 33(7):2807–22.
Lin YG, Kunnumakkara AB, Nair A, Merritt WM, Han LY, Armaiz-Pena GN, Kamat AA, Spannuth WA, Gershenson DM, Lutgendorf SK, Aggarwal BB, Sood AK. Curcumin inhibits tumor growth and angiogenesis in ovarian carcinoma by targeting the nuclear factor-κB pathway. Clin Cancer Res, 2007; 13(11):3423–30.
Maheshwari RK, Singh AK, Gaddipati J, Srimal RC. Multiple biological activities of curcumin: a short review. Life Sci, 2006; 78(18):2081–7.
National Centre for Biotechnology Information (NCBI). USA. Available via https://pubchem.ncbi.nlm.nih.gov/compound/curcumin (Accessed 3 July 2017).
Prabu SL, Timmakondu S. Extraction of drug from the biological matrix: a review. In: Naik GR (ed.). Applied biological engineering-principle and practice. InTech, pp 479–507, 2012. Available via https://www.intechopen.com/books/applied-biological-engineering-priciples-and-practice/extraction-of-the-drug-fom-the-biological-matrix.
Schiborr C, Eckert GP, Rimbach G, Frank J. A validated method for the quantification of curcumin in plasma and brain tissue by fast narrow-bore high-performance liquid chromatography with fluorescence detection. Anal Bioanal Chem, 2010; 397:1917–25.
Shishodia S. Review article molecular mechanisms of curcumin action: gene expression. Biofactors, 2012; 37–55.
Shoba G, Joy D, Joseph T, Majeed M, Rajendran R, Srinivas PS. Influence of piperine on the pharmacokinetics of curcumin in animals and human volunteers. Planta Med, 1998; 64(4):353–6.
Song Z, Feng R, Sun M, Guo C, Gao Y, Li L, Zhai G. Curcumin-loaded PLGA-PEG-PLGA triblock copolymeric micelles: preparation, pharmacokinetics and distribution in vivo. J Colloid Interface Sci, 2011; 354:116–23.