INTRODUCTION
Tepotinib is chemically designated as 3-{1-[(3- {5- [(1-methyl piperidin-4-yl) methoxy] pyrimidin 2-yl} phenyl)methyl] -6-oxo-1, 6-dihydropyridazin3-yl} benzonitrile with formula and weight of C29H28N6O2 and 492.583 g·mol−1 (Fig. 1). Tepotinib is approved for use in patients detected with metastatic non small cell lungs cancers (NSCLC) and have definite genetic alterations known as mesenchymal epithelial transitions (MET) factors exon14 skipping [1–3]. Tepotinib is a medication planned to inhibit and target the activities of MET tyrosine kinases, commonly found in certain types of solid tumors that have an overexpression of MET. The development of this treatment began in 2009 through a collaboration between the University of Texas M.D. Anderson Cancer Center and EMD Serono [4]. Since then, researchers have studied its potential in treating various types of cancer, including neuroblastoma, NSCLC, gastric cancers, and hepatocellular carcinomas. As a result, targeting MET has become a desirable approach in their treatment.
 | Figure 1. A) Tepotinib and B) Axitinib chemical structures. [Click here to view] |
Tepotinib was granted its initial approval for use in Japan for the management of NSCLC with MET alterations in 2020 March [5]. This oral medication is the first of its kind to specifically target MET tyrosine kinase and can be taken once a day. This feature is beneficial as it helps reduce the number of pills that patients need to take, which can be a burden when undergoing chemotherapy. Europe approved the use of Tepotinib in February 2022 [4–6]. In the present study, Axitinib was utilized as an internal standard (IS), with similar chromatographic behavior as that of analyte, for the estimation of Tepotinib in biological samples [7]. It is chemically designated as N-Methyl-2-[[3-[(E)-2-pyridin-2-ylethenyl]-1H- indazol-6-yl] sulfanyl] benzamide with formula and weight of C22H18N4OS and 386.47 g·mol−1 (Fig. 1) [8].
There is only one analytical approach that has been reported for quantifying Tepotinib using LC-MSMS, according to the available literature. There are alternative techniques mentioned in the literature, such as HPLC [9,10], UV [11], and LC-MS/MS [12]. The reported method is applied to study in human liver microsomes and there were no studies revealed about plasma samples. In the present scenario, there is a requirement for bioanalytical methods for bioequivalence and bioavailability studies. Therefore, there is a need to develop a bioanalytical method for the quantification of Tepotinib levels in plasma samples.
MATERIAL AND METHODS
Reagent chemicals
Tepotinib and Axitinib were provided by Dr. Reddy’s, Hyderabad, India. We purchased chromatographic grade methyl alcohol, acetonitrile, and HCOOH (formic acid) of analytical grade attained from JT Bakers, Hyderabad, India. The mobile and cleaning solvents were prepared with water obtained from the Milli-Q®RO system. Human K2EDTA plasma was attained from Vivekananda blood bank, HYD, India.
Liquid chromatography tandem mass spectrometry(LC-MS/MS)
An LCMS/MS system was used for chromatography, with a Water 2695 Alliance separation module for sample introduction and solvent delivery. The system also included a Micromass Quattro micro API bench-top triple quadruple mass spectrometer connected to an ESI Z-spray source as a detector. At room temperature, an analysis was conducted using a reversed-phase ZorbaxC18 stationary phase (2.1 × 100mm, 3 µm) and mobile phase composition of 0.1%HCOOH and acetonitrile(15:85). Movable phase flow was monitored at 0.4 ml/minute. The Version 4.0Mass Lynx software was utilized on an MS Windows XP Professional operating system to manage the device, retrieve the data, calculate the signal-to-noise (S/N) ratio, and process the peaks through integration and smoothing.
LC and mass system conditions
Chromatography was established with ZorbaxC18 stationary phase (2.1 × 100 mm, 3 µm) and a mobile phase of 0.1% HCOOH and can (15:85% V/V), sent at a flow rate of 0.4 ml/minute. The ESI (electrospray ionization) interfaces were operated in positive ionization mode. Mass spectrometric parameters were as follows: 450°C: temperature of desolvation, 150°C: temperature of source, 4kV: capillary voltage. N2 was utilized as both cone gas and desolvation gas at 40 l/hour and 750 l/hour flow rates, respectively. Argon was utilized as the collisional gas at 0.17 ml/minute flow rate in the collisional cell. Collisional energy and voltage of the cone for Tepotinib and Axitinib were optimized as 18V/20V and 20V/28V, respectively. The quantitation of drug and IS was executed using positive ionization with ESI at the mass transitions of (m/z): for Tepotinib were m/z 493.23 → 296.17 and for Axitinib was 387.12 → 220.08.
Processing of standard and quality controls
Tepotinib and Axitinib stock solutions (1,000 µg/ml) were processed in a mobile solvent individually. The substances were further solubilized using plasma to produce a 10 µg/ml concentration. A set of 8 calibration standards was processed using human plasma (after the sample preparation), covering within the concentrations range of 1.5–1,200 ng/ml. Additionally, 4 quality control (QC) sample solutions were also processed, with concentrations of 1.5, 4.5, 600, and 900 ng/ml [13] LLOQ, LQCs, MQCs, and HQCs, respectively. The linearity controls and QCs were thoroughly mixed for 1 minute, and then precise 1.0 ml portions were carefully relocated into borosilicate Teflon-lined (13 × 100 mm) glass tubing. These samples were then stored at −20?C till they were desired.
Sample extraction
Ensure that the 1 ml sample of QC, linearity curve, and plasma blank samples are brought to room temperature. The final concentrations of each and every tubing were 150 ng/ml of IS. To achieve this, 250 µl of the IS solution was added to each tube and vortex for 20 seconds. They received a dosage of 5 ml of acetonitrile for treatment. The resultant solutions were then centrifuged at an RPM of 15,000 for a duration of 25 minutes [14]. The organic phase was isolated and dried using a N2 gas stream in a heated block at 45°C. The remaining solution was mixed with 100 µl of a mobile solvent system, transferred to an auto-sampler container, and 10 µl was then infused into an LC-MSMS instrument.
Stability study
By storing the processed QC solutions in an autosampler maintained at 5 °C ± 3°C temperature for the duration of 2 days, 20 hour, and 27 minutes, their stability in the auto sampler could be evaluated. After undergoing rigorous 2-month storage at −20°C, long-term stability at the low-quality control (LQC) (4.5 ng/ml) and high-quality control (HQC) (900 ng/ml) levels. The stock solution stability for the analytes was tested at the LQC (4.5 ng/ml) and HQC (900 ng/ml) levels by keeping it at a temperature of 2–8°C for 10 days. Three freeze/thaw cycle stability solutions were executed at room temperature and −20°C. The analytes underwent short-term stability testing by being stored at room temperature for 8 hours. The stability of the QC spiked samples was tested by keeping them at room temperature for a duration of 17 hours and 28 minutes. The stability of the dry extract in spiked QC solutions was assessed over a time of 2 days by preserving them at −28°C ± 5°C [15].
Validation
Developed method subjected for the validation as per the recommended guidelines of USFDA. Validation criteria included factors such as specificity, accuracy, linearity, precision, stability, and recovery [13–20].
RESULTS AND DISCUSSION
Optimization LC and mass parameters
Parent and product ionic components of Tepotinib and Axitinib were analyzed by injecting a standard 1.0 µg/ml solution in acetonitrile into the mass instrument. The analytes were measured using positive ionization with ESI in the MRM approach. The resulting transitions were: Tepotinib, 493.23/296.17.09 and Axitinib, 387.12/220.08. The following mass limitations were employed: The desolvation temperature is 450°C, the source temperature is 150°C, and the capillary voltage is 4kV. A cone and desolvation gas consisting of N2 was used at flow rates of 40 l h−1 and 750 l h−1, correspondingly. An argon gas mixture was subjected to collisional processing at a flow rate of 0.17 ml/minute in a collision cell. The collisional energy and voltages for Tepotinib and Axitinib cones were tuned at 18V/20V and 20V/28V, respectively.
Specificity
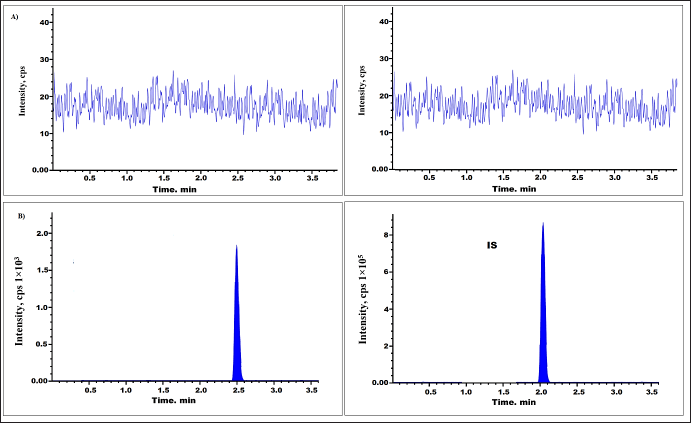
To assess the specificity six batches of plasma blank and IS were examined. The chromatogram seen in Figure 2A exemplifies a standard chromatogram of plasma blank, utilized in the generation of QC and standard samples. Figure 2B displays a plasma sample spiked with drug and Axitinib [16–19].
 | Figure 2. Chromatogram of Tepotinib (A) plasma blank and (B) LLOQ levels. [Click here to view] |
Calibration curve
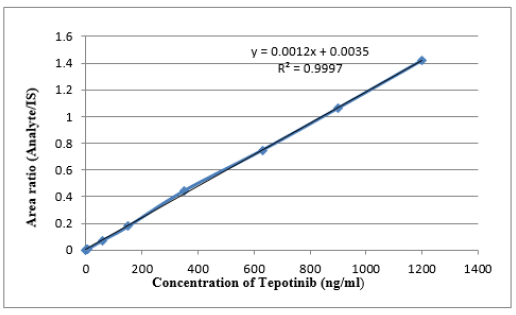
The test’s linear plot was established by estimating a set of standard blends including Tepotinib and IS in human plasma. The blends were tested at eight different concentration levels, ranging from 1.5 to 1,200 ng/ml. Regression assessment was conducted on peak height ratios associated with the IS and the concentrations [18–21]. The equations for Tepotinib were determined to be y = 0.0012x + 0.0035, with an R2 value of 0.9997 (n = 6). The suitability of the linearity plots for application was established by performing back calculations to ascertain the concentrations of Tepotinib in plasma samples, using the linearity graph provided in Table 1. All calculated concentrations were far lower than the maximum allowable limit of ICH and FDA validation guidelines [17,18]. Figure 3 depicts the average linearity graph of Tepotinib. LLOQQC for Tepotinib was estimated to be 1.5 ng/ml, with a S/N ratio greater than 10. Because, if the noise is more, the response of the drug and IS will be merged in the noise and cannot be identified. This level of sensitivity is enough for precise measurement of Tepotinib in plasma samples.
 | Table 1. Tepotinib calibration standards data. [Click here to view] |
 | Figure 3. Linearity of Tepotinib. [Click here to view] |
Precision and accuracy
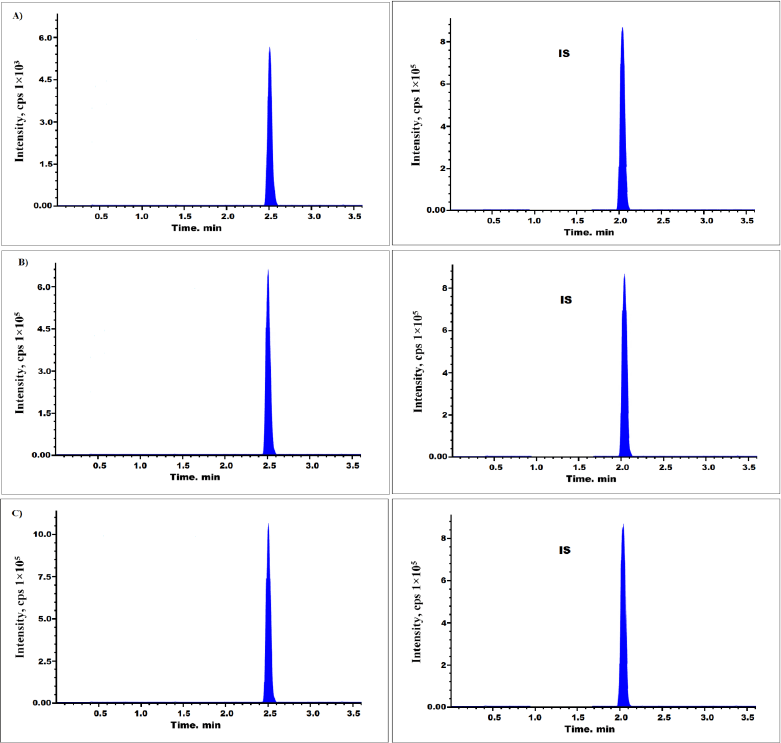
Precision and accuracy were estimated for 4 QC levels (1.5, 4.5, 600, and 900 ng/ml). Intra (n = 10) and inter (n = 20, 3 days) day precisions were ≤4.92% and ≤ 04.76% for Tepotinib (Fig. 4 and Table 2). Intra and Interday bias was −0.33%–2.56% and −1.97%–2.67%, respectively [20–22]
 | Figure 4. Chromatogram of Tepotinib at A) low-QC level, B) median-QC level, and C) high-QC levels. [Click here to view] |
 | Table 2. Tepotinib accuracy and precision for inter and intra batches. [Click here to view] |
Recovery
The extraction recoveries of Tepotinib at 3 different concentration levels (4.5, 600, and 900 ng/ml) and the Axitinib at 150 ng/ml were estimated by paralleling the peak areas of spiked samples before and after the extracting procedure. This assessment was conducted using six sets of spiked solutions [19]. The extraction recoveries of Tepotinib were found to be 98.32% on average (Table 3 and Fig. 4).
 | Table 3. Recoveries of analytes after the extraction. [Click here to view] |
Matrix effect
The effect of matrix quantification was conducted by equating the peak intensities of Tepotinib in the presence and absence of the elements of the matrix such as lipids, proteins, electrolytes, and metabolites. The six sample solutions were infused to test at both low and higher QC standards. %CV findings for LQC and HQC levels were 3.37 and 3.32, respectively (Table 4).
 | Table 4. Tepotinib findings for matrix factor. [Click here to view] |
Stability
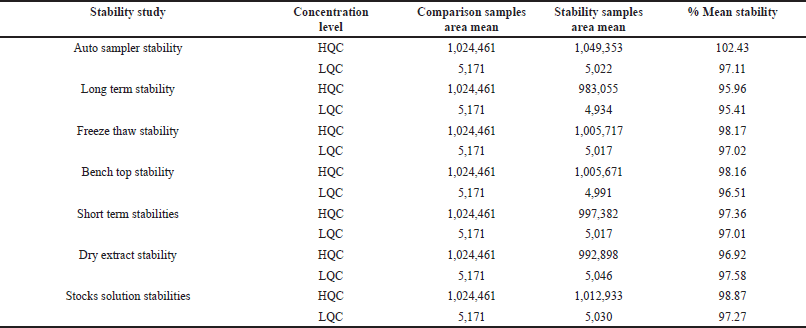
In this study, both the stability of Tepotinib and Axitinib in processed and unprocessed plasma solutions was investigated at both low and high-quality controls. Table 5 provides a summary of the conclusions from the studies into the stability.
 | Table 5. Stability data of Tepotinib. [Click here to view] |
CONCLUSION
A precise, targeted, and accurate LC-MS/MS technique was established to measure the levels of Tepotinib in plasma. Axitinib and Tepotinib were separated from the plasma sample solution using a protein precipitation method. A chromatographic isolation was carried out using a ZorbaxC18 stationary phase (2.1 × 100 mm, 3 µm) and mobile phase composition of 0.1% formic acid and acetonitrile (15:85). The analytes were quantified using positive ionization mode with ESI. Mass transitions for Tepotinib were 493.23/296.17.09, and for Axitinib (IS) they were 387.12/220.08. No interference from any components of blank plasma or other substances was identified. The relationship between Tepotinib concentrations and their corresponding area of the peak ratios to Axitinib showed a linear pattern across a range of 1.5–1,200 ng/ml. The precision of Tepotinib was excellent, with an intra-day precision of ≤4.92% (n = 10) and an inter-day precision of ≤04.76% (n = 20, over 3 days). The measured average extraction recoveries of Tepotinib were 98.32%.
AUTHOR CONTRIBUTIONS
All authors made substantial contributions to conception and design, acquisition of data, or analysis and interpretation of data; took part in drafting the article or revising it critically for important intellectual content; agreed to submit to the current journal; gave final approval of the version to be published; and agree to be accountable for all aspects of the work. All the authors are eligible to be an author as per the International Committee of Medical Journal Editors (ICMJE) requirements/guidelines.
FUNDING
There is no funding to report.
CONFLICTS OF INTEREST
The authors report no financial or any other conflicts of interest in this work.
ETHICAL APPROVALS
The study protocol was approved by the Institutional Ethics Committee (Approval No.: HECA-280/A, Date: 23rd Dec 2024).
DATA AVAILABILITY
All the data is available with the authors and shall be provided upon request.
PUBLISHER’S NOTE
All claims expressed in this article are solely those of the authors and do not necessarily represent those of the publisher, the editors and the reviewers. This journal remains neutral with regard to jurisdictional claims in published institutional affiliation.
USE OF ARTIFICIAL INTELLIGENCE (AI)-ASSISTED TECHNOLOGY
The authors declares that they have not used artificial intelligence (AI)-tools for writing and editing of the manuscript, and no images were manipulated using AI.
REFERENCES
1. Mathieu LN, Larkins E, Akinboro O, Roy P, Amatya AK, Fiero MH. FDA Approval summary: capmatinib and tepotinib for the treatment of metastatic NSCLC harboring MET exon 14 skipping mutations or alterations. Clin Cancer Res. 2022;8(2):249–54. CrossRef
2. Morise M, Sakai H, Veillon R, Le X, Felip E, Garassino MC, et al. O13-4 Tepotinib safety in MET exon 14 (METex14) skipping NSCLC: updated results from the VISION trial. Ann Oncol. 2021;32:S291. CrossRef
3. Abdelhameed AS, Attwa MW, Kadi AA. Identification of iminium intermediates generation in the metabolism of Tepotinib using LC-MS/MS: in silico and practical approaches to bioactivation pathway elucidation. Molecules. 2020;25(21):25215004. CrossRef
4. FDA Approves Tepmetko as the First and Only Once-daily Oral MET Inhibitor for Patients with Metastatic NSCLC with METex14 Skipping Alterations. EMD Serono (Press release). 3 February 2021.
5. https://www.accessdata.fda.gov/drugsatfda_docs/label/2021/214096s000lbl.pdf
6. Wu ZX, Teng QX, Cai CY, Wang JQ, Lei ZN, Yang Y, et al. Tepotinib reverses ABCB1-mediated multidrug resistance in cancer cells. Biochem Pharmacol. 2019;166:120–7. CrossRef
7. Sunetha A, Sharmila D. HPLC method development and validation for the estimation of axitinibe in rabbit plasma. Brazil J Pharm Sci. 2017;53:00012. CrossRef
8. Rini B, Rixe O, Bukowski R, Michaelson MD, Wilding G, Hudes G, et al. Amulti-target tyrosine kinase receptor inhibitor, demonstrates anti-tumor activity in a Phase 2 study of cytokine-refractory, metastatic renal cell cancer (RCC). J Clin Oncol ASCO Ann Meeting Proc. 2005;23(16S):4509. CrossRef
9. Smita T Kumbhar, Pratima S Kokare, Pradip B Digge. Development of novel RP-HPLC method for estimating Tepotinib in bulk and pharmaceutical dosage form. Int J Pharm Qual. 2023;14(4):1188–93. CrossRef
10. Nikhil J, Parthiban C, Sudhakar M, Vijaya Sri K. Method development and validation for the estimation of Tepotinib in pharmaceutical dosage forms by RP-HPLC. Int J Pharm Pharm Res. 2022;26(1):468–77.
11. Shirwar M, Birajdar S, Garad S, Kumbhar S. Development and validation of novel UV-visible spectrophotometric method for estimation of tepotinib in bulk and in pharmaceutical formulation. Int J Pharm Pharm Sci. 2023;15(9):32–6. CrossRef
12. Attwa MW, Mostafa GAE, AlRabiah H, Kadi AA. An LC–MS/MS analytical method for quantifying Tepotinib in human liver microsomes: application to in vitro and in silico metabolic stability estimation. Separations 2023;10:330. CrossRef
13. Saraner N, Karagoz A, Guney B, Saglam O. Determination of dasatinib in human plasma by using liquid chromatography-tandem mass spectrometry. Int J Anal Bioanal Meth. 2019;1:2. CrossRef
14. Guodong He, Liping Mai, Xipei Wang. Development and validation of an HPLC-MS/MS method for rapid simultaneous determination of cefprozil diastereomers in human plasma. Hindawi Int J Ana Chem. 2018;6959761:1–9. CrossRef
15. Bhatt D, Rajkamal B. A UPLC-MS/MS method development and validation for the estimation of sofosbuvir from human plasma. Int J Appl Pharm. 2017;9(1):30–6. CrossRef
16. Zhou C, Tian J, Lin P, Liu T, He A, Fang L, et al. Quantitation of fostemsavir, a mesenchymal-epithelial transition factor inhibitor by UPLC-MS/MS in rat plasma and its application to a pharmacokinetic study. Bioanalysis. 2020;12(5):285–93. CrossRef
17. ICH guidelines for bioanalytical method validation and study sample analysis. Geneva, Switzerland: M10 ICH; 2022. p 1–59.
18. US FDA. Guidance for Industry Bioanalytical Method Validation, Food and Drug Administration, Center for Drug Evaluation and Research (CDER). Rockville, MD: US FDA; 2001.
19. Glaenzel U, Jin Y, Hansen R, Schroer K, Rahmanzadeh G, Pfaar U, et al. Absorption, distribution, metabolism, and excretion of fostemsavir (INC280) in healthy male volunteers and in vitro aldehyde oxidase phenotyping of the major metabolite. D Met Disp. 2020;48(10):873–85. CrossRef
20. Ravi Y, Bhikshapathi D, Shankar C, Rajkamal B. Development of fast and simple LC-ESI-MS/MS technique for the quantification of regorafenib; application to pharmacokinetics in healthy rabbits. Curr Pharm Anal. 2021;17(4):554–63. CrossRef
21. Shah JV, Shah PA, Shah PV, Sanyal M, Shrivastav PS. Fast and sensitive LC–MS/MS method for the simultaneous determination of lisinopril and hydrochlorothiazide in human plasma. J Pharm Anal. 2017;7:163–9. CrossRef
22. Lolla S, Gubbiyappa KS, Shankar CH, Bhikshapathi DVRN. Validation of an LC-MS/MS method for quantitation of fostemsavir in plasma. J Pharmacol Toxicol Methods. 2023;120:107254. CrossRef