INTRODUCTION
A decade ago, the Malaysian Agricultural Research and Development Institute as a statutory body in Malaysia had declared two new varieties of fragrant rice namely, MRQ74 and MRQ76. The rice variety of MRQ76 was declared in 2012 for its quality of being fragrant, soft, and slightly sticky [1]. While rice variety of MRQ74 had been declared in 2005 for its properties like Basmati rice [2]. However, the production of these fragrant rice varieties facing a decline because consumers have become accustomed to using imported fragrant rice as staple food.
The previous study proved that phytochemicals which are naturally occurring compounds found in crops could offer health benefits for humans recognized to its micronutrients [3]. The most highlighted phytochemicals found in grains are phenolic acids, flavonoids, anthocyanins, anthocyanidins, tocopherols, tocotrienols, and phytic acid [4]. Phenolics, as the richest phytochemicals in grains are natural antioxidants, which act as radical scavengers to reduce the incidence of oxidative stress-induced damage [5]. Then, flavonoids could also prevent the production of radicals by scavenging free radicals and/or chelating metal ions [6].
To be known, rice-derived polyphenols and their antioxidant properties in global rice cultivars have been broadly researched. However, there is not yet research on the chemical profiling and antioxidant potential of new fragrant rice varieties of MRQ74 and MRQ76. Acting a key role in the biological effects of rice, phenolics, and flavonoids had been recognized as a focus target for modulation of antioxidant activity from MRQ74 and MRQ76 varieties. Therefore, the study was conducted to investigate the phytochemicals profiling towards their phenolic content, flavonoid content, and antioxidant capacity. The present findings aim to expose the health benefits of these new varieties for consumer acceptance and gradually increase crop production in the industry.
MATERIALS AND METHODS
Chemicals and reagents
The list of chemicals and reagents in this study are listed in the following Table 1.
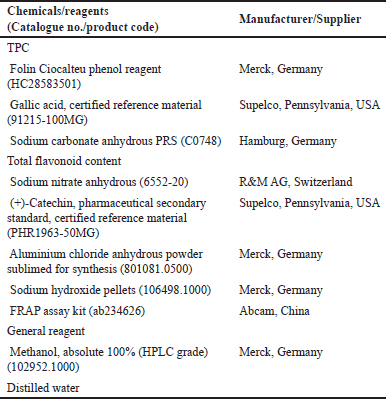 | Table 1. Chemicals and reagents used in this study. [Click here to view] |
Sample collection of MRQ74 and MRQ76 varieties
New fragrant rice varieties of MRQ74 and MRQ76 were obtained from the Paddy and Rice Research Center, Malaysian Agricultural Research and Development Institute (MARDI), Seberang Perai, Pulau Pinang. The authentication rice varieties letter had been provided from MARDI with reference number MDI/PR/PA/001/ for fresh polished and unpolished samples and 3-months aged polished and unpolished samples (Appendix 1). The rice grain samples were cautiously separated from any physical residue and put aside in a closed container.
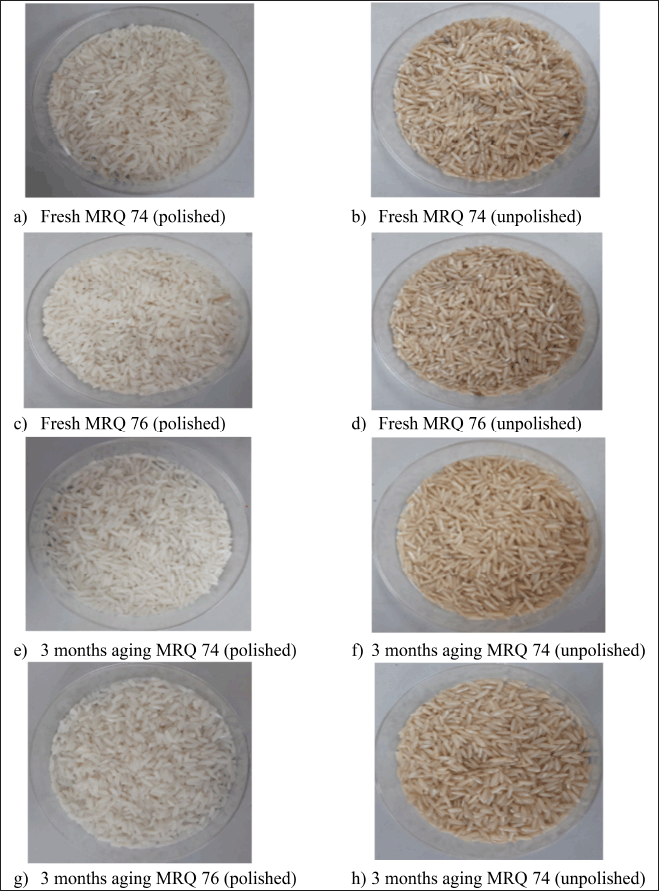 | Appendix 1. The fragrant rice variety of MRQ 74 and MRQ 76; (a) 74 FP (MRQ74 fresh polished), (b) 74 FUP (MRQ74 fresh unpolished), (c) 76 FP (MRQ76 fresh polished), (d) 76 FUP (MRQ76 fresh unpolished), (e) 74 3P (MRQ74 aged polished), (f) 74 3UP (MRQ74 aged unpolished), (g) 76 3P (MRQ76 aged polished), (h) 76 3UP (MRQ76 aged unpolished). [Click here to view] |
Extraction procedure of MRQ74 and MRQ76 varieties
The method introduced by Rohin et al. [7] was used in the extraction process with slight adjustments (Appendix 2). In this study, each of the rice grain varieties were grinded using an electric blender (Waring Commercial, Thermo Fisher Scientific, Massachusetts). Then, 50 g of each sample going through with soaking process (1:10; w/v) using an aqueous solution (deionized water) at 25°C for 24 hours. Afterward, each of the solvent extracts was filtered by using vacuum filtration (Favorit Filtration, Thermo Fisher Scientific, Massachusetts) with nylon filter paper (0.45 µm) and concentrated in a rotary evaporator (RE-1020, Biobase Group, Shandong, China) at 50°C. The concentrated extracts were then placed in the oven at 40°C to allow for complete solvent evaporation. Finally, all the crude extracts were kept in −20°C freezer until they were used for the next analysis.
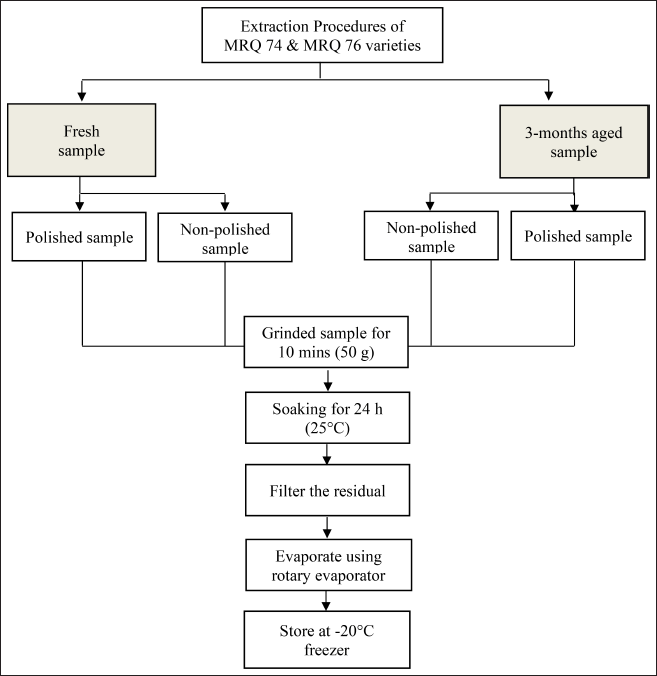 | Appendix 2. Flowchart of the extraction procedure of MRQ 74 and MRQ 76 new fragrant rice varieties. [Click here to view] |
Determination of total phenolic content (TPC)
TPC assay was determined using a Folin Ciocalteu’s reagent [8]. A stock solution of 1 mg/ml was prepared by dissolving 1 mg of sample with 1 ml of 100% methanol High performance liquid chromatography grade (HPLC grade). Six data points with concentrations of 0, 20, 40, 60, 80, and 100 µg/ml were used to analyze the calibration curve of gallic acid. Each of the 100 µl extract samples and gallic acid standard solutions were added to 0.4 ml distilled water and 0.5 ml Folin-Ciocalteu reagent and was left for 5 minutes. After that, 1 ml of 7.5% sodium carbonate (w/v) were added and was left in a dark place for another 2 hours. The absorbance was measured at 765 nm using a spectrophotometer (Genesys 20, Thermo Fisher Scientific, Massachusetts). This process was conducted in triplicates for each of the samples. The results were expressed as milligrams of gallic acid equivalents (GAEs) per 100 g of sample (mg GAE/100 g of sample).
Determination of total flavonoid content (TFC)
TFC assay was determined by the aluminum chloride colorimetric method [9] and modifications were done based on Pithonah et al. [10]. A stock solution of 1 mg/ml was prepared by dissolving 1 mg of sample with 1 ml of 100% methanol (HPLC grade). Six data points with concentrations of 0, 10, 20, 30, 40, and 50 µg/ml were used to analyze the calibration curve of catechin. Each of the 100 μl extract samples and catechin standard solutions was added to 500 μl of distilled water and 100 μl of 5% sodium nitrate and was left for 6 minutes. Next, 150 μl of 10 % aluminum chloride solution and 200 μl of 1M sodium hydroxide were added and were left for another 5 minutes. The absorbance was measured and recorded at 510 nm on a spectrophotometer (Genesys 20, Thermo Fisher Scientific, Massachusetts). This process was conducted in triplicates for each of the samples. The results were expressed as catechin equivalents (mg CE/100 g).
Antioxidant activity assay
The antioxidant activity of extract samples was determined using a ferric reducing antioxidant power (FRAP) colorimetric assay kit from Abcam (ab234626), China. Standard solutions of 2 mM were prepared with the range concentration of 0–20 µl (nmoles). A stock solution of 1 mg/ml was prepared by dissolving 1 mg of sample with 1 ml of 100% methanol (HPLC grade). Then, 10 μl of extract samples were added into a 96-well plate and mixed thoroughly with 190 μl of Reaction Mix solution. The samples then were incubated for 60 mintues at 37°C. The absorbance was measured and recorded at 594 nm on a spectrophotometer (Genesys 20, Thermo Fisher Scientific, Massachusetts).
Determination of bioactive compounds in MRQ74 and MRQ76 extracts using liquid chromatography mass spectrometry (LCMS)
Preparation of MRQ74 and MRQ76 extracts
A stock solution of 1 mg/ml was prepared by dissolving 1 mg of sample with 1 ml of 100% methanol HPLC grade. Then, each of the stock solutions was filtered through a 0.45 µm PTFE hydrophobic syringe filter into an LCMS vial prior used for profiling.
Chromatography and mass spectrometry of metabolite profiling
The method introduced by the Integrative Pharmacogenomics Institute, Universiti Teknologi Mara, Selangor Darul Ehsan was used in this study. The screening of bioactive compounds was performed using an Liquid chromatography/mass spectrometry- quadrupole time-of-flight (LC/MS-QTOF) system comprised of an Agilent 1200 liquid chromatography system (Agilent-1200, Agilent Technologies Inc, Santa-Clara), equipped with a binary pump, a vacuum degasser unit, an auto sampler and 6,520 quadrupole time of flight mass spectrometers with an electrospray ionization source. The column used was Agilent ZORBAX Eclipse Plus C18 Rapid Resolution HT (2.1 × 100 mm), 1.8 µM. The chromatographic separation was performed at 40°C with (A) 0.1% formic acid in distilled water and (B) 0.1% formic acid in acetonitrile for positive mode. The gradient elution program was 0.00–18.00 mintues, minutes, 5%–95% (A); 18–23 minutes; 95% (B); 23.01 minutes; 5% (C). The total run time is 30 minutes. The LC condition was re-equilibrated for 2 minutes before starting the new injection. The sample injection volume was set at 2 µl and the flow rate of the mobile phase was set at 0.25 ml/minute. The mass spectrometer was operated in positive electrospray ionization mode with optimum gas temperature at 325°C, gas now at 11 l/minute, and nebulizer at 35 psi, respectively.
Data analysis
The data reported was explored using descriptive and inferential statistical analysis. The analysis of variance compared the treatment and control groups adjusting for the baseline value as a covariate was performed. The IBM SPSS, version 20.0 software (IBM Corp. Armonk, NY) is used for statistical analysis. All tests are two-sided and p < 0.05 is considered statistically significant. While, LCMS analysis (MS data (.d)) used Agilent Mass Hunter Qualitative Analysis B.05.00 software (Agilent Technologies Inc, Santa Clara). The chromatographic profiles were analyzed based on the accurate mass data identified and the predicted compounds were annotated using metabolite and chemical entity database database.
RESULTS AND DISCUSSION
TPC and TFC
Table 2 shows the TPC and TFC results for the extraction of MRQ74 and MRQ76 with different samples. The calibration curve of gallic acid was plotted with y = 0.0089x + 0.0244 and R2 = 0.9889, while the calibration curve of catechin was plotted with y = 0.0014x + 0.0024 and R2 = 0.9968. Based on the findings, the 76 FUP sample gives the highest TPC with a value of 261.35 ± 0.01 mg GAE/100 g, followed by the 74 FUP sample with 162.47 ± 0.01 mg GAE/100 g, and 74 3UP sample with 142.25 ± 0.01 mg GAE/100 g. While the 74 FP sample had the lowest TPC with the value of 88.31 ± 0.03 mg GAE/100 g, among all extraction samples. Overall, the TPC values differed significantly (p < 0.05) among different samples of MRQ74 and MRQ76.
 | Table 2. TPC, total flavonoid content (TFC) and antioxidant FRAP assay of MRQ74 and MRQ76 variety extracts. [Click here to view] |
For TFC, it was observed that the 76 FP sample gives the highest TFC with the value of 1715.00 ± 0.01 mg CE/100 g, followed by 74 3UP sample with 1640.00 ± 0.01 mg CE/100 g, and 76 3UP sample with 1609.05 ± 0.01 mg CE/100 g. Yet, 74 FUP samples had the lowest TFC with the value of 1411.43 ± 0.05 mg CE/100 g, among all extraction samples. There is no significant difference of TFC values among different samples of MRQ74 and MRQ76 (p > 0.05).
According to the findings, polished rice grains had the lowest TPC due to the total removal of the rice bran which consequently leads to a higher carbohydrate content (Appendix 3), demonstrating this effect visibly. Tian et al. [11] found that brown rice had the highest concentration of total extractable phenolics, followed by white rice, which is consistent with the findings of this investigation. According to Goufo and Trindade [12], rice phenolics are composed of 12%–28% hydroxybenzoic acids and 61%–89% hydroxycinnamic acids. However, when compared to processed white rice, the quantity of phenolic esters such as hydroxycinnamate sucrose esters in germinated brown rice was reduced by 70% [11], resulting in a drop in total extractable phenolics content.
 | Appendix 3. The composition of MRQ74 and MRQ76 rice varieties (100 g) with different samples. [Click here to view] |
Previously, Melissa et al. [13] investigated the concentration of TPC and antioxidant activity of rice grains with light brown, red, and black pericarp colors. Results revealed significant differences in the concentrations of TPC and antioxidants among varieties with higher values obtained for grains with red and black colors, while light color with lowest values. Summpunn et al. [14] had assessed five different Thai non-glutinous varieties along with each sample; white rice, brown rice, germinated brown rice, and rice grass for antioxidant components. The results observed that TPC was found in all rice varieties, in the range of 16.4–31.4 mg GAE/100 g (dw), with the highest value in rice grass and germinated brown rice, indicating that milling to generate white rice had an adverse effect on those components.
In recent decades, researchers have focused on the phenolic and flavonoid content of plant-based materials due to their importance for human health and nutrition [15]. Phenolic chemicals, which include a wide spectrum of structurally varied molecules such as flavonoids, have been shown to have strong antioxidant and anti-inflammatory properties, making them promising research targets [16].
Antioxidant capacity (FRAP)
The result observed in Table 2 shows FRAP antioxidant assay, also known as ferric ion reducing antioxidant power that measures the antioxidant capacity of foods, beverages, and nutritional supplements containing polyphenols. In this study, 76 FP samples give the highest antioxidant capacity with the value of 0.37 ± 0.01 mM Ferrous equivalent, followed by 74 3P and 76 3P samples which give similar values of 0.36 ± 0.01 mM Ferrous equivalent, among all extraction samples. Consequently, 74 FP and 76 FUP samples give the lowest antioxidant capacity with values of 0.23 ± 0.01 mM Ferrous equivalent. It was observed that there is no significant difference of FRAP antioxidant assay values among different samples of MRQ74 and MRQ76.
According to Abuajah et al. [17], antioxidants are classes of substances that counteract reactive oxygen species and free radicals in cells. In the scientific community, antioxidant activity in food and drink has emerged as one of the most intriguing characteristics. These antioxidants shield the body against harm brought on by free radicals, which have been linked to the development of numerous chronic illnesses, such as cardiovascular disorders, aging, heart disease, anemia, cancer, and inflammation [18].
Antioxidants can be divided into two categories: synthetic and natural. Furthermore, antioxidants can be classified as endogenous or exogenous based on their source, enzymatic or non-enzymatic based on their activities, or water- or lipid-soluble depending on their solubility [19,20]. Natural antioxidants are compounds found in foods that prevent processes such as disruption, sourness, and color change. Natural antioxidants are mostly derived from plants, such as rice, and their activity varies depending on plant species, diversity, extraction and/or processing techniques, and growth conditions [13, 21].
Phytochemical characterization by LCMS-QTOF
Liquid chromatography-quadrupole-time-of-flight mass spectrometry (LC-QTOF-MS) is an analytical technique that advantageously combines quadrupole technologies with a time-of-flight mass analyzer [22]. Widely, mass spectrometry (MS) applications have become a widely accepted technique across numerous fields of biological and pharmaceutical research including metabolite identification, peptide analysis, drug discovery, and food applications industry [23–25]. Based on Figure 1, the total ion chromatograms (TICs) of each MRQ74 and MRQ76 extract in the positive mode are being shown.
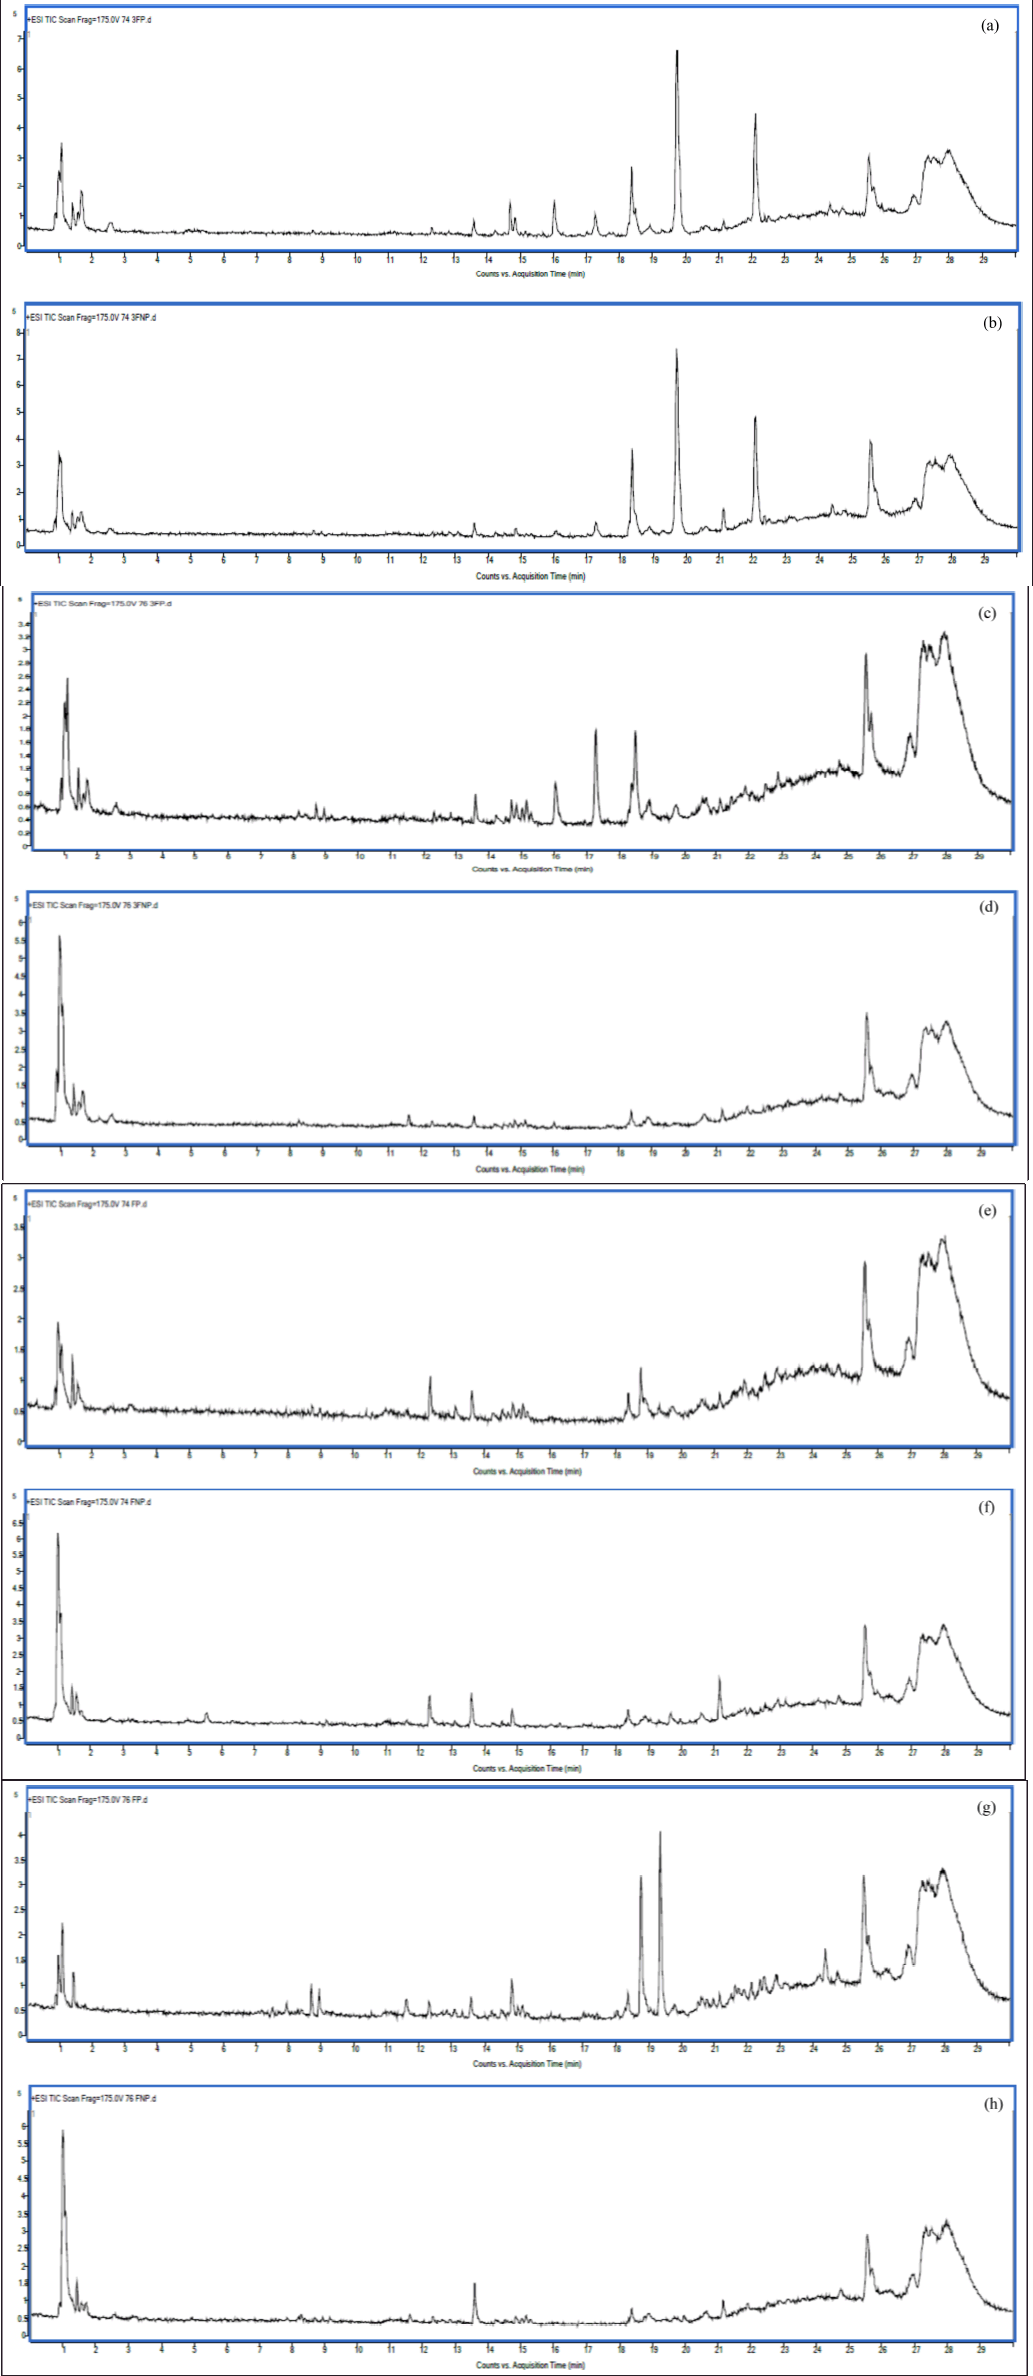 | Figure 1. LC/MS-QTOF chromatograms in positive electrospray ionization from the analysis of the MRQ74 and MRQ76 rice extracts; (a) 74 3P, (b) 74 3UP, (c) 76 3P, (d) 76 3UP, (e) 74 FP, (f) 74 FUP, (g) 76 FP, (h) 76 FUP. [Click here to view] |
It can be observed that the patterns of chromatographic profiles among the MRQ74 and MRQ76 sample varieties were slightly different. There are more than 10 peaks in each sample that were detected and a total of 48 compounds were identified based on the LC/MS-QTOF data, following the confirmation by comparison to reported data, library search, and authenticity compounds (score Db from 90% to 100%) (Tables 3 and 4). Therefore, the identified chemical components in the samples were suggested as small organic acids, amino acids, vitamins, flavonoid derivatives, and phenolic acids.
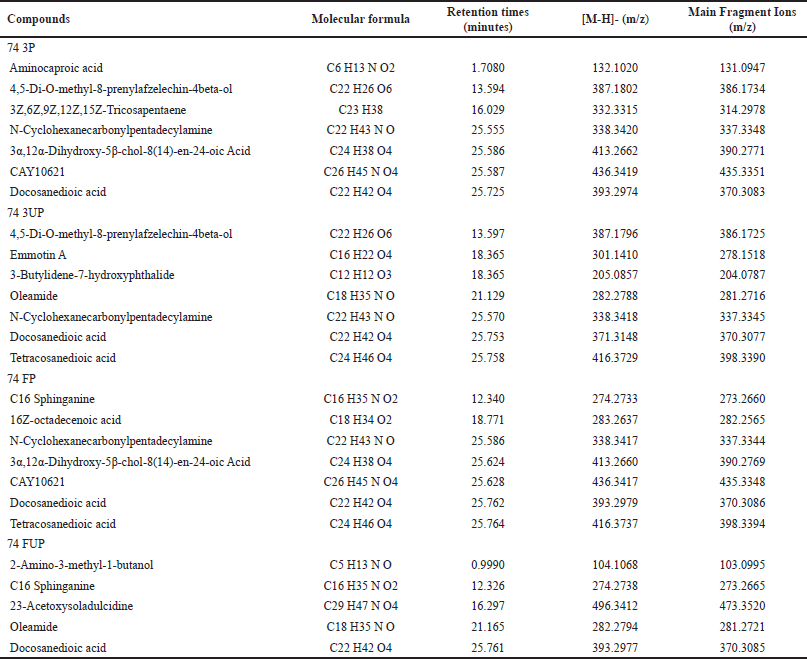 | Table 3. Identification of main compounds in MRQ74 rice extracts with retention times. [Click here to view] |
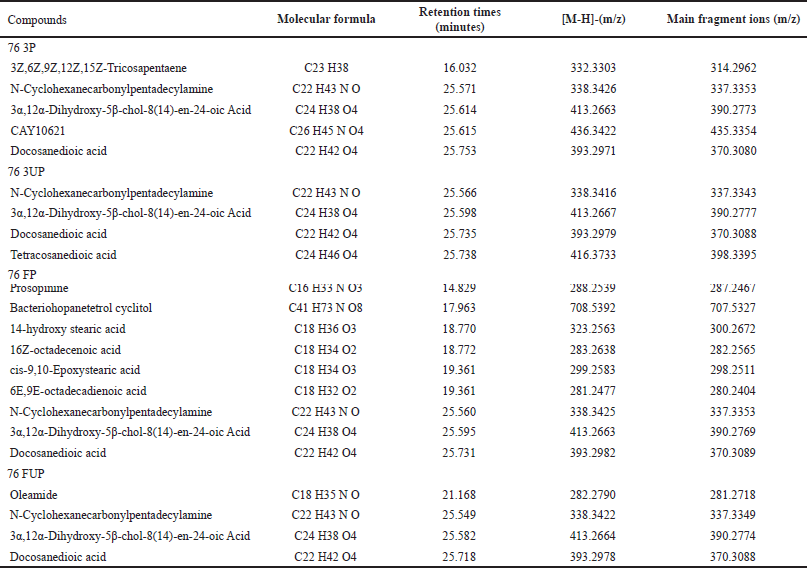 | Table 4. Identification of main compounds in MRQ76 rice extracts with retention times. [Click here to view] |
In Table 4, the results showed that 76 FP samples identified more compounds by LC/MS-QTOF, followed by 74 3P, 74 3UP, and 74 FP samples. While 76 FUP samples identified the lowest compounds by LC/MS-QTOF. In terms of rice varieties, MRQ74 extracts displayed more compounds than that of MRQ76 extracts. As the highest detected fragment ion [M-H]- at m/z at 496.3412 in 74 FUP extract, this compound had been identified as 23-Acetoxysoladulcidine which belongs to the class of spirosolanes and its derivatives compound (Table 3). 23-Acetoxysoladulcidine is a steroidal alkaloid isolated from natural herbs that exhibit anti-proliferation, anti-bacterial, anti-viral, insecticidal, and anti-metastatic effects on various types of cancers [26].
Meanwhile, it can be observed that fragment ion [M-H]- at m/z at 393.2974 and 416.3729 were identified as docosanedioic acid and tetracosanedioic acid compounds, types of carboxylic acids. In this study, these two compounds were present and/or detected in almost each sample of MRQ74 and MRQ76 extract varieties. Docosanedioic acid is an alpha, omega-dicarboxylic acid that possesses some antioxidant activity such as anti-fungal and anti-bacterial activities [27]. Tetracosanedioic acid is a very long-chain fatty acid also known as adipic acid has been shown to have antioxidant activity with anti-inflammatory, anti-fungal, anti-viral, and anti-cancer properties [28].
Oleamide, a fatty acid having the chemical structure C18 H35 NO, is a derivative of oleic acid that was present/or found in 74 3UP, 74 FUP, and 76 FUP samples. Oleamide (cis-9-octadecenamide) is commonly used for a variety of pharmacological effects, including pain relief, anti-atherogenic properties, vasodilation, sedation, lipid metabolism modification, and gap junction inhibition [29,30]. Oleamide is also an endogenous bioactive signaling molecule that operates on a variety of cell types, resulting in sleep induction effects that could attributed to changes in cannabinergic CB-1 receptors in synapse [31]. Aside from that, prosopinine is a naturally occurring alkaloid that is only present and/or found in 76 FP samples with the fragment ion [M-H]- at m/z 288.2539.
CONCLUSION
In conclusion, this study examined the TPC, TFC, antioxidant content, and LC-MS chemical profiling of polished and unpolished MRQ74 and MRQ76 samples. Sample 76 FUP has the highest TPC value of 261.35 ± 0.01 mg GAE/100 g, while sample 74 FP has the lowest at 88.31 ± 0.03 mg GAE/100 g. Sample 76 FP had the highest TFC value (1715.00 ± 0.01 mg CE/100 g), whereas sample 74 FUP had the lowest at 1411.43 ± 0.05 mg CE/100 g. All samples showed antioxidant activity, with the 76 FP sample having the highest value (0.37 ± 0.01 mM Ferrous equivalent). The chemical components found in each sample, according to the LC/MS-QTOF data, were minor organic acids, amino acids, vitamins, flavonoid derivatives, and phenolic acids. The chemicals present and/or detected included 23-Acetoxysoladulcidine, docosanedioic acid, tetracosanedioic acid, oleamide, prosopinine, and others. Thus, the findings suggested that MRQ74 and MRQ76 rice varieties should be considered superior choices for good health advantages when consumed.
ACKNOWLEDGEMENTS
This study was supported by grant number UniSZA/2022/PPL/KPKB (006) from the Kelantan Agricultural Group Berhad (KPKB) and Indonesia-Malaysia-Thailand Growth Triangle (IMT-GT) subregional program which had been approved by the Centre for Research, Excellence, and Incubation Management (CREIM) at Universiti Sultan Zainal Abidin. A special thankful for Paddy and Rice Research Center, Malaysian Agricultural Research and Development Institute (MARDI), Seberang Perai, Pulau Pinang for giving of rice cultivar of MRQ74 and MRQ76. Also, thanks for the help provided from staff of Laboratory CeRIDB UniSZA along the research study done.
AUTHOR CONTRIBUTIONS
All authors made substantial contributions to conception and design, acquisition of data, or analysis and interpretation of data; took part in drafting the article or revising it critically for important intellectual content; agreed to submit to the current journal; gave final approval of the version to be published; and agree to be accountable for all aspects of the work. All the authors are eligible to be an author as per the International Committee of Medical Journal Editors (ICMJE) requirements/guidelines.
CONFLICTS OF INTEREST
The authors report no financial or any other conflicts of interest in this work.
ETHICAL APPROVALS
This study does not involve experiments on animals or human subjects.
DATA AVAILABILITY
All data generated and analyzed are included in this research article.
PUBLISHER’S NOTE
All claims expressed in this article are solely those of the authors and do not necessarily represent those of the publisher, the editors and the reviewers. This journal remains neutral with regard to jurisdictional claims in published institutional affiliation.
USE OF ARTIFICIAL INTELLIGENCE (AI)-ASSISTED TECHNOLOGY
The authors declares that they have not used artificial intelligence (AI)-tools for writing and editing of the manuscript, and no images were manipulated using AI.
REFERENCES
1. Mohd Yusof BN, Abd Talib R, Karim NA. Glycaemic index of eight types of commercial rice in Malaysia. Malays J Nutr. 2005;11(2):151–63.
2. Abubakar B, Yakasai HM, Zawawi N, Ismail M. Compositional analyses of white, brown and germinated forms of popular Malaysian rice to offer insight into the growing diet-related diseases. J Food Drug Anal. 2018;26(2):706–15.
3. Tyagi A, Daliri EB-M, Kwami Ofosu F, Yeon SJ, Oh DH. Food-derived opioid peptides in human health: a review. Int J Mol Sci. 2020;21(22):8825.
4. Tyagi A, Shabbir U, Chen X, Chelliah R, Elahi F, Ham HJ, et al. Phytochemical profiling and cellular antioxidant efficacy of different rice varieties in colorectal adenocarcinoma cells exposed to oxidative stress. PLoS One. 2022;17(6):e0269403.
5. Irina Francesca GM, Daniela Estefania GF, Vivian M. Secondary metabolites in plants;main classes, phytochemical analysis and pharmacological activities. Revistabionatura. 2019;4(4):1000–9.
6. Ceramella J, De Maio AC, Basile G, Facente A, Scali E, Andreu I, et al. Phytochemicals involved in mitigating silent toxicity induced by heavy metals. Foods. 2024;13(7):978.
7. Rohin MAK, Hadi NA, Ridzwan N. Anti-proliferative properties of new variety organic rice MRQ74 extracts against colon cancer cells: in-vitro study. J Pharm Res Int. 2020;32(12):55–67.
8. Alyaqoubi S, Abdullah A, Samudi M, Abdullah N, Addai ZR, Al-Ghazali M. Effect of different factors on goat milk antioxidant activity. Int J Chem Tech Res. 2014;6:3091–6.
9. Shraim AM, Ahmed TA, Rahman MM, Hijji YM. Determination of total flavonoid content by aluminium chloride assay: a critical evaluation. LWT Food Sci Technol. 2021;150:111932.
10. Pithonah NFM, Rohin MAK, Jailani NAF, Ridzwan N, Jumli MN, Hadi NA, et al. Study on phenolic content, flavonoid content and antioxidant capacity of extracts from Lansium Parasiticum (Osbeck). Mediterranean J Chem. 2023;13(1):13–20.
11. Tian S, Nakamura K, Kayahara H. Analysis of phenolic compounds in white rice, brown rice and germinated brown rice. J Agric Food Chem. 2004;52:4808–13.
12. Goufo P, Trindade H. Rice antioxidants: phenolic acids, flavonoids, anthocyanins, proanthocyanidins, tocopherols, tocotrienols,γ-oryzanol, and phytic acid. Food Sci Nutr. 2014;2:75–110.
13. Gulcin I. Antioxidant activity of food constituents: an overview. Arch Toxicology. 2012;86:45–391.
14. Melissa W, Enio M, Paulo FSM, Leila PS, Gerson MSS, Rafael BF. Antioxidant properties of rice grains with light brown, red and black pericarp colours and the effect of processing. Food Res Int. 2013;50(2):698–703.
15. Summpunn P, Panpipat W, Manurakchinakorn S, Bhoopong P, Cheong L-Z, Chaijan M. Comparative analysis of antioxidant compounds and antioxidative properties of Thai indigenous rice: effects of rice variety and processing condition. Molecules. 2022;27(16):5180.
16. Gonzalez-Sarrias A, Francisco A, Tomas-Barberan FA, Garcia-Villalba R. In: Francisco A, Tomas-Barberan FA, Gonzalez-Sarrias A, Garcia-Villalba R. editors. Structural diversity of polyphenols and distribution in foods. Dietary polyphenols: their metabolism and health effects. Hoboken, NJ: John Wiley & Sons; 2020. d
17. Minatel IO, Vanz Borges C, Ferreira MI, Gomez Gomez HA, Chen CYO, Pereira Lima GP. Phenolic compounds: functional properties, impact of processing and bioavailability. In: Soto-Hernandez M, Palma-Tenango M, Garcia-Mateos MR, editors. Phenolic compounds—biological activity. Rijeka, Croatia: IntechOpen; 2017.
18. Abuajah CI, Ogbonna AC, Osuji CM. Functional components and medicinal properties of food: a review. J Food Sci Technol. 2015;52:2522–9.
19. Gulcin I. Antioxidant of food constituents an overview. Arch Toxicol. 2012;86:345–91.
20. Nimse SB, Pal D. Free radicals, natural antioxidants, and their reaction mechanisms. RSC Adv. 2015;5:27986–8006.
21. Zehiroglu C, Ozturk SB. The importance of antioxidants and place in today’s scientific and technological studies. J Food Sci Technol. 2019;56(11):4757–74.
22. Allen DR, McWhinney BC. Quadrupole time-of-flight mass spectrometry: a paradigm shift in toxicology screening applications. Clin Biochem Rev. 2019;40(3):135–46.
23. Minke Y, Juan L, Chengying Z, Hang X, Xiang F, Jinkai Z. LC-Q-TOF-MS/MS Detection of food flavonoids: principle, methodology, and applications. Crit Rev Food Sci Nutr. 2023;19:3750–70.
24. Ridzwan N, Jumli MN, Baig AA, Rohin MAK. Quantitative and optimization of anthocyanin extracted from pomegranate (Punica Granatum) extract by high-performance liquid chromatography (HPLC). Pharmacogn J. 2018;10(4):650–3.
25. Maurer HH, Meyer MR. High-resolution mass spectrometry in toxicology: current status and future perspectives. Arch Toxic. 2016;90:2161–72.
26. Qiu S, Sun H, Zhang AH, Xu HY, Yan GL, Han Y, et al. Natural alkaloids: basic aspects, biological roles, and future perspectives. Chin J Nat Med. 2014;12:401–6.
27. Akbar N, Siddiqui R, Iqbal M, Khan NA. Antibacterial activities of selected pure compounds isolated from gut bacteria of animals living in polluted environments. Antibiotics (Basel). 2020;9(4):190.
28. Raj AK, Upadhyay V, Lokhande KB, Swamy KV, Bhonde RR, Sarode SC, et al. Free fatty acids from cow urine DMSO fraction induce cell death in breast cancer cells without affecting normal GMSCs. Biomed. 2023;11:889.
29. Pereira C, Ahmed M, Firdiawati R, Tyndale R, Rusjan P, Husain I, et al. Are fatty acid amide hydrolase levels elevated in social anxiety disorder? Preliminary findings of a PET study using CURB. J Nucl Med. 2024;65(2):242060.
30. Naumoska K, Jug U, Metli?ar V, Vovk I. Oleamide, a bioactive compound, unwittingly introduced into the human body through some plastic food/beverages and medicine containers. Foods. 2020;9(5):549.
31. Rueda-Orozco PE, Montes-Rodriguez CJ, Ruiz-Contreras AE, Mendez-Diaz M, Prospero-Garcia O. The effects of anandamide and oleamide on cognition depend on diurnal variations. Brain Res. 2017;1672:129–36.