INTRODUCTION
Thiamine or vitamin B1 is an underexplored water-soluble vitamin that plays an indispensable role in energy metabolism, neural functioning, and growth and development [1]. Biochemically, thiamine is comprised of a “pyrimidine ring (2,5-dimethyl-6- aminopyrimidine) and a thiazolium ring (4-methyl-5-hydroxy ethyl thiazole) joined by a methylene bridge” [2]. The pyrophosphate ester form of thiamine, that is thiamine pyrophosphate (TPP), or thiamine diphosphate (TDP) is the active form of thiamine [2]. Approximately 80% of the available thiamine is present in the circulation as TPP and most of the biochemical role of thiamine is hypothesized to be carried out by its TPP cofactor form [2].
Dietary thiamine is absorbed in the small intestine by active transport and is stored in the liver in minute quantities [1]. However, thiamine is characterized by a very short half-life which mandates a continuous dietary supply of thiamine to maintain adequate circulating levels [1]. The global prevalence of thiamine deficiency remains unavailable due to inadequate documentation attributed to its highly enigmatic presentation (mimicking acute systemic illness), inaccessible laboratory assessment techniques, low suspicion of deficiency, or the deficiency being masked under the blanket of malnutrition [3].
Although, thiamine deficiency is rare among healthy adults, neonates and infants are highly susceptible to thiamine deficiency which is associated with a high fatality rate [3,4]. This risk is increased multiple folds when neonates who are exclusively breast fed are born to mothers consuming refined cereals (polished rice, wheat) as their staple, women practicing culturally specified intra partum food avoidances and women experiencing persistent hyperemesis, malabsorption, or some form of systemic illnesses during pregnancy [5,6]. Overt deficiency of thiamine is characterized by catastrophic effects including cardiac and neurological effects, congestive cardiac failure, and even death, if untreated [3].
Liquid chromatography-tandem mass spectrometry remains the gold standard for the assessment of TPP in blood, however, owing to the inaccessibility of the technology and the cost-intensive nature of the assay, TDP estimation is yet to be implemented in routine clinical practice [7]. Many researchers have proposed cheaper and relatively accessible high performance liquid chromatography (HPLC)-based methods for TDP estimations in whole blood [7]. The reported methods employ derivatization of TDP/other esters of thiamine to their respective thiochrome derivatives and subsequent fluorescent detection of obtained derivatives [8]. However, most of the reported methods have shortcomings in clinical practice [7].
Previous methods including methods developed by Herve et al, Lynch et al, Losa et al, and Tallaksen et al, all provide road maps for the development of “ideal”, “affordable” and “accessible” bioanalytical techniques for TDP estimations; however, each method has reported certain shortcomings including longer analysis time, incomplete protein precipitation, lower resolution, and so on [7,9]. Further, whole blood-based thiamine estimations require moderate to high sample volume obtained by classical venipuncture, which is a major challenge in neonatal, pediatric, and geriatric patients [10]. Minimally invasive sampling strategies including the ability to develop robust analytical performance techniques in dried blood spots (DBSs) have gained immense importance to address the above challenge and studies are exploring the feasibility of a robust and sensitive DBS-based method for the determination of circulating TDP that could benefit neonates, infants and patients with compromised vessels where classical venipuncture is difficult [10].
With this background, we aimed to develop a reliable and reproducible gradient HPLC method for TDP estimation from whole blood and DBS samples with minimum extraction steps, simple solvents, short analysis time, and a green chemistry approach. The same developed and validated cost-effective method (cost of the initial investment on instrument/infrastructure) can be implemented widely in screening and diagnosis of thiamine deficiency. TDP assessment can be integrated into basic newborn screening through DBS in regions endemic to thiamine deficiency and the same method can also be extrapolated to other volumetric absorptive micro sampling.
MATERIALS AND METHODS
Chemicals and reagents
TPP, sodium phosphate dibasic heptahydrate, potassium ferricyanide, Methyl tert-butyl ether (MTBE) and hydrochloric acid (HCl) were obtained from Sigma Aldrich. Liquid chromatography mass spectrometry (LC-MS) grade methanol was obtained from RCI Labscan. Analytical grade trichloroacetic acid (TCA), acetonitrile (ACN), and orthophosphoric acid were used. Water was purified by Milli-Q UV plus systems (Millipore Co., Bedford, MA).
Instrumentation
High-performance liquid chromatography was performed in the HPLC system Shimadzu Prominence® LC-20 AD system (Shimadzu Corporation, Kyoto, Japan) with an upper pressure limit of 400 bar, equipped with a Shimadzu RF-20A fluorescence detector. The analysis was performed using a Luna® C18(2), 5 μm, 50 × 3.0 mm HPLC column (Phenomenex column, part number: 00B-4252-Y0), and the relevant data obtained was integrated using LC solutions 1.25 SP4 software.
Buffer pH was adjusted with pH meter ELICO LI 120 and filtered through a 0.45 μm filter membrane (Merck Millipore) using a standard glass filtration unit. Sample separation, protein precipitation, and removal of excess TCA were carried out by centrifugation Hettich Universal 320R centrifuge and Hettich Universal 380 centrifuge. Well-calibrated micropipettes (Eppendorf Hamburg, Germany) were used for all analytical steps to ensure minimal analytical error. Sonicator Sonica was employed to aid degassing as well as sample hemolysis and vortex mixture Remi CM-100 Plus was employed to ensure uniform mixing. The DBS samples were evaporated using a nitrogen evaporator. −20°C Elanpro EFS 340 and −80°C Panasonic MDF-U55V freezers were used for sample and stock storage.
Stock solutions
TPP stock solution of 1 mg/ml (1,000 μg/ml) was prepared in 0.1N HCl, and working solutions were prepared by diluting the stock with 0.1N HCl.
Calibration control (CC) standards and quality control (QC) material
TPP working solutions were obtained by appropriate dilutions of the stock solution with 0.1N HCl to obtain the required set of concentrations for CC standards (1–500 ng/ml) and QC material; low-level QC (LQC), middle-level QC (MQC), and high-level QC (HQC). Further, third-party bilevel control materials for vitamin B1 (control lyophilized in whole blood for vitamins B1/B2/B6-levels 1 and 2, Code Z85019, Lot 014), were obtained from Eureka Lab Division (“This product fulfils all the requirements of Directive 98/79/EC of 27/10/1998 on in vitro diagnostic medical devices”).
Procedures
The study protocol was approved by the Institutional Ethics Committee of Kasturba Medical College and Kasturba Hospital, Manipal Academy of Higher Education, Karnataka, India (Approval No.: 85/2022). Pooled whole blood (in ethylenediaminetetraacetic acid tubes, Lavender cap) was obtained from residual samples from consenting participants. Hematocrit was obtained from the medical records. 40 μl of whole blood (minimal sample volume) was spotted on filter paper and dried overnight in a dark room at 22°C to obtain the corresponding DBS. The whole blood sample and the corresponding DBS sample were carefully labeled and stored at −20°C till sample analysis.
Sample extraction method
Whole blood samples
The whole blood samples were removed from −20°C, thawed to room temperature, and sonicated for 15 minutes to ensure complete hemolysis [8,11]. Protein precipitation was carried out by adding an equal volume of chilled 10% TCA, the mixture was vortexed and incubated at 2°C–8°C for 15 minutes, followed by centrifugation at 4°C for 10 minutes at 10,000 rpm to remove the precipitate and obtain a clear supernatant [8,11]. The clear supernatant so obtained is washed with 1,500 μl of water-saturated MBTE solution (1:1 ratio of Water:MBTE) and centrifuged at 5,000 rpm for 10 minutes to remove excess TCA, and the sample separates into two layers, the upper layer obtained is discarded while the lower layer is utilized for analysis [11]. Similar extraction procedures were followed for DBS samples, calibration standards spiked into whole blood and subsequently spotted DBS, and third party control materials (Fig. 1).
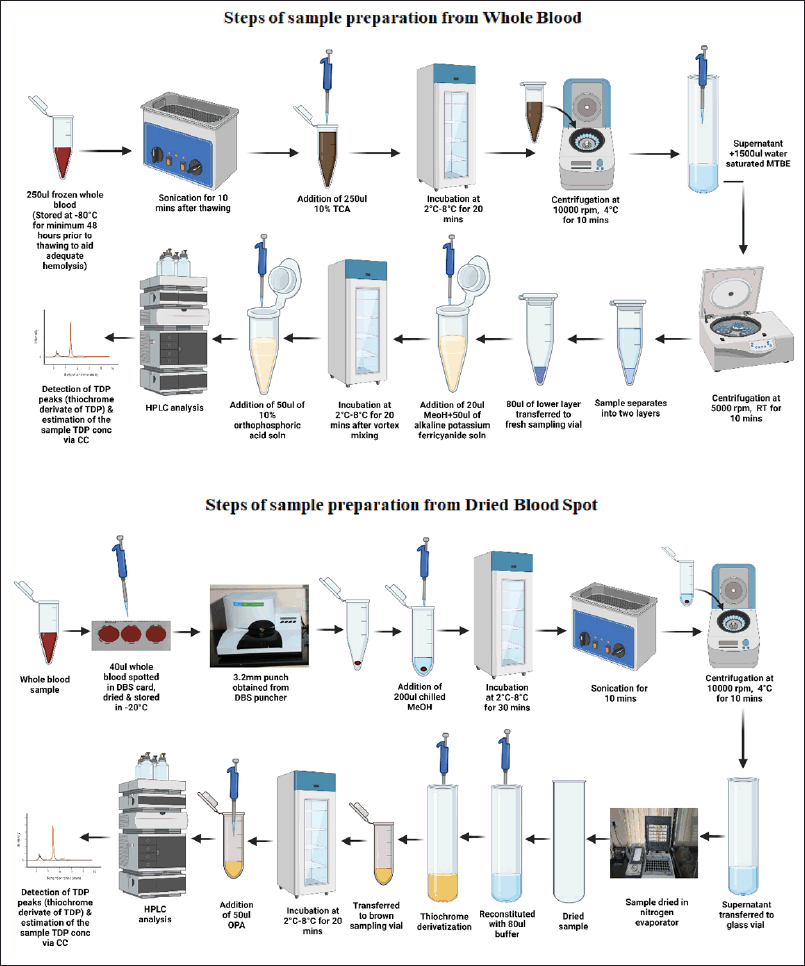 | Figure 1. Sample extraction and processing from whole blood and DBS matrices. [Click here to view] |
80 μl of the so obtained lower layer was treated with 20 μl of methanol (fluorescence enhancer) and 50 μl of 15% alkaline potassium ferricyanide, incubated at 2°C–8°C for 20 minutes, following which the reaction was terminated by adding 50 μl of 10% orthophosphoric acid. The resultant sample was subjected to HPLC analysis [8].
Dried blood spot
The DBS samples were removed from −20°C and 3.2 mm punches were obtained from the central area of the spot (to avoid volcano effect) in sampling vials using PerkinElmer 1296-071 Delfia Spot Punch. The DBS samples so obtained were treated with 200 μl of chilled methanol and incubated at 0°C for 30 minutes, following which the samples were sonicated for 10 minutes and centrifuged at 10,000 rpm in 4°C for 5 minutes [10]. The supernatant obtained was transferred to clean glass vials and evaporated at 25°C–30°C for 10 minutes using a nitrogen evaporator [10] (Fig. 1).
The dried samples were reconstituted in using 80 μl of buffer solution [8]. Similar extraction procedures were followed for whole blood samples, calibration standards spiked into whole blood, and third-party control materials. The reconstituted sample was treated with 20 μl of methanol (fluorescence enhancer) and 50 μl of 15% alkaline potassium ferricyanide. The mixture was transferred into dark vials and incubated at 2°C–8°C for 20 minutes following which the reaction was terminated by adding 50 μl of 10% orthophosphoric acid. The resultant sample was subjected to HPLC analysis [8,10,11].
Method optimization
Method optimization was performed for the following variables.
a. Optimization of method to achieve adequate red blood cells (RBC) lysis: The sonication time was optimized to achieve adequate RBC lysis and peak performance.
b. Flow rate: The flow rate ranging from 0.300 to 0.600 ml/min was explored, the retention time of the analyte, peak characteristics and carry over was assessed and the final flow rate of 0.400 ml/min was fixed based on the most optimum combination of conditions arrived.
c. Gradient program
d. Run time: Analytical run time of 6–15 minutes was evaluated to assess the retention time and the carry over aspects of the analyte, the final run time was fixed at 8 minutes.
e. Ideal solvent to be used for extraction from DBS: Methanol, buffer, 0.1N HCl (diluent employed during serial dilution of neat standards), 10% TCA, and ACN were evaluated as potential extraction solvents. Signal intensity, retention time, peak characteristics, matrix-matched calibration curves obtained were assessed, and it was noted that optimum characteristics for TDP were obtained when methanol was employed as an extraction solvent.
f. Analysis of the DBS extract with and without evaporation/drying: The above-obtained extract was subjected to derivatization with and without preconcentration/drying in repetitive trials. Signal intensity, retention time, and peak characteristics were assessed, and it was noted that higher signal intensities are obtained when the DBS extract is subjected to preconcentration/dried.
g. Ideal solvent for reconstitution of the concentrated/ dried extract obtained from DBS: The preconcentrated DBS extract was reconstituted in methanol and buffer in repetitive trials prior to thiochrome derivatization by alkaline potassium ferricyanide. Signal intensity, retention time, and peak characteristics were assessed, and buffer was chosen as the solvent for reconstitution.
Bioanalytical method validation
The designed method for estimation of TPP from whole blood and DBS was optimized and validated as per the 2001 Food and Drug Administration guidelines for bioanalytical technique validation ensuring specificity, linearity, the limit of detection (LOD), the limit of quantification (LOQ), carry over, accuracy, precision, and robustness of the established analytical method [12].
Linearity and sensitivity
The linearity of the developed method was assessed with TPP standard solutions ranging from 1 to 1,000 ng/ml, linearity in blood and DBS matrix was evaluated within a range of 1–250 ng/ml. All the standards were injected in five replicates, and the linearity range, % relative standard deviation (RSD), LOD, and LOQ were determined.
Selectivity/specificity
The diluent, calibration standards, and the whole blood and DBS matrix and spiked matrix samples were extracted as per the standard protocol, interference from the blank sample (0.1N HCl; diluent) was assessed as per standard guidelines (peak area less than 20% of the LOQ) (Supplementary Figure 1).
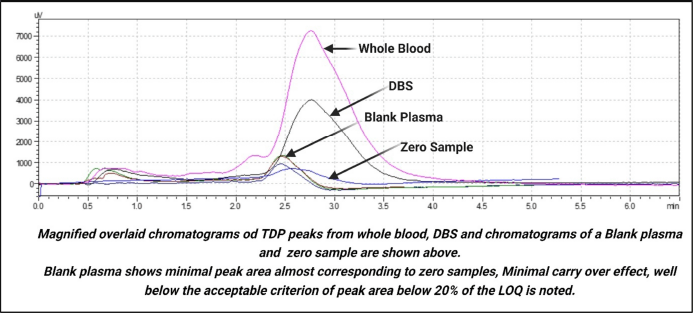 | Supplementary Figure 1. Overlaid chromatogram of zero sample, blank plasma, whole blood & DBS. [Click here to view] |
Accuracy and precision
The accuracy and the precision of the optimized bioanalytical method for TDP were assessed by processing internal QC standards and external QC standards (obtained from Eureka Lab Division), each with five and ten repetitions, respectively. Intra-day and inter-day precision were assessed for CC standards as well as spiked matrix (whole blood and DBS).
Recovery
Recovery was assessed as per the standard guidelines, i.e, “comparison of the peak area of TDP in extracted samples at LQC, MQC, and HQC concentrations versus peak area extracts of blanks spiked with the analyte post extraction” and the recovery was expressed as a percentage [12,13].
Carry-over
Carry-over was assessed by analyzing a zero sample after the highest calibrator/spiked matrix (both whole blood and DBS) in Singulo for 5 days [13].
Stability studies
The stability of the TDP stock solution was assessed for the effect of storage at 2°C–8°C (for a week), and at room temperature for 8 hours (bench top stability of the stock, the approximate time for sample extraction, pre-processing, and analysis). The stability of stored stock solutions was assessed against freshly prepared TDP stock solution and subsequent calibration standards across the entire range of the CC for storage, and bench top stability. The stability of TDP in whole blood and DBS matrix was determined with QC standards and validated for storage and bench top stability. All samples analyzed for stability were compared to freshly obtained samples of the same concentration. Stability was expressed as the mean percentage difference (delta change) in TDP concentration between a fresh sample and a stored sample. Further, freeze-thaw stability of TDP in whole blood was carried out for three continuous freeze-thaw cycles. (It is important to note that freezing the whole blood samples for at least 24 hours, before thawing is essential for adequate RBC lysis, and subsequent TDP estimation, since TDP is present in the erythrocytes, the same has been mentioned by all groups exploring methods for estimation of TDP.)
Hematocrit effect
Whole blood samples were collected from healthy voluntarily consenting donors (n = 6) with known hematocrit [13,14]. The samples were divided into 300 μl aliquots and spiked with TDP standards ranging from 10 to 250 ng/ml and equilibrated for half an hour following which DBS samples were spotted from each aliquot. One aliquot of unspiked whole blood and DBS was retained for each donor. Further, blood from two donors was used to obtain three hematocrit levels between 30% and 60% to cover the hematocrit range of the general population and the obtained samples were spiked in the same process as described above. Whole blood and DBS TDP concentrations were assessed to obtain a comparison between DBS and whole blood TDP as well as ascertain the effect of hematocrit in the estimation of TDP concentration in whole blood and DBS matrix.
Aggregability between whole blood and DBS
Percentage difference in TDP concentration between observed whole blood and DBS of the same donor were analyzed against each hematocrit. To assess the aggregability between matrices mean difference, bias, standard deviation, and the upper and lower limits of agreement were determined, and a Band Altman plot was generated. Correlation and linear regression analyses were employed to further assess aggregability between the two matrices.
Assessment of green chemistry metrics
Current developments in bioanalytical research lay special emphasis on green chemistry and the principles of sustainable development ensuring technological advancement do not bring about catastrophic environmental or health hazards and are reasonable in terms of affordability, accessibility, and feasibility and applicability of pre-processing involved in the analytical technique [15–18]. Complementary green analytical procedure index (ComplexGAPI), blue applicability grade index (BAGI), Analytical GREEnness Metric Approach (AGREE), and analytical greenness metric for sample preparation (AGREE-prep) tools were employed to assess the greenness of the developed method [15–18]. The principle of green analytical chemistry (GAC) focuses on evaluating an analytical method with respect to its impact on the environment, and possible hazardous impact on living beings including humans, and aims at supporting techniques that are environment friendly and less hazardous. GAC evaluates analytical techniques based on the instrumentation and the reagents, the degree of environmental hazards implicated by the reagent, the amount and the type of waste generated, and the energy demands of a method. These techniques provide a comprehensive view of the greenness of the proposed analytical method and help us identify the “weakest point of our analytical technique” in terms of impact to the environment, future studies or method optimization approaches can aid in improving those “weak points of the method”. These techniques are complementary to those that aim at method optimisation through the application of quality by design approach; the only difference being the former aims at assessing the environmental impacts of a method with the aim of promoting the ideals of sustainable development. As per guidelines, GAPI scores ≥75 is classified as “excellent green”, between 50 and 74 is classified as “acceptable green” while <50 is classified as “inadequately green”. BAGI, on the other hand, evaluates the practical applicability of an analytical method taking into account, “the reagents used, the degree of automation, sample volume, the number of analytes which can be simultaneously estimated by the proposed methods and the other technical aspects such as need for preconcentration, derivatization, type of analysis and the analytical technique involved”. The BAGI scores range from 25 to 100, higher scores indicating higher practical applicability of the analytical method.
RESULTS
Derivatization
TDP was derivatized to its thiochrome to enable fluorescence detection. Derivatization was carried out as per the methods described earlier by Lu and Frank [8]. In short, after thawing the frozen sample and sonicating (to obtain RBS membrane lysis), deproteinizing with 10% TCA, and removing excess TCA by adding water-saturated MTBE, 80 μl of the sample (lower layer) was treated with 20 μl methanol followed by 50 μl of 0.04% potassium ferricyanide in 15% sodium hydroxide. The mixture was incubated at 2°C–8°C for 20 mintues to facilitate derivatization following which the extract was neutralized with 50 μl of 10% orthophosphoric acid. The addition of orthophosphoric acid prevents the reconversion of TDP to thiamine by altering the pH of the mixture [8]. For estimation of TDP from DBS samples, 40 μl of sample was spotted on DBS cards, allowed to dry as per standard guidelines for DBS, and 3.2 mm punches were obtained from the central area of the spot. The spots so obtained were treated with 200 μl of chilled methanol and incubated at 0°C for 30 minutes, following which the samples were sonicated for 10 minutes and centrifuged at 10,000 rpm in 4°C for 5 minutes [10]. The supernatant obtained was transferred to clean glass vials and evaporated at 25°C–30°C for 10 minutes using a nitrogen evaporator [10]. The dried samples were reconstituted in using 80 μl of buffer solution [8]. Post reconstitution, the TDP in the sample was treated with alkaline potassium ferricyanide as described above to produce the thiochrome derivative of TDP.
Chromatographic conditions
Method: RP-HPLC method; Stationary phase: Octadecyl silane with ligands bound to the silica surface (C18 column with hydrophobic stationary phase); Column: Luna C18(2), 5 μm, 50 × 3.0 mm 5 μm 50 × 3.0 mm HPLC column (Phenomenex column, part number: 00B-4252-Y0); Mobile phase A: 25 mM sodium phosphate dibasic heptahydrate buffer (Na2 HPO4) in water pH 7, Mobile phase B: Methanol; Column temperature: 32°C; Flow rate: 0.4 ml/min; Elution: Gradient elution: 0–0.01 minutes 5% B; 0.40 minutes, 15% B; 0.99 minutes, 15% B; 1.00 minutes, 80% B; 1.60 minutes, 25% B; 1.61 minutes, 15% B; 1.85 minutes, 15% B, 2.10 minutes, 5% B, held constant till 8 minutes; Injection volume: 20 μl; Excitation maxima: 375 nm; Emission maxima: 435 nm; Precipitating solvent: Chilled TCA (for whole blood); Extraction solvent: Chilled MeOH (for DBS).
Sample extraction technique
In accordance with previous studies, whole blood samples were stored at −20°C for a minimum of 48 hours before sample extraction. The samples were allowed to thaw at room temperature for half an hour, following which the samples were sonicated at 15 minutes to ensure maximum hemolysis. Protein precipitation was carried out using 10% TCA solution in equal quantity as per previous literature, and chilled TCA was observed to produce the best peak characteristics. The samples were incubated at 2°C–8°C for 15 minutes and subjected to centrifugation at 10,000 rpm at 4°C to ensure complete precipitation, after which excess TCA was removed by adding 1,500 μl of water-saturated MTBE. The upper layer was discarded, and the lower layer was used as a sample for further analysis.
For extraction from DBS, DBS prepared from 40 μl whole blood was dried overnight at 22°C and stored at −20°C for a minimum period of 48 hours before sample extraction. 3.2 mm samples were obtained through DBS puncher and the obtained specimens were treated with numerous solvents to arrive at an optimum extraction protocol. 0.1N HCL (diluent), 10% TCA (protein precipitating agent employed for whole blood extraction), chilled methanol, and chilled ACN were used as extraction solvents. Extraction with chilled methanol showed optimum peak characteristics, no interference, desirable retention time, and stability. Post extraction with methanol, the samples were evaporated to dryness and reconstituted with 80μL of buffer, and the derivatization protocol was followed.
Bioanalytical method validation
Linearity
The calibration curves for pure standard, standard as a sample, and spiked whole blood and DBS were generated with peak area in y axis and TDP concentration (ng/ml) in x axis. Linear regression was employed to obtain the slope, intercept, and R2 values for neat standard, standard as sample, whole blood, and DBS. Calibration curves for TDP ranging between 10 and 250 ng/ml (Fig. 2) in whole blood and DBS were found to be linear, while neat standards and TDP standards processed as sample showed linearity ranging between 1 and 500 ng/ml. The whole blood and DBS recorded slopes were 736.53 and 374.46, the recorded intercept was 557.14, and 10,138, and R2 was 0.995, and 0.993 respectively. The TDP concentrations at each standard were determined by employing the equation (y = mx + c) using the data from calibration curves to determine precision and accuracy of the method. The findings fulfilled the acceptance criterion of R2 > 0.98. The LOD and LOQ were determined to be 10.02 and 30.37 ng/ml respectively. The neat standards of TDP and the TDP standards treated as samples showed linearity between 1 and 1,000 ng/ml. However, while matrix matching and matrix spiking, the upper limit of spiking was restricted to 250 ng/ml in accordance with the reported biological reference limits and therapeutic doses of thiamine.
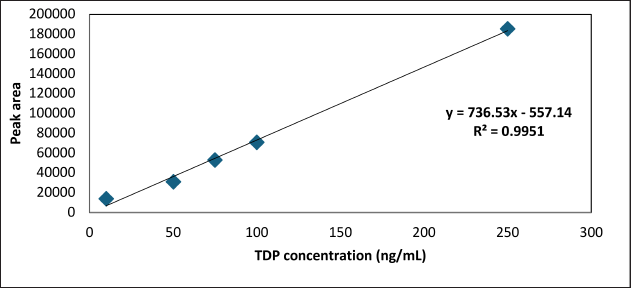 | Figure 2. Representative calibration curve of TDP spiked in whole blood. [Click here to view] |
Selectivity
The method was reliable for quantification of TDP. No interfering peaks were observed in neat standards and standards processed as samples, at the retention time (2.762 ± 0.03 minutes, tailing factor: 1.808; 2.767 ± 0.025 minutes, tailing factor:1.545 respectively) of TDP. The protein precipitation with 10% TCA and the subsequent extraction method optimized for whole blood was found to be reliable with minimal interference (well below 20% LOQ) at the retention time of 2.787 ± 0.09 minutes and a tailing factor of 1.382. The optimized method for TDP extraction from DBS was observed to be reliable with minimal interference (well below 20% LOQ) at the retention time of 2.718 ± 0.03 minutes and a tailing factor of 1.223. The peak shape was good and fulfilled all the acceptance criteria under the optimized chromatographic conditions for both matrices. Figure 3 depicts chromatogram overlays of depicting selectivity and minimal interferences from other matrix components.
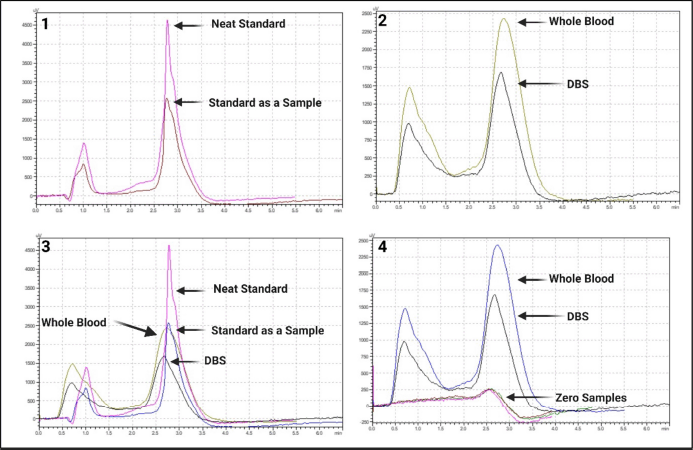 | Figure 3. Representative chromatograms of TDP from standards, whole blood and DBS matrices. [Click here to view] |
Accuracy and precision
The accuracy and precision of the developed method within (intra) day and between (inter) day for TDP in neat standards, standards processed as samples, and whole blood and DBS matrix have been represented in Tables 1–6. LQC, MQC, and HQC were determined to be within acceptable limits with all levels ranging between 1% and 10% for whole blood, and 1%–14% for DBS. Further, analysis of TDP from third-party control materials was observed to be within acceptable limits of 1.3%–10.8% for whole blood and 7%–18.6% for DBS.
 | Table 1. Intraday accuracy & precision in neat standards. [Click here to view] |
 | Table 2. Intraday accuracy & precision in standards processed as samples. [Click here to view] |
 | Table 3. Intraday accuracy & precision in whole blood. [Click here to view] |
 | Table 4. Intraday accuracy & precision in DBS. [Click here to view] |
 | Table 5. Inter-day accuracy & precision in neat standards. [Click here to view] |
 | Table 6. Inter-day accuracy & precision in standards processed as samples. [Click here to view] |
Recovery
The mean TDP recovery from whole blood and DBS at the designated control levels 50 ng/ml (LQC), 75 ng/ml (MQC), and 250 ng/ml (HQC) concentrations were found to be in the range of 87.4%–101.18% and 95.8%–123% respectively in “comparison of the peak area of TDP in extracted samples at LQC, MQC, and HQC concentrations versus peak area extracts of blanks spiked with the analyte post extraction”. Bias% for control samples in whole blood were found to be 3.07% (LQC), 3% (MQC), and 1.18% (HQC), in DBS were found to be 8.1% (LQC), 4.7% (MQC) and 0.1% (HQC), respectively (Table 8). Further, the mean recovery from third-party control material for whole blood and spotted DBS were found to be in the range of 85.8%–110.8% and 81.38%–111.31% which is well within the acceptance criteria provided by the manufacturer (Table 9). Coefficient of variation percentage for control material for whole blood and DBS were found to be 7.8%, and 21.9%, respectively.
 | Table 7. Accuracy & precision determined from external/third party control material. [Click here to view] |
 | Table 8. Percentage recovery of TDP from spiked whole blood matrix. [Click here to view] |
 | Table 9. Percentage recovery of TDP from spiked DBS matrix. [Click here to view] |
Carry-over
Carry-over was assessed by analyzing a zero sample after the highest calibrator/ spiked matrix (both whole blood and DBS) in Singulo for 5 days and was found to be well within the acceptance criterion of the peak area not exceeding 20% of the LOQ. Further, five consecutive zero samples were recorded in five different days.
Stability studies
The optimized method was assessed for analyte stability in stock solution and stability in matrix. TDP stock standard stored at 2°C–8°C for a week and stock solution stored at room temperature for 8 hours, was observed to be stable showing a percentage recovery of 86.86%–120.26% (mean recovery 104.37%). TDP showed stability in whole blood matrix for 6 hours (within a tolerance limit of 15%) (Table 3), however, DBS samples post derivatization were stable only for 2 hours (Table 4) and only when stored in dark vials. Three cycles of freeze-thaw stability were assessed in a spiked whole sample (Table 10). All the above data have been represented in Tables 1–6.
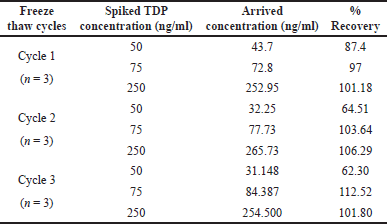 | Table 10. Freeze thaw stability of whole blood TDP. [Click here to view] |
Hematocrit effect
The optimized method was evaluated at three different hematocrit levels, that is 41.2% (Hematocrit A), 61.8% (Hematocrit B), and 30.9% (Hematocrit C) accounting for the expected hematocrit ranges observed in the general population. The percentage recoveries were found to be in the range of 77.6%–119.9% at hematocrit of 41.2% (A1), 88.9%–107% at hematocrit of 61.8% (B1) and 85%–134% at hematocrit of 30.9% (C1) in whole blood while DBS showed a percentage recovery of 70%–130% at hematocrit of 41.2% (A2), 76%–119% at hematocrit of 61.8% (B2) and a recovery of 96%–162% at a hematocrit of 30.9% (C2). The mean recoveries at different hematocrit levels in both matrices have been represented in Table 11.
 | Table 11. Mean recovery of TDP from spiked matrices at three hematocrits. [Click here to view] |
Figure 4 depicts the percentage recovery of whole blood and DBS at spiked matrices at different TDP concentrations at different hematocrit levels.
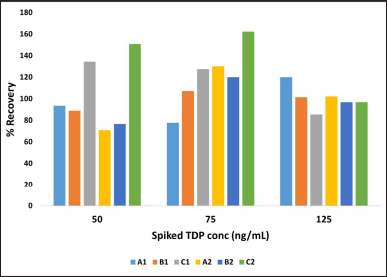 | Figure 4. Percentage recovery of TDP in whole blood and DBS at three hematocrits. [Click here to view] |
Further, hematocrit-corrected matrix-matched calibration curves would aid in hematocrit correction (while applying the method to patient samples) and eliminate hematocrit bias.
Aggregability between whole blood and DBS
Figure 5 depicts the percentage difference between DBS and whole blood concentrations, plotted against hematocrits at two TDP concentrations (50 and 125 ng/ml).
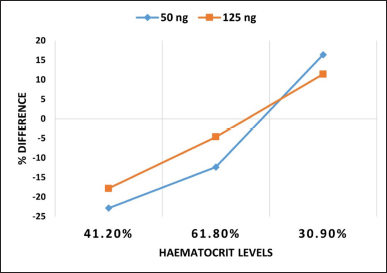 | Figure 5. Percentage difference between whole blood and DBS against hematocrit. [Click here to view] |
A strong positive statistically significant correlation was observed between whole blood TDP and DBS TDP concentration (r = 0.882, p value 0.007). A Bland Altmann plot was generated to assess the degree of agreeability between whole blood and TDP (bias: −2.7; upper limit of agreement: 29.14; lower limit of agreement: −34.56), (Fig. 6).
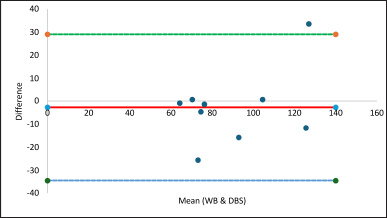 | Figure 6. Bland Altman plot for whole blood and DBS TDP. [Click here to view] |
Linear regression was employed to predict whole blood TDP concentrations from DBS TDP concentration, and a statistically significant regression equation was found (F (1, 7) = 14.60, p < 0.0065), with an R2 of 0.675. A regression equation of Y = 0.6318X + 35.2766 was obtained (Fig. 7).
 | Figure 7. Linear regression between whole blood and DBS TDP concentrations. [Click here to view] |
Assessment of green chemistry metrics
The outputs obtained from the ComplexGAPI, BAGI, AGREE, and AGREEprep green chemistry analytical tools are represented in Figure 8. Assessment of the greenness of the proposed methods using the above analytical tools yielded scores well within the acceptable recommendations of green chemistry principles [15–18].
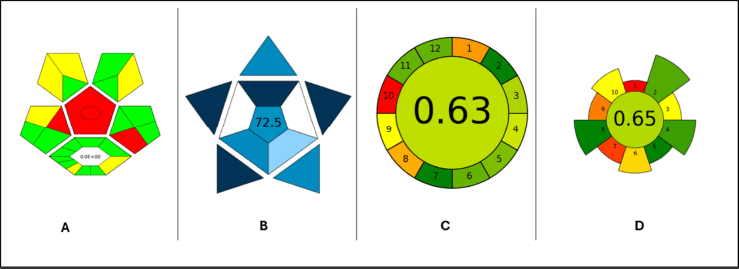 | Figure 8. Assessment of green chemistry metrics. [Click here to view] |
DISCUSSION
Assessment of TPP, the predominant form of thiamine in human circulation, is of utmost importance in early diagnosis of thiamine deficiency, especially due to the catastrophic sequalae of acute thiamine deficiency among the vulnerable population [1,3–7]. However, routine diagnostics for assessment of circulating thiamine remains elusive from most of the clinical settings making the diagnosis difficult and a diagnosis of exclusion (confirmed only by thiamine challenge test). Numerous methods have been proposed to assess blood TDP levels but none of it have made a translational impact and have made way to routine clinical diagnostics, especially in Southeast Asian belts [9]. This study aimed to address this gap and proposes a validated HPLC-fluorescence based method for the estimation of TPP from whole blood and DBS samples. The method demonstrates adequate performance characteristics as per regulatory bodies with good selectivity (minimal interference with matrix components, well within the acceptable limits of peak area less than 20% of LOQ), linearity (10–250 ng/ml) over a wide range, acceptable precision, accuracy (Tables 1–6), LOD (10.02 ng/ml) and LOQ (30.37 ng/ml), and excellent recovery (Tables 8 and 9). The proposed method also showed excellent performance with third-party QC material (Table 7), and excellent agreeability between whole blood and DBS matrices (Figs. 5–7). The study also assessed the effect of hematocrit in estimation of TDP (Table 11) and the overall greenness of the proposed method (Fig. 8). Further, the proposed method evades the requirement of TCA-based extraction from DBS, thus shortening the preanalytical sample preparation time and ensures longer column life.
In the current study, the authors are reported a matrix-matched calibration curve upto 250 ng/ml. The upper limit was fixed in accordance with the reported biological reference limits and therapeutic doses of thiamine. A study by Stidsen et al. [19], reported a range of 101 to 189 nmol/L which is equivalent to 46.537–87.08 ng/ml (molecular weight of TDP is 460.77 g/mol), a study by Gangolf et al. [20], reported a range of 138 ± 33 nmol/l which is equivalent to 63.586 ± 15.205 ng/ml while another study by Mathew et al. [21] reported a range of 116 ± 71 ng/ml. Stidsen et al. [19] employed the LCMS/MS method to establish the reference range of whole blood TDP by extracting TDP using the extraction kit by Chromsystems. While the use of pre-validated extraction kits ensures quality and reduction in manual errors, the cost per analysis increases significantly. Mathew et al. [21] reported a HPLC fluorimetry-based method for TDP estimation in whole blood as well as DBS using aspirin as an internal standard. The method had a total run time of 13 minutes with TDP eluting at approximately 5 minutes, the study reported TDP detection from 11.1 mm DBS punches and reported a recovery of 81%–90% [21]. The current method proposes the use of small punch sizes, allowing multiple assays to be performed from a single punch, and a faster extraction procedure while reporting similar/higher recovery. The TDP extraction and estimation method reported by Huang et al. [10] is closely related to our present study, but with a longer extraction procedure, the study has also evaluated the TDP values post intervention and has demonstrated the bioavailability of the administered thiamine.
Studies on bioanalytical method development usually recommend the use of appropriate internal standard to account for the preanalytical and analytical variations in multistep analytical processes using complex matrices [10]. However, we were unable to select an ideal internal standard, and stable isotope of TDP failed to show resolution when compared to unlabelled TDP standard as well as endogenous TDP [10]. The authors explored options of utilizing aspirin and amprolium hydrochloride as internal standard; however, the analytes failed to show excitation and emission maxima in the range of TDP, post thiochrome derivatization [10,21,22]. Therefore, as per the conclusion of Huang et al. [10] and given the robust performance characteristics of the method, the authors of the current study also recommend that the current method could be safely implemented in diagnostic setups with the incorporation of matrix-matched external QC materials as per Clinical and Laboratory Standards Institute guidelines [23].
The limitations of the proposed methods are the failure to exhibit stability in whole blood and DBS TDP concentrations post derivatization [10]. The derivatized samples from blood and DBS matrices only exhibited 4-hour stability when compared to neat TDP standards which showed excellent bench-top stability (8 hours–12 hours) [10]. This is in agreement with the previous reports and may be attributed to the complexity of the matrix and the increased light sensitivity of TDP in the presence of matrix components [24,25].
The developed and validated method can be widely implemented for screening and diagnosis of thiamine deficiency in vulnerable population. DBS-based thiamine estimation through the proposed method can be implemented as a standard of care due to the validation of the performance characteristics of DBS matrix which would allow sample transport (under ideal conditions) with minimal deterioration of analytes and ensure robust results even when sampling volume is minimal (40 μl of whole blood used for making a DBS spot) as in the case of pediatric and geriatric patients. Further, the proposed technique evades the use of TCA in DBS matrix which could effectively increase column life and thus lowering the cost per analysis (additional cost of the initial investment on instrument/infrastructure, LC-MS/MS setup being cost intensive) to the testing laboratory and the patient.
CONCLUSION
The proposed method has demonstrated performance characteristics well within the guidelines of regulatory bodies and is suitable for implementation in diagnostic setups. Further, the excellent agreeability of DBS and whole blood TDP eases the assessment of TDP in vulnerable populations with difficult venous access, which includes neonatal population, infants, geriatric patients, and patients on chemotherapeutic treatments. DBS-based assessments enable higher sample integrity while the transportation of samples from remote areas to referral labs where HPLC-based TDP estimations are feasible. In the background of high incidences of thiamine deficiency in South Asian countries, the enigmatic presentation of thiamine deficiency (mimicking sepsis), the fatal sequalae of acute thiamine deficiency, it is proposed that TDP screening is implemented as a standard of care in neonatal and infant population. Further, post intervention assessment of TDP levels would aid in detecting bioavailability and provide better insight to transporter defects of other causes of the presentation mimicking acute thiamine deficiency. The proposed technique may be utilized to ensure rapid TDP estimations from whole blood or DBS matrix at a relatively cost-effective price (when compared to LCMS-based analysis).
LIST OF ABBREVIATIONS
ACN, acetonitrile; ANOVA, Analysis of variance; BAGI, blue applicability grade index; CC, calibration curve; cGAPI, complementary green analytical procedure index; DBS, dried blood spot; GAC, green analytical chemistry; HCl, hydrochloric acid; HPLC, high performance liquid chromatography; HQC, high level quality control; LC-MS, liquid chromatography mass spectrometry; LOD, limit of detection; LOQ, limit of quantification; LQC, low level quality control; MQC, medium level quality control; MTBE, methyl tert-butyl ether; QC, quality control; RBC, red blood cells; RP-HPLC, reverse phase-high performance liquid chromatography; RSD, relative standard deviation; TCA, trichloroacetic acid; TDP, thiamine diphosphate; TPP, thiamine pyrophosphate
ACKNOWLEDGMENTS
We thank the management of Manipal Academy of Higher Education and the Dean of Kasturba Medical College, Manipal, for providing us with an environment conducive for research. We thank our funding agency for their monetary support. We profusely thank our donors who have contributed significantly to this study by donating their blood to assess the performance characteristics of the method. We also express our heartfelt gratitude to Ms. Mrunal Pradeep Desai for her valuable technical support in fine tuning the study.
AUTHOR CONTRIBUTIONS
All authors made substantial contributions to conception and design, acquisition of data, or analysis and interpretation of data; took part in drafting the article or revising it critically for important intellectual content; agreed to submit to the current journal; gave final approval of the version to be published; and agree to be accountable for all aspects of the work. All the authors are eligible to be an author as per the International Committee of Medical Journal Editors (ICMJE) requirements/guidelines.
FINANCIAL SUPPORT
This research was funded by the Vision Group Science and Technology, Centres of Excellence in Science, Engineering and Medicine (CESEM) Karnataka, Grant No. GRD 308/2014-15.
CONFLICTS OF INTEREST
The authors report no financial or any other conflicts of interest in this work.
ETHICAL APPROVALS
Ethical approval details is given in the ‘Material and Method’ section.
DATA AVAILABILITY
All data generated and analyzed are included in this research article.
PUBLISHER’S NOTE
All claims expressed in this article are solely those of the authors and do not necessarily represent those of the publisher, the editors and the reviewers. This journal remains neutral with regard to jurisdictional claims in published institutional affiliation.
USE OF ARTIFICIAL INTELLIGENCE (AI)-ASSISTED TECHNOLOGY
The authors declares that they have not used artificial intelligence (AI)-tools for writing and editing of the manuscript, and no images were manipulated using AI.
REFERENCES
1. National Institute of Health Office of Dietary Supplements [Internet]. Bethesda, USA: National Institute of Health; 2018. Thiamin; 2018 [cited on 2024 March 15]; [approximately 3 screens]. Available from: https://ods.od.nih.gov/factsheets/Thiamin-HealthProfessional/
2. Lonsdale D. A review of the biochemistry, metabolism and clinical benefits of thiamin(e) and its derivatives. Evid Based Complement Alternat Med. 2006;3(1):49–59. CrossRef
3. Smith TJ, Johnson CR, Koshy R, Hess SY, Qureshi UA, Mynak ML, et al. Thiamine deficiency disorders: a clinical perspective. Ann N Y Acad Sci. 2021;1498(1):9–28. CrossRef
4. Dhir S, Tarasenko M, Napoli E, Giulivi C. Neurological, psychiatric, and biochemical aspects of thiamine deficiency in children and adults. Front Psychiatry. 2019;10:207. CrossRef
5. Venkatesh U, Sharma A, Ananthan VA, Subbiah P, Durga R; CSIR Summer Research Training Team. Micronutrient’s deficiency in India: a systematic review and meta-analysis. J Nutr Sci. 2021;10:e110. CrossRef
6. Belsky JB, Wira CR, Jacob V, Sather JE, Lee PJ. A review of micronutrients in sepsis: the role of thiamine, l-carnitine, vitamin C, selenium and vitamin D. Nutr Res Rev. 2018;31(2):281–90. CrossRef
7. Whitfield KC, Bourassa MW, Adamolekun B, Bergeron G, Bettendorff L, Brown KH, et al. Thiamine deficiency disorders: diagnosis, prevalence, and a roadmap for global control programs. Ann N Y Acad Sci. 2018;1430(1):3–43. CrossRef
8. Lu J, Frank EL. Rapid HPLC measurement of thiamine and its phosphate esters in whole blood. Clin Chem. 2008;54(5):901–6. CrossRef
9. Cheng X, Ma D, Fei G, Ma Z, Xiao F, Yu Q, et al. A single-step method for simultaneous quantification of thiamine and its phosphate esters in whole blood sample by ultra-performance liquid chromatography-mass spectrometry. J Chromatogr B Biomed Appl. 2018;1095:103–11. CrossRef
10. Huang Y, Gibson RA, Green TJ. Measuring thiamine status in dried blood spots. Clin Chim Acta. 2020;509:52–9. CrossRef
11. Wei X, Leffler A, Pike E, Rivera B. A simple and effective method for HPLC quantification of Thiamin diphosphate (Vitamin B1) from whole blood using a luna C18(2) HPLC column and fluorescence detection. Phenomenex. 2014. Technical note (TN-1172).
12. Meesters R, Voswinkel S. Bioanalytical method development and validation: from the USFDA 2001 to the USFDA 2018 guidance for industry. J Appl Bioanal. 2018;4(3):67–73. CrossRef
13. Capiau S, Veenhof H, Koster RA, Bergqvist Y, Boettcher M, Halmingh O, et al. Official international association for therapeutic drug monitoring and clinical toxicology guideline: development and validation of dried blood spot–based methods for therapeutic drug monitoring. Ther Drug Monit. 2019;41(4):409–30. CrossRef
14. Why and how to matrix spike [Internet]. Thermo Fisher Scientific; [cited on 2024 July 15]; [approximately 8 screens]. Available from: https://assets.thermofisher.com/TFS-Assets/LPD/Product-Information/Why-How-Matrix-Spike-ST-MATSPIKE-EN.pdf
15. Pena-Pereira F, Wojnowski W, Tobiszewski M. AGREE—analytical GREEnness metric approach and software. Anal Chem. 2020;92(14):10076–82. CrossRef
16. Wojnowski W, Tobiszewski M, Pena-Pereira F, Psillakis E. AGREEprep–analytical greenness metric for sample preparation. Trends Anal Chem. 2022;149:116553. CrossRef
17. P?otka-Wasylka J, Wojnowski W. Complementary green analytical procedure index (ComplexGAPI) and software. Green Chem. 2021;23(21):8657–65. CrossRef
18. Manousi N, Wojnowski W, P?otka-Wasylka J, Samanidou V. Blue applicability grade index (BAGI) and software: a new tool for the evaluation of method practicality. Green Chem. 2023;25(19):7598–604. CrossRef
19. Stidsen NM, Bjerg LN, Sandfeld-Paulsen B. Establishing reference intervals for thiamine pyrophosphate and pyridoxal 5’-phosphate in whole blood in a Danish cohort using liquid chromatography tandem-mass spectrometry (LC-ms/ms). Scand J Clin Lab Invest. 2024;84(5):311–16. CrossRef
20. Gangolf M, Czerniecki J, Radermecker M, Detry O, Nisolle M, Jouan C, et al. Thiamine status in humans and content of phosphorylated thiamine derivatives in biopsies and cultured cells. PLoS One. 2010;5(10):e13616. CrossRef
21. Mathew EM, Sakore P, Lewis L, Manokaran K, Rao P, Moorkoth S. Development and validation of a dried blood spot test for thiamine deficiency among infants by HPLC–fluorimetry. Biomed Chromatogr. 2019;33(11):e4668. CrossRef
22. Kim J, Jonus HC, Zastre JA, Bartlett MG. Development of an IPRP-LC-MS/MS method to determine the fate of intracellular thiamine in cancer cells. J Chromatogr B Biomed Appl. 2019;1124:247–55. CrossRef
23. Parvin CA. What’s new in laboratory statistical quality control guidance? The 4th edition of CLSI C24, statistical quality control for quantitative measurement procedures: principles and definitions. J Appl Lab Med. 2017;1(5):581–4. CrossRef
24. Malsagova K, Kopylov A, Stepanov A, Butkova T, Izotov A, Kaysheva A. Dried blood spot in laboratory: directions and prospects. Diagnostics. 2020;10(4):248. CrossRef
25. Zakaria R, Allen KJ, Koplin JJ, Roche P, Greaves RF. Advantages and challenges of dried blood spot analysis by mass spectrometry across the total testing process. eJIFCC. 2016;27(4):288.