INTRODUCTION
CML is a blood malignancy caused by the migration of chromosomes 9 and 22, resulting in the creation of the Philadelphia chromosome [1]. This causes the fusion of two genes, the break-point cluster region gene (BCR) on chromosome 22 and the Abelson murine leukemia gene (ABL) on chromosome 9, forming the BCR-ABL oncogene [1–3]. BCR–ABL is a tyrosine kinase that disrupts normal cell regulatory systems and increases ABL kinase activity, resulting in excessive production of myeloid cells, enhanced cellular proliferation, reduced cell death, and the onset of CML. CML constitutes around 10% of all cases of leukemia in adults, typically occurring at a median age of 64 years. There were approximately 5,980 new cases of CML diagnosed in the U.S. Additionally, CML was identified as the second leading cause of death associated with cancer. Anticancer medications have significant adverse effects due to their high dosage administration [1–4]. Currently, there is a significant focus on developing pharmaceutical substances that specifically target oncogenic kinases. The aim is to use these substances to augment therapy and increase the survival rates of patients with CML. bosutinib (BOS) is a type of inhibitor that targets both Abl and Src proteins. It effectively inhibits the proliferation of CML cells in a laboratory setting. It is also effective against various mutations of the BCR-Abl protein that are resistant to Imatinib, another drug used to treat CML. Ongoing clinical trials have shown that BOS is effective in treating CML patients who are resistant to Imatinib [4–6]. The chemical is orally active and belongs to the methoxy-4-anilinoquinoline-3-carbonitrile class. The drug obtained approval from the US FDA and European Medicines Agency on September 4, 2012 and March 27, 2013, respectively, for the (EMA) treatment of chronic myelogenous leukemia. This compound hinders signaling through platelet-derived growth factor receptors and vascular endothelial growth factor receptors. However, it is important to note that this compound is a substrate for P-glycoprotein, which results in low bioavailability and potential drug resistance [6–8]. A significant part of newly developed drug candidates from drug discovery programs exhibit water insolubility, hence limiting their dissolution and release. Lipophilic chemicals constitute around 40% of novel chemical entities. Compounds that are lipophilic have limited solubility in water and an imperfect capacity to dissolve, leading to reduced bioavailability. Regrettably, the mere advancement of novel pharmaceuticals falls short of enhancing their therapeutic efficacy. Certain medicines exhibit low water solubility and require encapsulation within drug carriers for administration. On some occasions, medications are unable to penetrate cell membranes, resulting in an inadequate concentration at the desired location [7–9]. To address this issue, administering large quantities of medication is necessary, resulting in elevated toxicity and numerous undesirable side effects. Therefore, the utilization of a targeted drug delivery system has the capacity to convey precise drug concentrations to the desired tissue (or cell), thereby improving its bioavailability and reducing the negative consequences caused by excessive doses. BOS falls in BCS class IV (Low solubility and Low permeability) relatively insoluble in water with an acid dissociation constant (pKa) of 15.48. Thus, exhibiting a slow gastro intestinal absorption rate with inter individual variation in bioavailability. The reported bioavailability of BOS is about 34% which is low because of extensive P-glycoprotein transporter-dependent efflux and low permeability [10,11]. Therefore, there is an unmet medical need to develop an appropriate delivery system to deliver the drug with enhanced bioavailability resulting in a lower dose of drug for the treatment and targeting the site-specific tumors for fewer undesirable responses.
Lipid nanoparticles (LNPs) are widely acknowledged for their reduced toxicity and enhanced biocompatibility when compared to inorganic or polymeric nanoparticles. More precisely, solid lipid nanoparticles (SLNs) or LNPs have emerged as a feasible and promising alternative [12]. The diagram elucidating the chemical structure of BOS as shown in Figure 1.
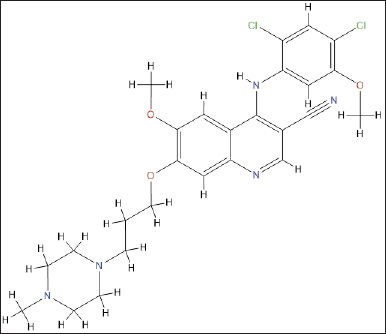 | Figure 1. Chemical structure of Bosutinib monohydrate.. [Click here to view] |
METHODOLOGY
Reagents and chemicals
BOS Monohydrate was obtained from Alembic Pharmaceutical, Hyderabad, AP, India. Glyceryl monostearate (GMS), Compritol, Precirol ATO, and Gelucire were received as kind gift samples from Gattefosse (Mumbai, India). TPGS, Poloxamer 188, and Tween-80 were received from BASF and SD Fine chem, respectively. Ethanol, acetonitrile, DCM, high-performance liquid chromatography (HPLC) grade formic Dichloromethane acid, and so on, were acquired from Merck Limited (Mumbai, India). All other reagents used were of analytical grade.
Analytical method development
Analytical method by UV spectrophotometer for BOS
The drug solution was scanned in water from 200 to 600 nm to estimate the drug λmax. The absorption maximum (λmax) for BOS was found at 268 nm, and it was chosen for the calibration curve determination. In the concentration range of 2–12 μg/ml, the linear relationship between the drug concentration and corresponding absorbance values confirmed that follows Beer’s law. Corresponding absorbance values were shown to positively correlate with BOS concentration [13].
Statistical software used
Design-Expert (Ver.13), Stat-Ease Inc., Minneapolis, MN, was utilized for formulation optimization of the runs. Microsoft Excel 2018 (Microsoft, USA) was used for calculations of standard linearity and statistical analysis [14].
Selection of lipids by equilibrium solubility method
A modified saturated solubility method was employed to determine the drug equilibrium solubility in a variety of solid lipids, including stearic acid, compritol ATO 888, precirol, and GMS. The test tubes containing different lipids (100.0 mg each) were heated using a water immersion until precipitation was observed. Subsequently, an excess amount of BOS (in increments of 5.0 mg) was added to each tube. A SPINIXTM Orbital Shaker (Tarsons, India) was employed to agitate the samples gently over a period of 24 hours at ambient temperature. The specimens were centrifuged using warm water, and a 200 μl fraction was diluted with a tepid solution of 80:20 methanol and water. To figure out the BOS concentration, the solution mentioned above was analyzed using a UV-Visible spectrophotometer set to its maximal wavelength of 268 nm [15,16].
Procedure of formulation development of LNPs
Various techniques have been documented for the production of nanoparticles, such as hot-melt emulsification, solvent-antisolvent approach, solvent evaporation, nanoprecipitation, and microfluidizer-based methods, among others [17,18]. The selection procedure is carried out in accordance with the characteristics of the drug and various physicochemical properties of lipids, and surfactants. The solvent evaporation technique was utilized to formulate the BOS LNPs. This process entailed dissolving a predetermined quantity of BOS and lipids in ethanol. The required amount of Poloxamer 188 was dissolved in water to prepare the aqueous phase. The ratio of the lipid phase to the aqueous phase was consistently maintained at 0.5:1. A high shear homogenizer at 10,000 rpm (T10 ULTRA-TURRAX, IKA) was used to disseminate the organic phase in the aqueous phase containing surfactant. The dispersion underwent sonication using a probe sonicator (Sonics & Materials, Inc., US) at a power of 500 W and an amplitude of 20% for a duration of 240 seconds (30 seconds for ON and 20 seconds for OFF). Subsequently, the organic solvent was eliminated under decreased pressure utilizing a rotary evaporator (Buchi Rotavapor®, USA), and the nanoparticles were isolated using Sorvall™ Ultracentrifuge (Thermo Scientific, Waltham, USA) at 20,000 rpm for 20 minutes. BOS-loaded lipid nanoparticles (BOS-LNP) obtained through centrifugation was further treated to lyophilization to obtain a powder that flows freely. The freeze-drying process was conducted using the FreeZone Triad benchtop freeze dryer manufactured by Labconco, USA. In summary, BOS-LNPs was dispersed in a 20%w/v aqueous solution of sucrose: trehalose (1:1 ratio) and blended by stirring until a homogeneous dispersion was achieved. The combination was thereafter subjected to pre-freezing at a temperature of −80°C for a duration of 12 hours. It was then vacuum dried from −40°C to 5°C for a period of 16 hours at a pressure of 0.154 mbar. Following this, the temperature was gradually increased to 20°C over a span of 8 hours in order to remove any remaining moisture. The temperature of the ramp was maintained at a constant value of 0.20°C. Particle size (PS), polydispersity index (PDI), and zeta potential (ZP) of the nanoparticles were determined using Malvern Nano ZS (Malverns instrument Ltd., UK). The determination of % entrapment efficiency (%EE) and % drug loading was conducted using an analytical approach based on HPLC, as previously reported [17,18].
Systematic formulation optimization using design of experiments
Quality target product profile (QTPP)
The first stage of quality by design (QbD) involves determining the QTPP based on prior knowledge followed by identifying the critical material attributes (CMAs), critical formulation variables (CFVs) critical process parameters (CPPs), and finally deriving the critical quality attributes (CQAs). To derive QTPP, several factors like lipid concentration, surfactant concentration, and responses like PS, PDI, ZP, and %EE were considered. By utilizing these variables, the optimal multidimensional design space, as determined by method factors, could be traversed. This was achieved through a choice of optimal process parameters and assessment of quality characteristics. The QTPP for BOS-LNPs is described in Table 1 [19–21].
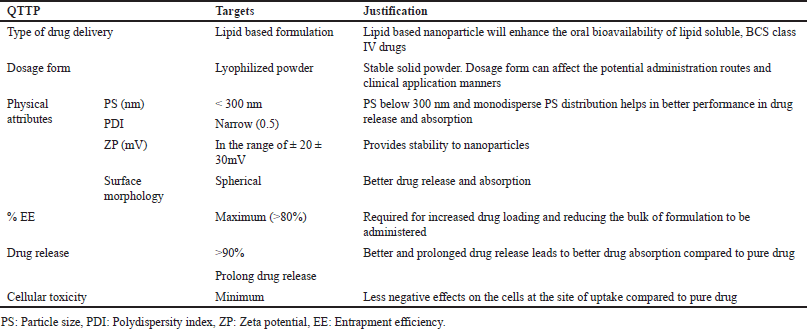 | Table 1. QTPPs for developing BOS-loaded LNPs formulations. [Click here to view] |
Critical quality attributes
The QTPP identifies a CQA based on the severity of harm if the product falls outside the permitted range for that attribute. The quality attributes of BOS-LNPs which are likely to be impacted by the influence of CMAs, CFVs, and CPPs are considered as drug product CQAs. The CQAs selected for this particular context include PS, drug (% EE), PDI, ZP (mV), and drug release (%) [19–21]. The selected CQAs for developing BOS-loaded LNPs are given in Table 2.
 | Table 2. Selected CQAs for developing BOS-loaded LNPs. [Click here to view] |
Screening of lipids and surfactants for the formulation development
In accordance with the equilibrium solubility studies, four lipids Precirol, Compritol, GMS, and Stearic acid were selected for screening. In consideration of prior research concerning LNPs, the concentration of solid lipids was determined to fall within the range of 0.5% to 3.5% w/v (10–70 mg) [22,23]. Precirol demonstrated nanosized particle dimensions, an enhanced PDI, favorable ZP, and superior drug EE compared to other lipids. This performance may be attributed to its low HLB value of 2, indicating a high degree of hydrophobicity among various fatty acids and a loose structural configuration that facilitates improved drug entrapment [22]. Similarly, nonionic and amphiphilic surfactants were chosen owing to their excellent wetting, surface tension-reducing properties, and effective stabilization properties. A review of various published studies led to the selection of four distinct surfactantsTween-80, Poloxamer 188, TPGS, and Gelucire 48/16, each exhibiting different HLB values within a standard concentration range of 0.5% to 2% w/v for screening purposes [24,25]. Among these, Poloxamer 188 demonstrated superior nanosized particle dimensions (nm) and a more favorable PDI compared to the other surfactants. The type and concentration range of lipid and surfactant were determined by performing a series of one factor at a time (OFAT) experiments. For lipid and surfactants, the experiment details are described in Tables 3 and 4, respectively. Poloxamer 188 is a block of co polymers having both hydrophilic (Poly ethylene oxide/PEO) and hydrophobic (Polypropylene oxide/PPO) components which facilitate useful association and adsorption characteristics with LNPs [25,26]. In conclusion, precirol was chosen as the lipid and poloxamer 188 as the surfactant from the four options evaluated. The selected lipid and surfactant have a pronounced effect on the PS and drug EE of the formulations, which is why they were identified as the dependent and independent variables for the subsequent systematic optimization of BOS LNPs [15,26].
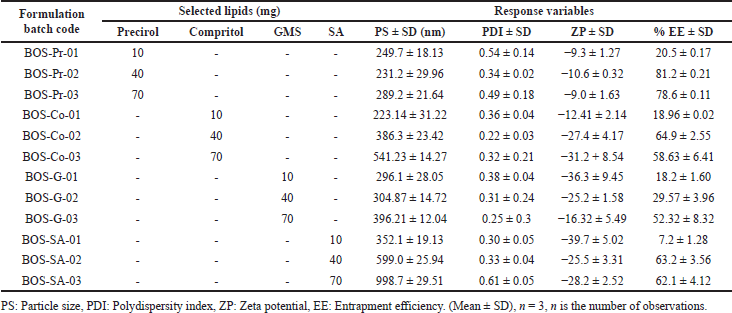 | Table 3. Preliminary BOS-loaded LNPs formulations based on the type of selected lipids and their obtained PS, PDI, ZP, and EE. [Click here to view] |
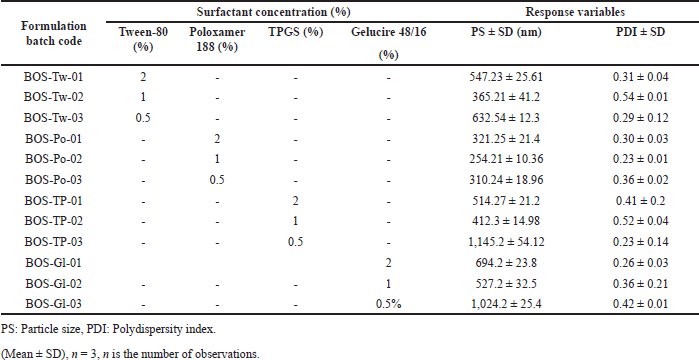 | Table 4. Preliminary BOS-loaded LNPs formulations based on type of selected surfactants and their obtained PS, and PDI. [Click here to view] |
Optimization of formulations using central composite design
The formulations were optimized utilizing a two factor, two-level balanced factorial (CCD) response surface methodology under QbD principles. The experimental trials were conducted using design expert ver. 13 software (Stat-Ease, Minneapolis, MN). The chosen independent variables (factors) were precirol concentration (ml) (X1) and poloxamer 188 (%) (X2) upon the dependent variable (response) PS (nm) (Y1) and % EE (Y2). The process parameters like homogenization speed and sonication time were kept constant. A two factor with two levels (−1 and +1) was constructed to estimate the significant consequence of these variables upon the obtained responses. Additional rigorous quality evaluations (CQAs) were carried out to facilitate analysis. Five consecutive cumulative replicates of the reference trial were conducted, establishing a total of 13 trial formulations. The concentrations of precirol (X1) and poloxamer 188 (X2) are chosen as CFVs while maintaining the pure drug concentration (BOS in mg) constant. The formulation compositions of BOS LNPs were identified with dependent and independent variables, as outlined in Table 5. Similarly, Table 6 exhibits the encoded 13 formulations elucidating factor response co-relationship with dependent and independent variables [27,28].
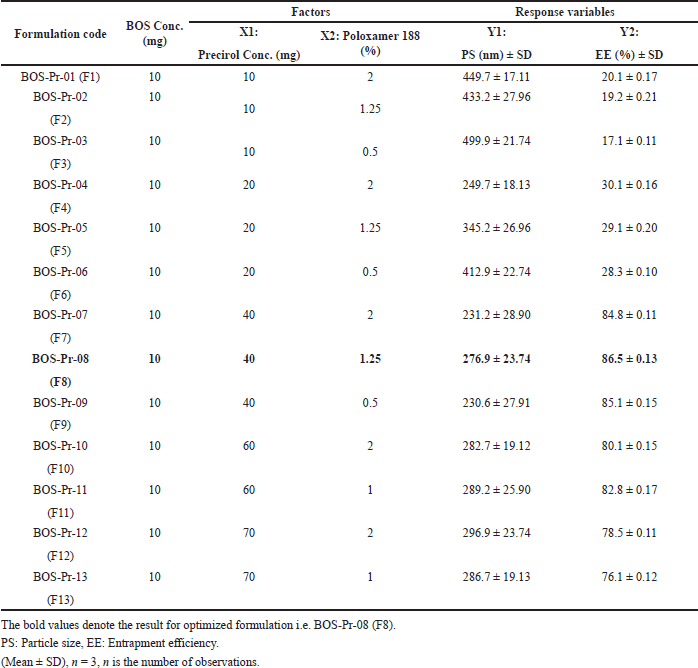 | Table 5. Formulation compositions of BOS-loaded LNPs with identified dependent and independent variables. [Click here to view] |
Incorporation of analysis of variance (ANOVA) for quadratic model and result analysis
Table 5 denotes the standard coded parameters of critical factors chosen for the application. ANOVA values, p-value (<0.05), f-value, and lack of fit indicate the significance of the model. For response 1 (PS), the obtained F-value of 7.61 indicates that the model exhibits statistical significance. The probability of observing an F-value of this magnitude due to noise is only 0.95%. Model terms are considered significant when their p-values are less than 0.05. A and A² are important model terms in this scenario. Model terms with values exceeding 0.10 are considered to be statistically insignificant. Model reduction can improve a model by removing inconsequential terms, excluding those necessary for hierarchical stability. The F-value of 6,078.15 indicates that the lack of fit is statistically significant. The probability of a lack of Fit F-value of this magnitude occurring due to noise is only 0.01%. Similarly, for response 2 (% EE), the Model F-value of 13.64 indicates that the model is statistically significant. The occurrence of an F-value of this magnitude due to noise is estimated to have a probability of only 0.17%. p-values below 0.05 imply that the model terms are statistically significant. The F-value for lack of Fit is 25,103.35, indicating that it is significant. There is only a 0.01% possibility that a significant lack of Fit F-value could be caused by noise [21,27,28]. In this context, solution 2 out of 7 trials (Table 6) and as per design indicating formulation trial 8 (Table 5) are considered as an optimized trial as all values coincide and the desirability is found to be 1 which signifies the optimal solution. The graphical representations depicting the outcomes of 2D and 3D response surface plots are shown in Figure 2a–d. Similarly, the predicted versus actual values with interaction effects elucidating perturbation analysis are illustrated in Figure 3a–d, respectively. The schematic diagram elucidating numerical and bar graphs for CQAs or dependent variables are depicted in Figure 4a–d, respectively. Similarly, the results of optimized formulations elucidating factors and their responses to significant models are demonstrated in graphical optimization depicted in Figure 5. The subsequent diagram demonstrates the final quadratic equations 3 and 4 describing the observed responses (Percentage of total drug content and percentage of drug EE) with regard to coded factors:
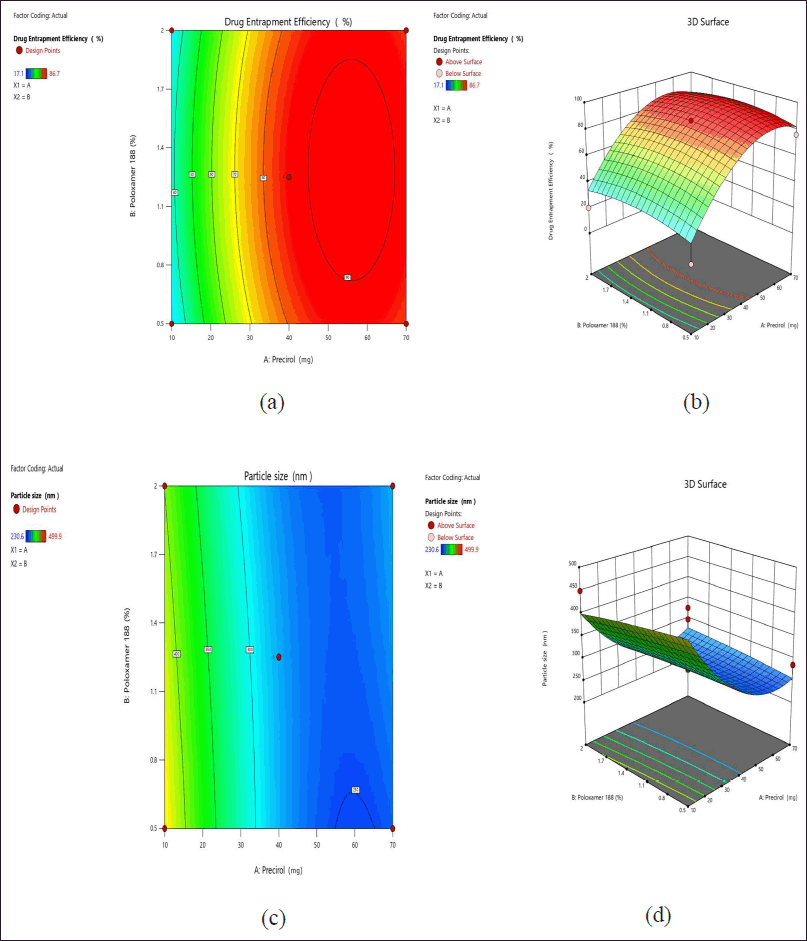 | Figure 2. Schematic representation of 2D contour plots (a and c) and 3D surface response plots (b and d) for the selected independent factors on the desired responses on drug EE (%) and PS (nm). [Click here to view] |
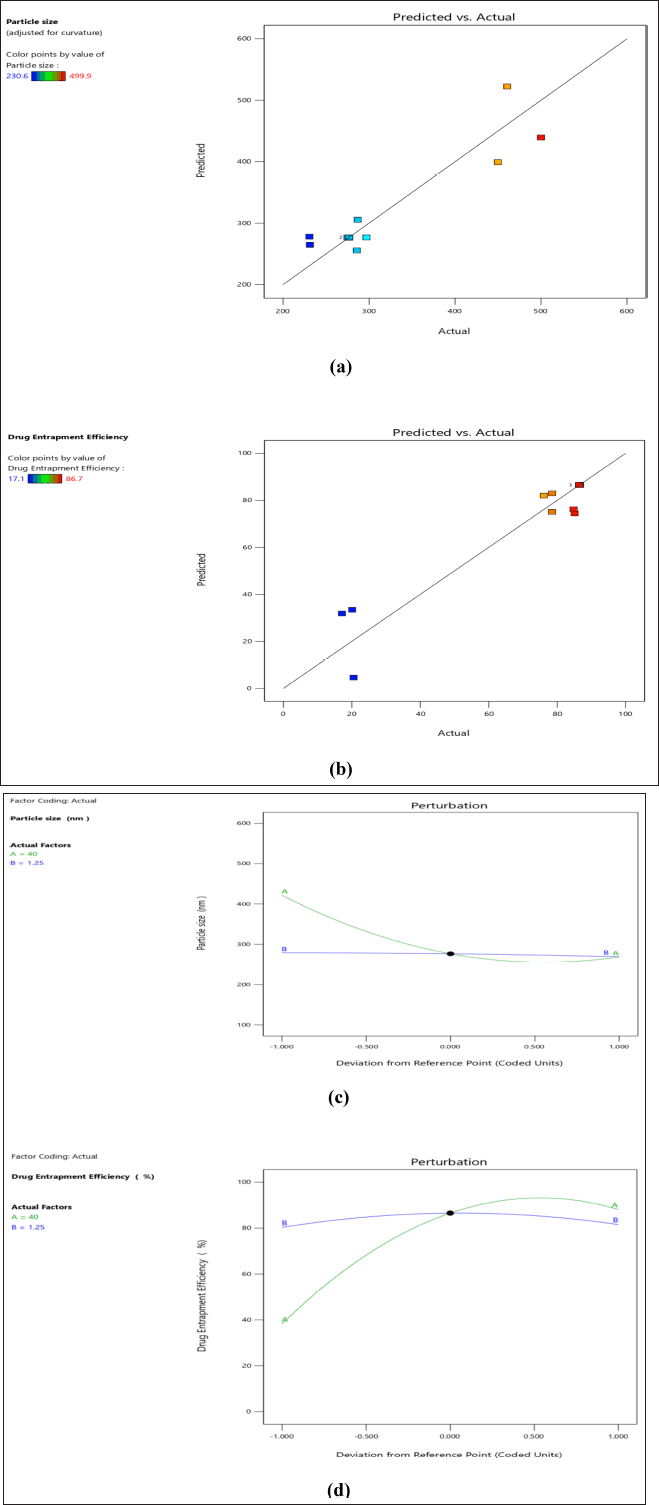 | Figure 3. Schematic representation of predicted versus actual values for PS (a) and for % EE (b), perturbation plots for PS (c) and for %EE (d). [Click here to view] |
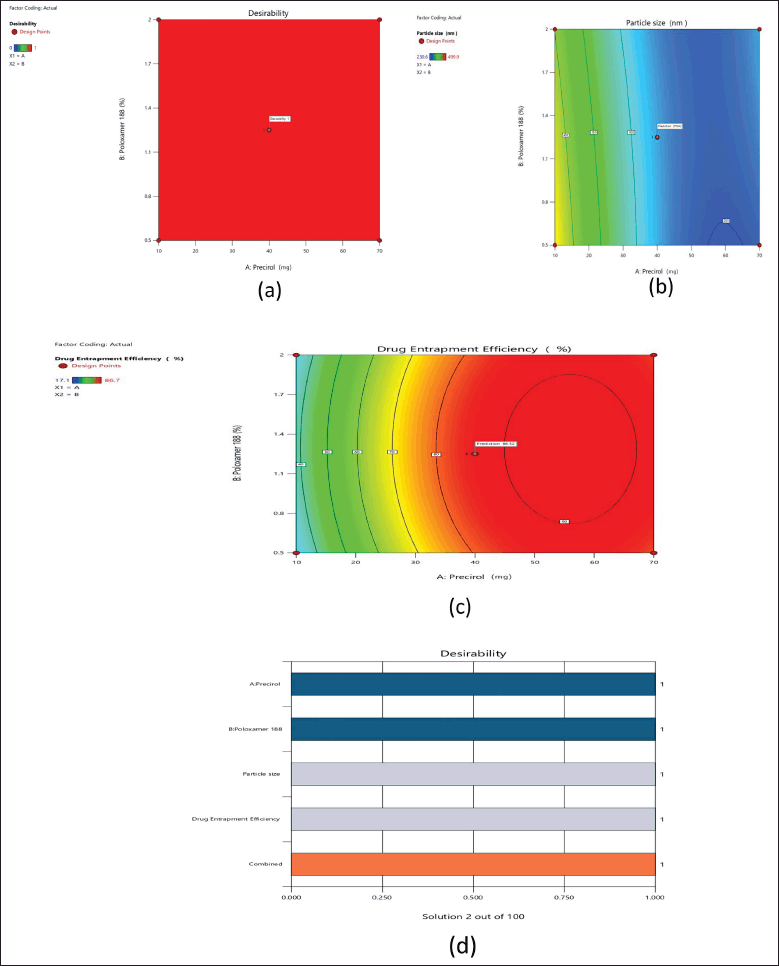 | Figure 4. Schematic illustration of desirability value (a), predicted desirability value of PS (b), predicted desirability value of % drug EE (c), and bar graph of the selected responses (d). [Click here to view] |
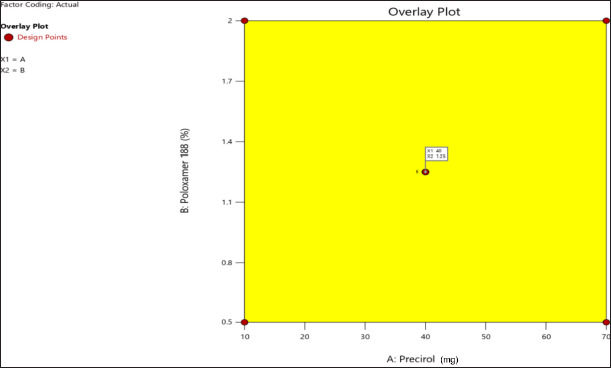 | Figure 5. Overlay plot of factors and response using graphical optimization. [Click here to view] |
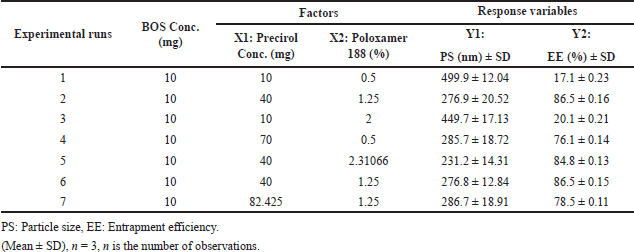 | Table 6. Central composite design matrix of BOS loaded LNPs. [Click here to view] |
Response 1:
PS = +276.42 -76.62A -4.77B +15.35AB +68.81A2 -2.57B2 (3)
Similarly, for response 2:
From the results of response surface plots, perturbation and interaction effects of poloxamer 188 and precirol are proven to be identified as an influential variable or factor which causes a significant effect on the responses of PS and drug EE. From the results of the design matrix (CCD), BOS-Pr-08 has been found as an optimized formulation as the predicted and actual values are coincides as per graph (Fig. 4). The analysis of the designs indicates that the applied model is deemed significant based on the observed responses, as evidenced by the predicted R2 value of 0.8446 and the adjusted R² value of 0.7336. The predicted R² value of 0.7336 demonstrates a reasonable level of agreement with the adjusted R² value of 0.8446, but the overall mean can be a better predictor for the model. In a similar manner, in relation to response 2, the predicted R² value of 0.3382 exhibits a reasonable agreement and bit closure as that of the adjusted R² value of 0.8405. The optimized formulation F8, obtained from experimental run 2, was chosen based on graphical and numerical optimizations (Figs. 4 and 5) conducted using point prediction and confirmation statistics. The chosen essential components have been proven to be sufficient and significant for effectively navigating the design domain.
Response surface analysis of 2D and 3D plots
Interaction of factor X1 (Concentration of precirol) on the responses (PS in nm and EE in %)
Contour plots (2D and 3D) show that increasing precirol concentration reduces PS, and after optimal concentration, PS slightly getting increases and the drug EE remains constant. However, the optimized formulation of precirol 40% and poloxamer 1.25% was chosen for graphical illustration due to the highest drug % EE results of 86.5%, allowing for significant counter plot interpretations and also sufficient to navigate the design space.
Interaction of factor X2 (Concentration of poloxamer 188) on the responses (PS in nm and % EE)
It was observed from 2D and 3D plots that Poloxamer. 188 with 40% precirol concentrations had a higher proportion of drug% EE and smaller PS than other formulations. The parameters listed above can be used to navigate the design space and fit the model as significant during counter plot interpretations.
Pre-formulation study
Screening of lipids and surfactant
Based on the equilibrium solubility study, four lipids Precirol, Compritol, GMS, and Stearic acid were chosen for screening experiments. In preliminary trials, four different lipids within the range of 0.5%–3.5% w/v (10–70 mg) were evaluated for BOS LNPs, and the appropriate lipid and its concentration range were selected for further processing based on the responses (PS, PDI, ZP, and EE). Stabilizers or surfactants are also indispensable for producing stable nanosized formulations. Therefore, four types of surfactants were also considered for screening study. Because of the absence of a definitive method for stabilizer selection, OFAT experimental approach was adopted, wherein various stabilizers within the range of 0.5%–2% w/v were evaluated through trial and error. The selection of lipids and stabilizers was accomplished through the observed PS and PDI [22–24].
Screening of cryoprotectants
Various cryoprotectants required for stabilization, including trehalose, sucrose, PEG, and PVP were screened for lyophilization of BOS-LNPs. Briefly, the product obtained after ultracentrifugation of BOS-LNPs were redispersed in an aqueous solution (20%w/v) of the above-stated cryoprotectant and freeze-dried using FreeZone Triad Benchtop Freeze Dryer (Labconco, USA) [29,30].
Characterization of drug-loaded lipid-based nanoparticles
PS, ZP, and PDI
The prepared BOS-LNPs are analyzed using Malvern Nano ZS (Malverns instrument Ltd., UK) to determine PS, ZP, PDI, and so on. The centrifuged nanoparticles are redispersed in milli-Q. The redispersed nanoparticles are diluted using milli-Q and analyzed. The PS for BOS LNPs was targeted to achieve below 300 nm. ZP value demonstrates the steadiness of nanoparticle molecules. PDI below 0.5 demonstrates the narrow dispersibility and homogeneity of the sample [17,21].
Field-emission scanning electron microscopy (SEM) of BOS and BOS LNPs
Morphological phenomena, such as aggregation and surface sphericity were examined using SEM images. The surface texture or appearance of pure drug and optimized formulation of BOS-LNPs are studied by SEM. Nanoparticles were applied onto carbon tape connected to a metal stub after centrifugation. Subsequently, the tape was coated with gold using a quorum technologies Q150TES sputter coater, manufactured in East Sussex, England [17].
In vitro drug release study
Release media
In vitro drug release study intends to assess the drug release from the prepared BOS-NLP compared to pure BOS. The dialysis bag diffusion technique was followed to assess the drug release. 10 mM phosphate buffer saline (PBS) solution of 7.4 pH was selected as a release media and the composition of the release media is given in Table 7. The pre-treated dialysis membrane was knotted at one end, and pure drug suspension equivalent to 5 mg of BOS (6 units) and BOS-LNPs (6 units) equivalent to 5 mg of BOS were each added prior to closing the other end of the membrane to form a drug-containing pouch or packet. At predefined time periods, 500 μl of the sample was removed and replaced with an equal amount of PBS. The amount of BOS released from the aliquots listed above was determined using HPLC analysis [17,21].
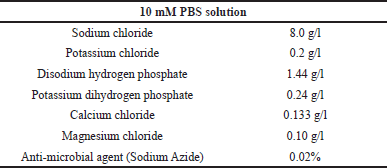 | Table 7. Composition of 10 mM PBS solution of 7.4 pH release media. [Click here to view] |
Cytotoxicity (%)
Cytotoxicity is a crucial biomarker for biological evaluation in vitro studies. The cytotoxicity of BOS and BOS-LNPs was assessed by employing the [(3-[4,5-dimethylthiazol-2-yl]-2,5 diphenyl tetrazolium bromide)] (MTT) assay on MCF-7 lines. MCF-7 cells were seeded at a density of 5 × 10⁴ cells per well in 100 μl of low glucose Dulbecco’s modified Eagle’s medium supplemented with 1% penicillin/streptomycin, 10% FBS, 2 mM glutamine, and 0.01 mg/ml insulin. The plates were inoculated with the medium for a duration of 24 hours at an incubator temperature of 37ºC and 5% carbon dioxide. Following the removal of the medium, the cells were subjected to a 24 hours incubation period with either free BOS or BOS-LNPs containing BS at various concentrations (2.5, 5, 10, 15, 30, 60, and 120 μg/ml). Following a 24 hours incubation period, the cells were rinsed with PBS and the supernatant was withdrawn. Following treatment with 100 μl of MTT reagent (500 mg/ml), the cells were incubated for 4 hours at 37oC and 5% CO2 in an incubator. After 4 hours of incubation, the MTT reagent was discarded, followed by the addition of 100 l of DMSO and 2 hours of horizontal shaking to dissolve the formazan crystals.
The absorbance of the plate was subsequently assessed at 570 nm utilizing an Epoch Elisa plate reader (BioTek U.S., Winooskii). The percentage of viable cells was calculated utilizing equation 7 below, where the wells containing THP-1 cells without any treatment group were designated as the control (100 percent viable), and the wells containing cells with the same treatment as the sample were regarded as the blank wells, correspondingly [31].
Cellular uptake
As a surrogate, coumarin-6 (C6)-loaded LNPs were utilized in MCF-7 cell lines to investigate the time-dependent qualitative and quantitative cellular assimilation of nanoparticles. A 6-well cell culture plate was inoculated with 1 × 10⁵ cells per well at a density of 5% CO2 and 37ºC for a duration of 24 hours in an incubator [32,33].
RESULTS AND DISCUSSION
Formulation development and optimization
Experimental screening of lipids and surfactants
From the equilibrium solubility study Precirol, Compritol, GMS, and Stearic acid were proposed as potential lipid carriers for BOS LNPs. Precirol shows the highest solubility of BOS compared to other lipids. As observed from Table 3, among the chosen lipids, Precirol shows reduced PS (231–289 nm), narrow PDI (0.34–0.49), and highest % EE (81%). This may be attributed to better solubility of BOS in Precirol which invariably influences EE [22,23]. Likewise, the surfactant was selected based on its ability to yield reduced PS and narrow PDI. Among the four surfactants studied described in Table 4, it was observed that Poloxamer 188 has a prominent effect on PS and is also depicted by a reduced PS of about 300 nm along with narrow PDI (<0.5). The better PS and PDI obtained with Poloxamer 188 can be attributed to its high HLB value [28] which drives superior surface tension reduction properties and better stabilization by preventing agglomeration of newly produced nanoparticles [25]. Therefore, Precirol and Poloxamer 188 were selected as lipid carriers and surfactant/stabilizers, respectively, for BOS LNPs, and the suitable concentration for both was determined from the optimization studies. Due to the fact that the solvent evaporation method consists of multiple components, it is vital to focus on each variable to achieve consistent and desired results. Research was conducted to investigate several important material characteristics to ensure the reproducibility of the findings [17,21].
Effect of lipid content
According to previously published literature, a lipid concentration ranging from 0.5% to 3.5% was chosen for the OFAT trials involving various lipids. The experiments are outlined in Table 3. The OFAT study demonstrated that the lowest EE was found at a minimal lipid concentration of 0.5%. As the lipid concentration increased, the EE correspondingly improved, reaching a maximum of 81.2% ± 0.21%. This highest efficiency, along with a reduction in PS, was achieved with Precirol at a concentration of 2%, utilizing a high shear homogenizer at 10,000 rpm for a sonication time of 240 seconds. The high percentage of % EE can be rationalized by the significant defects found in the crystal lattice, which result in increased imperfections in Precirol. These imperfections allow for a greater entrapment of drug molecules, while an elevated lipid content may effectively inhibit the drug’s release into the external environment by enclosing the surfactant [22–24]. The decrease in PS accompanied by a narrow PDI can be elucidated by the effective homogenization process and the duration of sonication, in conjunction with adequate lipid and surfactant concentrations. However, an increase in the content of Precirol to 3.5% did not result in a notable enhancement of enca psulation efficiency (% EE) or a further decrease in PS. This lack of improvement may be attributed to the increased viscosity resulting from the increased lipid content, which adversely affects homogenization efficiency [24,34,35].
Effect of type and concentration of surfactants
Stearic stabilizers and electrostatic stabilizers are the two principal types of stabilizers that are utilized in the process of formulating LNPs. Among the types of surfactants studied, the nanoparticular system is stabilized by stearic stabilization provided by Poloxamer 188. Poloxamer 188, due to having both PEO and PPO components, adsorb both hydrophobic and hydrophilic surfaces and provides mechanical strength to LNPs. At suitable concentrations, Poloxamer 188 forms multiple layers on the surface of LNPs by adsorption to provide mechanical stability to nanoparticles. This ends up resulting in an increase in the electrostatic repulsion between the particles, which in turn prevents the particles from growing. There was an investigation into the impact that surfactant concentrations had on PS and PDI and the results are presented in Table 4. The obtained data suggests that above 1%, there was a slight increase both in PS (254.21 to 321.25 nm) and PDI (0.23 to 0.30), which indicated probable generation of micelles as evidenced by a greater number of particles in smaller sizes. Also, below 1%, the same observation of increased PDI (0.23 to 0.36) has been noted which may be due to the agglomeration of nanoparticles due to inadequate concentration of surface stabilizer. The formulations that were prepared using Poloxamer 188 had the smallest PS, and the PS decreased as the stabilizer concentration increased up to 1% which could be explained by the efficient stabilization of the nanoparticles by developing a stearic barrier on the nanoparticle surface and thereby preventing agglomeration. At low concentrations, the increase in PS can be explained by agglomeration of newly generated nanoparticles due to minimum stabilizer concentration, and at high concentrations, poloxamer 188 may get absorbed on the surface of nanoparticles giving rise to increased PS. Furthermore, the stabilization of the nanoparticles was not accomplished by other surfactants, most likely because they were unable to satisfy the requisite level of stability. This could be because of a difference in the amount of HLB that the lipid needed to have to become stabilized in the aqueous dispersion medium [25,36].
Optimization of LNPs
The optimized BOS LNPs formulation was determined based on the objective of attaining the maximum %EE and minimized PS with an acceptable PDI of <0.5 by applying a predictability approach using a central composite design by Design expert software. The data illustrated in Tables 5 and 6 indicate that with less than 2% of Precirol, the entrapment efficiency (% EE) was recorded to be below 30%. The presence of surfactants did not exhibit any significance when the lipid content in the composition was below 2%. Below 2% w/v (40 mg) lipid content, an additional increase in PS was observed, indicating an excessive generation of nuclei and a lack of sufficient stabilizer concentration to reduce PS to the optimal level. This resulted in an increased PS and PDI, which is indicative of increased instability. The study revealed that at 2% concentrations of Precirol and Poloxamer 188, within a range of 0.5% to 2%, the EE was approximately 85%. The maximum EE recorded was 86.5%, with a corresponding PS of 276.9 mm, achieved using 2% Precirol and 1.25% Poloxamer 188. This result can be elucidated by the effective emulsification of Precirol and the efficient homogenization process, which leads to optimal entrapment within the lipid core. Additionally, the decrease in PS may be linked to a reduction in interfacial tension between the aqueous and lipid phases, facilitating the formation of smaller emulsion droplets. There was no significant increase in EE noted when the lipid concentration was raised from 2% w/v (40 mg) to 3.5% w/v (70 mg). The PS remained unchanged, while the percentage of EE (% EE) was approximately 76%–78% at 3.5% Precirol, which is slightly lower than the % EE of around 85% observed with a lipid content of 2%, with the PS consistently below 300 nm. The reduction in % EE with the increase in lipid concentration may be attributed to the rise in viscosity within the system, which hampers effective homogenization and results in diminished entrapment. The sonication duration was established at 240 seconds (4 minutes) following preliminary experiments, as extending the sonication time could adversely affect EE by causing the internal phase to rupture, resulting in increased dispersion and dissolution of the drug in the external phase. Consequently, through optimization trials, ANOVA analysis, and the desirability index, it was concluded that optimal levels of lipid and surfactant are 2% w/v (40 mg) and 1.25% of Poloxamer 188, respectively, yielding a PS of 276.9 nm and a maximum EE of 86.5% [27,28,35,37].
In vitro characterizations study
Physicochemical properties
The LNPs that were synthesized were appropriately diluted by a factor of ten using Millipore water. The analysis was conducted at a temperature of 25°C using a Malvern zeta sizer. Based on the aforementioned data pertaining to PS, it can be inferred that LNPs synthesized using poloxamer 188 (1% v/v) exhibited the required PS characterized by a narrow PDI, as illustrated in Tables 3 and 4. Therefore, it was thought to be suitable for more analysis and assessment [17,21].
Morphological analysis
The pictures obtained by the SEM illustrate that the particles are round and almost the same size as those measured by the zeta-sizer analyzer. The surface topology and morphology of a wide range of materials can be studied with the help of SEM. The images of the plain drug and nanoformulations are shown in Figure 6. The drug was found to have an irregular shape with an average PS range of 3–6 μm (Fig. 6a) whereas the BOS-LNPs has transformed to spherical particles in the nanometric range as seen in Figure 6b–d displays the size distribution study and ZP, respectively, measured by Malvern Zeta sizer [17,21].
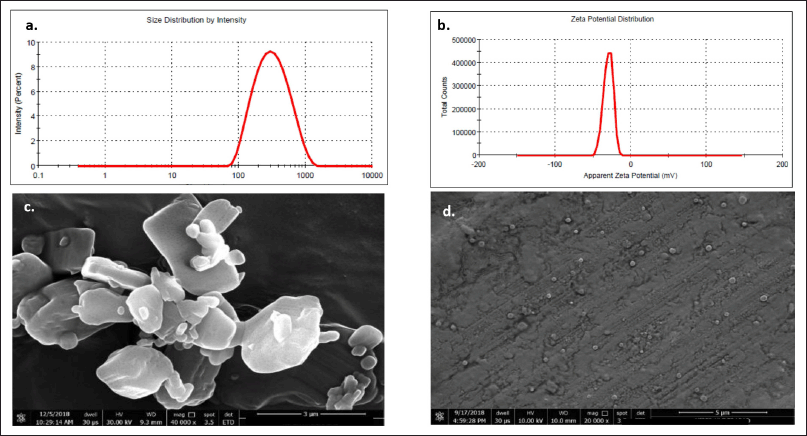 | Figure 6. The surface topology and morphology of a wide range of materials using SEM (a) Pure drug (b) LNPs (BOS LNP) (c) PS distribution of BOS LNPs by Malvern (d) ZP of BOS LNPs. [Click here to view] |
In-vitro drug release study
Due to strong hydrophobicity, BOS has limited solubility in different media. During the preliminary evaluation of dissolution media, it was noted that the inclusion of 0.5% SLS in a pH 7.4 PBS solution could enhance the release of the drug from both free BOS and BOS-LNPs. This effect is likely attributed to an increase in the wetting of the particles. Incomplete drug release of free BOS was detected after 60 hours from pure drug having PS of d (0.9)– 27 μm, the optimized BOS-LNPs exhibited a total drug release above 95%. The initial burst release observed may be attributed to the presence of an unentrapped surface drug during the formulation preparation process. The prolonged plateau seen may be attributed to the hydrophobic properties of lipidic nanoparticles F8 formulation (Fig. 7) [17,21].
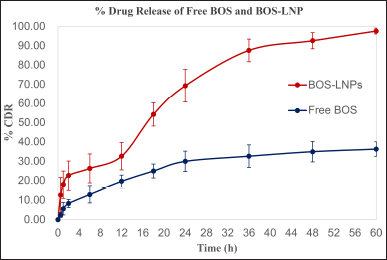 | Figure 7. Schematic representations of % drug release for free drug and drug loaded LNPs BOS LNPs (Time vs. % cumulative drug release). Mean ± SD, n = 3, n is the number of observations. [Click here to view] |
Lyophilization optimization
The variable Si represents the initial PS of the fresh batch of nanoparticles prior to the addition of cryoprotectant, while the variable Sf represents the PS of the lyophilized nanoparticles subsequent to the inclusion of cryoprotectant. The analysis of the Sf/Si ratio indicates that sucrose and trehalose exhibit smaller PSs. The sucrose and trehalose mixture were prepared in a 1:1 ratio, and the corresponding results are shown in Table 8 [29,30].
 | Table 8. Results indicating parameters involved in optimized cryoprotectant for lyophilization process. [Click here to view] |
Cytotoxicity and cellular uptake
The molecule BOS is categorized as a BCS class IV, signifying its limited ability to dissolve in water and its low permeability across biological membranes. The possible enhancement of cellular absorption by endocytosis and prevention of drug precipitation in the aqueous medium can be achieved by incorporating the drug into LNPs. The cytotoxicity of BOS was significantly increased as a result of its nano-sized nature and the inclusion of HLB to facilitate cell membrane crossing. Figure 8 demonstrates that drug-loaded nanoparticles exhibited a higher level of cytotoxicity compared to their free drug equivalents, even at the same concentration of BOS. The optimized BOS-LNPs demonstrated a significant reduction in cell viability (95%, 88%, 80%, 74%, 62%,48%, and 27% at 2.5, 5, 10, 15, 30, 60, and 120 μg/ml) compared to the pure BOS (96%, 88%, 82%, 78%, 74%, 68%, and 60% at t 2.5, 5, 10, 15, 30, 60, and 120 μg/m) as shown in Figure 8. IC50 (The half maximal inhibitory concentration) was calculated from the % cell viability (Y-axis) versus concentration (X-axis) graph. The R2 value for % cell viability is found to be 0.9924 and 0.9616 for pure BOS and BOS-LNPs, respectively, and reflecting the data can be best fit for the regression model. IC50 was observed to be 391 and 48 for pure BOS and BOS-LNPs, respectively. The developed BOS-LNPs with Preceriol as lipid and Poloxamer as a surfactant was found to be 8 times more potential than pure BOS. To investigate the internalization destiny of the suggested nanoparticle delivery, C6-loaded lipid-based nanoparticles were utilized as a substitute due to the absence of natural fluorescence in BOS. It was noted that as the exposure duration increased, the MCF-7 cells exhibited more fluorescence (Fig. 9), indicating the intended internalization of nanoparticles [38,39].
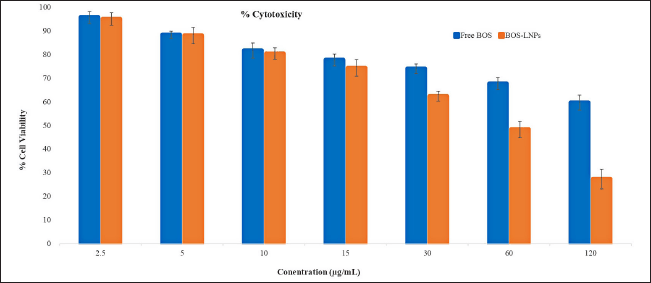 | Figure 8. Schematic representations elucidating cytotoxicity study of concentration with respect to cell viability of free drug and drug-loaded LNPs. Mean ± SD, n = 3, n is the number of observations. [Click here to view] |
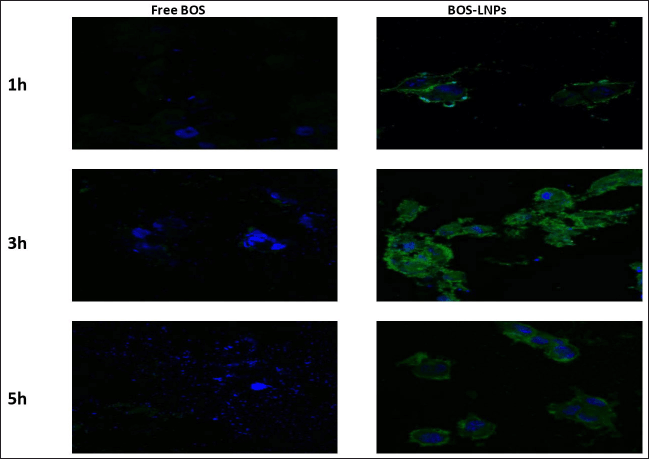 | Figure 9. MCF-7 cells exhibited more fluorescence in the case of BOS LNPs with respect to exposure time indicating the intended internalization of nanoparticles. [Click here to view] |
Comparison of BOS LNPs with other BOS formulations
Several studies have also investigated BOS SLNs and BOS Liposomes (LNPs). Below is a comparative table that outlines the key attributes of various BOS formulations in comparison to the current research of BOS-LNPs is shown in Table 9 [40–42].
 | Table 9. Comparative analysis of BOS-LNPs with other reported BOS formulations. [Click here to view] |
Baddela and Nirmala [41] prepared BOS-loaded solid lipid nanoparticles (BST-SLN) using the hot homogenization method with Dynasan 118. The BST-SLN formulation exhibited a PS of 150.73 nm, a PDI of 0.20, and a drug EE of 93.56%. In contrast, BOS-LNPs prepared using Precirol had a PS of 276.9 nm, a PDI of 0.32, and EE of 86.5%. Regarding drug release, BOS-LNPs prepared with Precirol demonstrated a controlled release profile, with 69.33% release at 24 hours and 92.67% at 48 hours, while BST-SLN showed a higher release at 24 hours (80.55%). In vitro cytotoxicity studies for BOS-LNPs were conducted using the MTT assay method. The results revealed an inhibition of 89% for BST-SLN as reported in the previous research [41], compared to 73% for BOS-LNPs as our current research study. An in vivo bioavailability study for BST-SLN demonstrated a two-fold increase in bioavailability, along with an extended residence time of BOS, when compared to BOS suspension [41]. Baddela and Nirmala [41] suggested that the increased residence time could be attributed to the sustained release behavior, as observed in the drug release study. Although an in vivo bioavailability study for BOS-LNPs was not conducted in our study [41], the in vitro drug release study showed an enhanced and controlled release up to 48 hours, indicating a likely improvement in bioavailability compared to the pure drug.
In another study, Singh et al. [42] prepared biotin-modified BOS liposomes (b-Bos-LPs), which exhibited a PS of 257.73 nm, an EE of 87.78%, and a drug release of 85.56% over 48 hours. In vitro experiments demonstrated that b-Bos-LPs significantly reduced cell viability in MCF-7 cells, outperforming pure BOS in terms of cytotoxicity [42]. Therefore, based on the cytotoxicity studies conducted on BOS-LNPs and supported by cited literature, BOS-LNPs is expected to offer significant advantages with improved cytotoxicity studies.
Storage stability of BOS LNPs
The stability study of BOS-LNPs was conducted in accordance with ICH guidelines both in accelerated conditions (40ºC/75% RH) and long-term conditions (25ºC/60% RH). The BOS-LNPs formulated with 2% Precirol and 1.5% Poloxamer 188 demonstrated commendable storage stability up to 3 months at both conditions. The optimized BOS-loaded LNPs batch was evaluated for PS, PDI, drug EE (%EE), and phase separation. Visual inspections were performed regularly to monitor any phase separation throughout the study period at 1, 2, and 3 months. The optimal formulation yielded PS, PDI, and % EE values 276.9, 0.32, and 86.5 nm, respectively. Notably, the optimal formulation did not exhibit any phase separation or precipitate formation after 3 months at 40ºC/75%RH and 25ºC/60%RH. The storage stability of the optimized formulation of BOS LNPs at 40ºC/75% RH and 25ºC/60% RH is shown in Table 10.
 | Table 10. Storage stability results of optimal formulation of BOS LNPs at 40ºC/75%RH and 25ºC/60% RH. [Click here to view] |
CONCLUSION
The central composite design allowed for the optimization of formulation development of BOS monohydrate-loaded LNPs to increase oral bioavailability. The first QTPPs and CQAs were identified and supported during the QbD process. An ANOVA analysis was conducted to determine the most beneficial model term. The lipid-based nanoparticles were optimized by selecting the upper and lower limits of particular CQAs. Ultimately, depending on how the technique is applied, using lipidic nanoparticles for BOS may result in the best formulation with possible benefits as per the objectives of the current research. Cytotoxicity studies of the optimized formulation have shown that it has more potential than the pure drug and remains stable after 3 months of storage at 40ºC/75% RH and 25ºC/60% RH.
LIST OF ABBREVIATIONS
2D, Two dimensional; 3D, Three dimensional; BOS, Bosutinib monohydrate; BOS-LNPs, Bosutinib monohydrate lipidic nanoparticles; DoE, Design of experiment; EE, Entrapment efficiency; FBS, Fetal bovine serum; OFAT, One factor at a time; PDI, Polydispersity index; PS, Particle Size; QbD, Quality by design; RSM, Response surface analysis, SEM, Scanning electron microscopy; TKIs, Tyrosine kinase inhibitors.
ACKNOWLEDGEMENTS
The aforementioned organizations provided an encouraging environment that enabled the writers to finish this study manuscript, and for that the authors are grateful.
AUTHORS CONTRIBUTION
All uthors made substantial contributions to conception and design, acquisition of data, or analysis and interpretation of data; took part in drafting the article or revising it critically for important intellectual content; agreed to submit to the current journal; gave final approval of the version to be published; and agree to be accountable for all aspects of the work. All the authors are eligible to be an author as per the International Committee of Medical Journal Editors (ICMJE) requirements/guidelines.
FINANCIAL SUPPORT
The authors declare that they have no known competing financial interests that could have appeared to influence the work reported in this paper. There was no any financial assistance received from any funding aegis.
CONFLICTS OF INTEREST
The authors report no financial or any other conflicts of interest in this work.
ETHICAL APPROVALS
This study does not involve experiments on animals or human subjects.
DATA AVAILABILITY
All data generated and analyzed are included in this research article.
PUBLISHER’S NOTE
All claims expressed in this article are solely those of the authors and do not necessarily represent those of the publisher, the editors, and the reviewers. This journal remains neutral with regard to jurisdictional claims in published institutional affiliations.
USE OF ARTIFICIAL INTELLIGENCE (AI)-ASSISTED TECHNOLOGY
The authors declare that they have not used artificial intelligence (AI)-tools for writing and editing the manuscript, and no images were manipulated using AI.
REFERENCES
1. Arber D, Orazi A. The updated WHO classification of hematological malignancies: the 2016 revision to the WHO classification of myeloid neoplasms and acute leukemia. Blood J. 2016;127:2391–405.
2. Ciaffaglione V, Consoli V, Intagliata S, Marrazzo A, Romeo G, Pittalà V, et al. Novel tyrosine kinase inhibitors to target chronic myeloid leukemia. Molecules. 2022;27(10):3220. doi: CrossRef
3. Hochhaus A, O’Brien SG, Guilhot F, Druker BJ, Branford S, Foroni L, et al. Six-year follow-up of patients receiving imatinib for the first-line treatment of chronic myeloid leukemia. Leukemia. 2009;23(6):1054–61. doi: CrossRef
4. Hochhaus A, Saglio G, Hughes TP, Larson RA, Kim DW, Issaragrisil S, et al. Long-term benefits and risks of frontline nilotinib vs. imatinib for chronic myeloid leukemia in chronic phase: 5-year update of the randomized ENESTnd trial. Leukemia. 2016;30:1044–54. doi: CrossRef
5. Maines MD, Gibbs PE. 30 some years of heme oxygenase: from a “molecular wrecking ball” to a “mesmerizing” trigger of cellular events. Biochem Biophys Res Commun. 2005;338:568–77. doi: CrossRef
6. Chiang SK, Chen SE, Chang LC. A dual role of heme oxygenase-1 in cancer cells. Int J Mol Sci. 2018;20:39. doi: CrossRef
7. Salerno L, Pittala V, Romeo G, Modica MN, Siracusa MA, Di Giacomo C, et al. Evaluation of novel aryloxyalkyl derivatives of imidazole and 1,2,4-triazole as heme oxygenase-1 (HO-1) inhibitors and their antitumor properties. Bioorg Med Chem. 2013;21:5145–53.
8. Tefferi A, Dewald GW, Litzow ML, Cortes J, Mauro MJ, Talpaz M, et al. Chronic myeloid leukemia: current application of cytogenetics and molecular testing for diagnosis and treatment. Mayo Clin Proc. 2005;80(3):390–402. doi: CrossRef
9. Chelysheva EI, Turkina AG, Misiurin AV, Aksenova EV, Domracheva EV, Zakharova AV, et al. Monitoring of minimal residual disease in patients with chronic myeloleukemia: clinical value of real-time polymerase chain reaction. Ter Arkh. 2007;79(4):49–53.
10. https://www.accessdata.fda.gov/drugsatfda_docs/nda/2012/203341orig1s000clinpharmr.pdf. Clinical pharmacology and biopharmaceutics review(s)_ BosulifTM
11. Abbas R, Hsyu PH. Clinical pharmacokinetics and pharmacodynamics of bosutinib. Clin Pharmacokinet. 2016;55:1191–204. doi: CrossRef
12. Bayón-Cordero L, Alkorta I, Arana L. Application of solid lipid nanoparticles to improve the efficiency of anticancer drugs. Nanomaterials. 2019;9:474. doi: CrossRef
13. Shirisha V, Parasuraman R, Poojitha M, Gayathri R, Mounika P, Bheemaji M. Development and validation of bosutinib by using UV-spectrophotometric method in bulk form. Int J Pharm Sci. 2024;2(5):1544–50.
14. Stat-ease. Design-Expert® Software Version 12 - Stat-Ease [Internet]. 2019. Available from: https://www.statease.com/software/design-expert/
15. Ekambaram P, Abdul HS. Formulation and evaluation of solid lipid nanoparticles of ramipril. J Young Pharm. 2011;3(3):216–20. doi: CrossRef
16. Kova?evi? AB, Müller RH, Keck CM. Formulation development of lipid nanoparticles: improved lipid screening and development of tacrolimus loaded nanostructured lipid carriers (NLC). Int J Pharm. 2020;576:118918
17. Koduru TS, Gadela VR, Sruthi P, Priya V. Solid lipid nanoparticles: preparation techniques, their characterization, and an update on recent studies. J Applied Pharm Sci. 2020;10(06):26–141.
18. Ghose D, Patra CN, Kumar BV, Swain S, Jena BR, Choudhury P, et al. QbD-based formulation optimization and characterization of polymeric nanoparticles of cinacalcet hydrochloride with improved biopharmaceutical attributes. Turk J Pharm Sci. 2021;18(4):452–64.
19. Roy S. Quality by design: a holistic concept of building quality in pharmaceuticals. Int J Pharm Biomed Res. 2012;3(2):100–8.
20. Soni G, Kale K, Shetty S, Gupta MK, Yadav KS. Quality by design (QbD) approach in processing polymeric nanoparticles loading anticancer drugs by high pressure homogenizer. Heliyon. 2020;6:e03846. doi: CrossRef
21. Veni DK, Gupta NV. Quality by design approach in the development of solid lipid nanoparticles of linagliptin. Res J Pharm Tech. 2019;12(9):4454–62. doi: CrossRef
22. Soni K, Rizwanullah M, Kohli K. Development and optimization of sulforaphane-loaded nanostructured lipid carriers by the Box-Behnken design for improved oral efficacy against cancer: in vitro, ex vivo and in vivo assessments. Artif Cells Nanomed Biotechnol. 2017;1–17:15–31. doi: CrossRef
23. Rahman F, Hendradi E, Purwanti T. Lipids selection and methods of nanostructured lipid carrier for topical use. Int J Drug Deliv Technol. 2024;14(3):1880–9.
24. Sakellari GI, Zafeiri I, Batchelor H, Spyropoulos F. Formulation design, production and characterisation of solid lipid nanoparticles (SLN) and nanostructured lipid carriers (NLC) for the encapsulation of a model hydrophobic active. Food Hydrocoll Health. 2021;1:100024. doi: CrossRef
25. Yan F, Zhang C, Zheng Y, Mei L, Tang L, Song C, et al. The effect of poloxamer 188 on nanoparticle morphology, size, cancer cell uptake, and cytotoxicity. Nanomed Nanotechnol Biol Med. 2010;6(1):170–8. doi: CrossRef
26. An?elka BK, Rainer HM, Cornelia MK. Formulation development of lipid nanoparticles: improved lipid screening and development of tacrolimus loaded nanostructured lipid carriers (NLC). Int J Pharm. 2020;576:118918.
27. Bezerra MA, Santelli RE, Oliveira EP, Villar ELSLA. Response surface methodology (RSM) as a tool for optimization in analytical chemistry. Talanta. 2008;76:965–77. doi: CrossRef
28. Jena BR, Panda SP, Umasankar K, Swain S, Koteswara Rao GS, Damayanthi D, et al. Applications of QbD-based software’s in analytical research and development. Curr Pharm Anal. 2021;17(4):461–73.
29. Amis TM, Renukuntla J, Bolla PK, Clark BA. Selection of cryoprotectant in lyophilization of progesterone-loaded stearic acid solid lipid nanoparticles. Pharmaceutics. 2020;12:892. doi: CrossRef
30. Kimberley E, Sofie VH, René H, Filip K. Optimization of the different phases of the freeze-drying process of solid lipid nanoparticles using experimental designs. Int J Pharm. 2023;635:122717.
31. Aslantürk OS. In vitro cytotoxicity and cell viability assays: principles, advantages, and disadvantages. Genotoxicity—a predictable risk to our actual World. London, UK: IntechOpen Limited; 2018; doi:10.5772/intechopen.71923
32. Robin A, Anwarul H, Rosita P, Rudilyn JW, Avnesh ST, Bhavesh DK. Cellular uptake and retention of nanoparticles: insights on particle properties and interaction with cellular components. Mater Today Commun. 2020;25:101692.
33. Magdalena M, Lena R, Svetlana SA, Bernhard KK, Maciej J, Andrei RT. Analytical methodology for studying cellular uptake, processing and localization of gold nanoparticles. Anal Chim Acta. 2018;1052:1–9. doi: CrossRef
34. Gardouh A, Sayed S, Ghorab M, Abdel-Rahman S. Preparation and characterization of solid lipid micro/nanoparticles, effect of lipid concentration, surfactant type and concentration on physical characteristics of solid lipid micro/nanoparticles. Zagazig J Pharm Sci. 2010;2:1–4.
35. Ali A, Madni A, Shah H, Jamshaid T, Jan N, Khan S, et al. Solid lipid-based nanoparticulate system for sustained release and enhanced in-vitro cytotoxic effect of 5-fluorouracil on skin melanoma and squamous cell carcinoma. PLoS One. 2023;18(2):e0281004. doi: CrossRef
36. Bhalekar M, Upadhaya P, Madgulkar A. Formulation and characterization of solid lipid nanoparticles for a