INTRODUCTION
Breast cancer has overtaken lung cancer as the world’s most prevalent newly diagnosed cancer. Data from the World Health Organization’s International Agency for Research on Cancer in November 2020 revealed 2.26 million new cases diagnosed globally in 2020 [1]. Though predominantly affecting women, breast cancer also presents a significant challenge with a substantial portion of patients diagnosed with metastatic disease characterized by the over expression of Human Epidermal Growth factor receptor 2 (HER2). A significant concern in HER2-positive metastatic breast cancer is the high risk of brain metastases, affecting up to 50% of patients and significantly reducing their survival rate [2]. Despite advancements in systemic therapies for breast cancer, including novel drugs, their effectiveness against brain metastases remains limited compared to non-brain tumors. This critical immense medical need underscores the ongoing challenge of breast cancer with brain involvement, where recent breakthroughs have been scarce. This scarcity of effective treatment options translates to limited survival rates, necessitating the development of more potent strategies [3]. Tucatinib, a powerful and selective drug targeting HER2 and a selective tyrosine kinase inhibitor (TKI), holds promise for treating brain metastases in HER2-positive breast cancer. This small-molecule drug, taken orally for convenient administration, can potentially cross the blood-brain barrier, delivering therapy directly to these tumors [4]. Unlike other TKIs, Tucatinib selectively targets only HER2. This high selectivity means it has minimal effect on a related protein-related epidermal growth factor receptor (EGFR). This could potentially lead to fewer side effects typically caused by blocking EGFR [4]. Tucatinib exhibits exceptional selectivity for HER2, demonstrating 28- to 88-fold greater potency against HER2 compared to EGFR and 92- to 105-fold greater potency against HER2 compared to HER4. The US Food and Drug Administration (FDA) first approved Tucatinib on April 17, 2020, following positive clinical trial results [5,6].
Tucatinib (Fig. 1), a small molecule drug, possesses a unique chemical structure: N6-(4,5-dihydro-4,4-dimethyl-2-oxazolyl)-N4-[3-methyl-4-([1,2,4]triazolo[1,5-a]pyridin-7-yloxy)phenyl]-4,6-quinazolinediamine. It is a yellow crystalline powder and classified as (BCS) Class II drug.
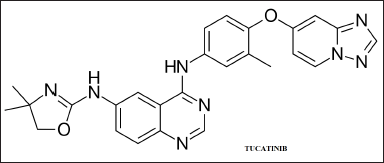 | Figure 1. Chemical structures of Tucatinib. [Click here to view] |
This classification signifies high permeability of Tucatinib across cell membranes, but limited solubility in water. Notably, Tucatinib’s solubility is highly dependent on pH, exhibiting very low solubility in acidic environments (below pH 4.0) and significantly increased solubility in more basic environments (above pH 4.0). Importantly, Tucatinib exists as a single form, lacking stereoisomerism.
Preclinical studies in mice and rats revealed a non-linear relationship between Tucatinib dosage and observed drug concentration over time. This suggests a potential for drug accumulation within the body at higher doses. Additionally, these studies found minimal to no differences in pharmacokinetics between male and female animals [7]. The non-linear pharmacokinetic profile and similar elimination half-life (t½) were observed consistently across all three species studied. Tucatinib undergoes extensive metabolism, primarily through oxidative pathways. A metabolite known as ONT-993 was the most prominent of all studied species. Interestingly, the rate of metabolism (MR) appeared comparable across these animals.
A review of the literature revealed a lack of validated methods for quantifying Tucatinib in biological matrices using LC-MS/MS. While a method for Tucatinib analysis with quercetin using UPLC-MS/MS was described by Zhang et al. [8], it was not fully validated.
Similarly, the method reported by Neeharika et al. [9]. suffered from limitations in sensitivity and long run times, hindering high-throughput analysis.
In this study an LC-MS/MS method to quantify Tucatinib in rat plasmafor therapeutic drug monitoring and pharmacokinetic studies have been studied [10,11].To detect Tucatinib in rat plasma samples, this work describes a method that employs protein precipitation for sample cleanup. The isolated Tucatinib is then analyzed using liquid chromatography with electrospray ionization (ESI)-tandem mass spectrometry (LC-MS/MS). The method involves a short run time, a wider linear range, enhanced sensitivity, and adheres to USFDA guidelines [12].
EXPERIMENTAL
Chemicals and solvents
Tucatinib was purchased from Beijing Mesochem Technology Co., Ltd, Mainland, China, and Sigma-Aldrich, Hyderabad, India, respectively. Imatinib [internal standard (IS)], Formic acid acetonitrile, dimethyl sulfoxide (HPLC grade) were purchased from Sigma-Aldrich, Bombay, India, Milli-Q water (TOC ≤ 40 ppb and 20mΩ ) was supplied by Millipore, Bangalore, India and rat plasma-free of the drug was purchased from Biochemed, Winchester, USA).
Chromatographic and mass spectrometric conditions
Chromatographic separation
For the separation of Tucatinib and its IS (Imatinib), high-performance liquid chromatography (HPLC) was employed using a Waters Acquity UPLC system (Waters Corporation, Milford, USA). This system incorporates a binary solvent manager, sample manager, and column manager for handling of solvents and samples. A binary gradient mobile phase system was used for the LC-MS/MS analysis. Mobile phase A consisted of 0.1% formic acid in ultrapure water (Milli-Q water). Mobile phase B was a 50:50 (v/v) mixture of acetonitrile and methanol, each containing 0.1% formic acid. A gradient elution program, optimized for efficient separation of Tucatinib and Imatinib, was employed. While specific details are omitted here for brevity, the program can be provided upon request. The total chromatographic separation was completed within 1.5 minutes.
Mass spectrometry detection
For the detection of Tucatinib and the IS (Imatinib), a Waters XEVO TQ mass spectrometer (Waters Corporation, Milford, USA) was utilized. This instrument is equipped with a Z spray source, facilitating efficient ionization. To achieve high sensitivity for Positive ESI in multiple reaction monitoring (MRM) mode was chosen for the specific detection of Tucatinib and the IS. Nitrogen gas provided optimal performance by functioning as both the cone gas (flow rate: 50 l/hour) and desolvation gas (flow rate: 800 l/hour).
Calibration and QC sample preparation
Stock solutions of Tucatinib were prepared at 1 mg/ml in dimethyl sulfoxide (DMSO) and serially diluted using a mixture of 80% water and 20% acetonitrile to obtain working solutions ranging from 1 to 20,000 ng/ml.
A nine-point calibration curve was constructed by spiking drug-free rat plasma with Tucatinib working solutions to achieve concentrations ranging from 0.05 to 1000.00 ng/ml (0.05, 0.10, 0.50, 2.50, 10.00, 100.00, 400.00, 800.00, and 1000.00 ng/ml).
Quality control (QC) samples were prepared independently by spiking drug-free rat plasma with known quantities of Tucatinib powder. These QC samples covered a range of concentrations including:
High QC (HQC): 750 ng/ml
Mid QC (MQC): 375 ng/ml
Low QC (LQC): 0.150 ng/ml.
The lower limit of quantification QC (LLOQ QC): 0.050 ng/ml, representing the lowest concentration that can be reliably detected.
A separate concentrated IS solution of Imatinib (1 mg/ml) was prepared in DMSO. To achieve a working concentration of 500 ng/ml, the concentrated IS solution was further diluted using acetonitrile. After preparation, calibration standards, QC samples, and all other plasma samples were stored at −80°C for further analysis.
Sample preparation
Plasma protein precipitation for analyte isolation
To isolate Tucatinib and the IS from rat plasma samples, a protein precipitation method was utilized.
Sample thawing, acidification, and IS spiking
Calibration standards and QC samples, pre-warmed to room temperature from −70°C storage, were acidified with 5 µl of formic acid. Each sample was spiked with 5 microliters (µl) of the IS solution (500 ng/ml Imatinib) after thorough vortexing to ensure proper mixing.
Protein precipitation and centrifugation
Protein precipitation and centrifugation were used to extract Tucatinib and the IS from the samples. To achieve this, 200 µl of a 1:1 (v/v) acetonitrile: methanol solution was added to each sample, facilitating protein precipitation. Additionally, a blank sample was prepared to account for background noise during analysis. A blank sample, essential for background correction, was prepared by mimicking the composition of the other samples but excluding Tucatinib. It contained 100 µl drug-free rat plasma, 5 µl each of formic acid and acetonitrile, and 200 µl of the 1:1 (v/v) acetonitrile: methanol solution used for chromatography.
Sample processing for injection
All samples underwent brief vortexing for 10 minutes. Centrifugation was performed at 13,400 rpm for 20 minutes at 4°C using a refrigerated centrifuge to separate the protein pellet from the supernatant. The supernatant, containing the extracted analytes, was transferred from each sample vial to an HPLC vial suitable for injection. For analysis, 10 µl injections from each vial were introduced into the LC-MS/MS system.
Method validation
Validation of the bioanalytical method was performed following industry guidelines [12] to evaluate key performance parameters. This validation assessed several critical parameters:
Selectivity: The method’s ability to distinguish and quantify Tucatinib in the presence of potential interferences from rat plasma was assessed. Selectivity was assessed by comparing blank plasma chromatograms (hemolyzed, lipemic, and normal) spiked with Tucatinib at the lowest detectable concentration (LLOQ). Acceptable selectivity was achieved with minimal interference from plasma components at the respective retention times of both Tucatinib and the IS.
Linearity: The method’s linear response within a defined concentration range. Five independent calibration curves were constructed, each containing at least nine Tucatinib standards ranging from 0.05 to 1,000 ng/ml. This wide concentration range ensures the method can accurately measure Tucatinib across relevant levels. A weighted (1/x²) least squares linear regression analysis was applied to determine the linear relationship between the ratio of the peak areas for Tucatinib and the IS and the known concentrations of Tucatinib in the calibration standards. This analysis helps determine how well the measured response corresponds to increasing Tucatinib concentrations. Blank plasma samples (without Tucatinib) were analyzed alongside blank samples spiked with the IS. This ensures the absence of any peaks in the blank chromatograms that could interfere with Tucatinib detection at the expected retention time. Only blank and blank-plus-IS data were excluded when constructing calibration curves. The acceptance criteria for back-calculated concentrations from calibration curves were ±15% accuracy (except for LLOQ, where ±20% was acceptable).
Precision and Accuracy: Both within-day (intra-day) and between-day (inter-day) performance were evaluated. Intra-day performance was evaluated by analyzing two batches with calibration standards and six replicates per QC level on the same day. The validation included analyzing five independent batches of samples on separate days to evaluate consistency in both precision and accuracy. The method demonstrated good accuracy, with measured concentrations within 15% of expected values for all QC levels. At the LLOQ, a slightly wider range of ±20% was acceptable. Precision was also acceptable, with a coefficient of variation (CV) of ≤15% for all QC levels except the LLOQ (which was allowed ≤20% CV).
Recovery: The efficiency of Tucatinib extraction from rat plasma was determined using three QC levels (LQC, MQC, and HQC) with six replicates per level. This ensures the method’s effectiveness across a range of Tucatinib concentrations. Recovery was determined by comparing the peak area response of extracted Tucatinib in plasma samples to unextracted standards (Tucatinib spiked into blank plasma). This approach assumes 100% recovery in the unextracted samples. We assessed the IS recovery by comparing the average peak area of the IS in extracted QC samples to unextracted QC samples. Importantly, the method required precise and reproducible recovery of both Tucatinib and the IS across all QC levels, although the absolute recovery value itself did not necessarily need to be 100%.
Matrix Effect: To assess potential signal suppression or enhancement from the plasma matrix, the experiment employed post-extraction spiking. This technique involves adding the IS and Tucatinib standards to blank plasma samples, followed by protein precipitation and extraction. The peak area ratios of Tucatinib to the IS were then compared between these extracted samples and unextracted standards (neat solutions) at the same concentrations. Six replicates per QC level were analyzed using this method. The IS concentration was maintained at a constant 500 ng/ml throughout the experiment.
Dilution Integrity: This experiment assessed the method’s ability to produce reliable results (precision and accuracy) even when samples containing Tucatinib concentrations above the upper limit of quantification (ULOQ) are diluted. Samples exceeding the ULOQ were diluted two-fold and four-fold using blank plasma. The diluted samples were then analyzed in six replicates to evaluate how well the method performed at these higher concentrations.
Stability: The stability of Tucatinib was evaluated under various conditions to ensure reliable results. Stock solution stability was assessed by comparing the peak area response of Tucatinib in stored samples to freshly prepared ones, at both room temperature and refrigerated (2°C–8°C) conditions. Plasma sample stability was investigated across different scenarios: The method demonstrated the stability of Tucatinib in rat plasma under various conditions: up to 8 hours at room temperature, 24 hours in the auto-sampler after processing, three freeze-thaw cycles, and long-term storage for up to 60 days. These evaluations were performed at two QC levels with six replicates each. Tucatinib in plasma samples was considered stable if the measured concentrations fell within ±15% of expected values (accuracy) and showed minimal variation (precision, ±15% CV).
By thoroughly assessing these parameters, the validation process confirmed the method’s reliability, accuracy, and suitability for quantifying Tucatinib in rat plasma samples.
In vivo pharmacokinetic evaluation
The pharmacokinetics of Tucatinib were investigated in a study involving six male Sprague Dawley rats. Animals were allowed unrestricted access to water throughout the experiment but fasted overnight before dosing. The oral formulation of Tucatinib was precisely prepared using gravimetric dilution. To administer Tucatinib, the drug was precisely weighed and suspended in a 0.5% methylcellulose solution for oral gavage. Following an overnight fast, rats were administered a single oral gavage dose of Tucatinib. The dose was 5 mg/kg body weight, delivered in a liquid volume of 2 ml/kg. Blood samples were collected at predetermined time points to track Tucatinib levels in the bloodstream. These time points included pre-dose, and then at 0.25, 0.50, 1, 2, 4, 6, 8, 12, and 24 hours after dosing. Approximately 0.25 ml of blood was collected at each time point using retro-orbital bleeding. To prevent clotting, the blood was collected in pre-filled tubes containing potassium EDTA as an anticoagulant. Plasma was obtained from whole blood using a centrifugation process. This involved using a refrigerated centrifuge at 9,500 rpm for 6 minutes. The isolated samples were then stored at −90°C to be quantified by LC-MS/MS.
Method development and optimization
Mass spectrometry optimization for enhanced sensitivity and selectivity
To achieve optimal sensitivity and selectivity during the ionization process, positive ESI mode was chosen for Tucatinib analysis. To achieve high selectivity and sensitivity for Tucatinib detection, the method utilized MRM mode. During optimization, Tucatinib’s response was compared in both positive and negative ESI modes. Positive ESI mode was chosen because it produced a stronger signal, allowing for an LLOQ. A full scan mass spectrum acquired in the first quadrupole (Q1) identified the [M+H]+ ion (Tucatinib molecule with a single added proton) as the most abundant, making it the optimal precursor ion for generating product ion spectra in the third quadrupole (Q3). To achieve the strongest signal, the cone voltage and collision energy were then systematically adjusted. Cone voltage influences the precursor ion transmission efficiency, while collision energy impacts the fragmentation efficiency to generate product ions. Following optimization, the selected mass transition pair for Tucatinib was m/z 481.5 (precursor ion) → 347.1 (product ion). Figure 2 illustrates the product ion mass spectrum of Tucatinib.
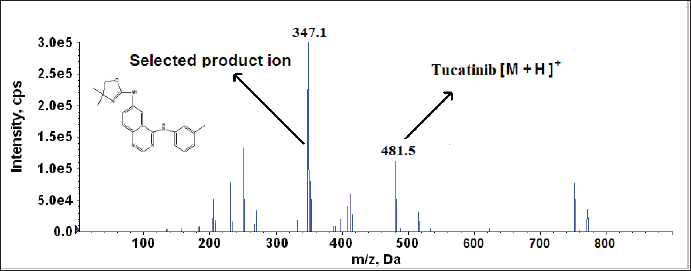 | Figure 2. Product ion mass spectra of [M+H] + of Tucatinib (likely structure of production). [Click here to view] |
During MS Parameters optimization, both positive and negative polarity modes were verified for better response, and positive polarity mode was selected. The protonated Tucatinib m/z 481.5 was identified as the precursor ion. Furthermore, the precursor ion which was subjected to collision in quadrupole with m/z 347.1 as product ion with good response with low interference from foreign materials. The cone voltage and collision energy ramped from lower to higher with the MRM 481.5 →347.1 and finalized the cone voltage as 35 V and collision energy as 18 eV.
Chromatographic separation and sample preparation optimization
To achieve optimal separation and symmetrical peaks for Tucatinib and the IS while minimizing analysis time, a strategic approach was undertaken for mobile phase composition and column selection. A shorter column was chosen to expedite the analysis. An evaluation was carried out of various combinations of methanol and ammonium acetate/ammonia solution buffers. The flow rates were varied on both C18 and C8 columns. The primary aim was to completely separate the target analyte and IS from any interfering molecules present in the rat plasma matrix. Following this extensive optimization process, a mobile phase system was identified that achieved the desired chromatographic resolution between Tucatinib and the IS. This system consisted of two simple solvents: Solvent A (0.1% formic acid in water) and Solvent B (a 1:1 (v/v) mixture of acetonitrile and methanol, both containing 0.1% formic acid). These solvents were used in a gradient elution mode to achieve optimal peak characteristics. The optimized gradient profile involved an initial hold at 100% A (0.01–0.20 minutes) to elute any potential interferences first. This was followed by a linear gradient from 100% A to 100% B (0.20–0.80 minutes) to efficiently separate and elute Tucatinib and the IS. A hold at 100% B (0.80–1.10 minutes) removed residual matrix components. Subsequently, a linear gradient from 100% B back to 100% A (1.10–1.20 minutes) re-equilibrated the column, and a final hold at 100% A (1.20–1.50 minutes) ensured it was ready for the next injection. This optimized mobile phase composition and gradient profile resulted in desirable retention times of 0.84 and 1.01 minutes for Tucatinib and the IS, respectively.
The finalized method utilized a Kinetex C18 column, achieving chromatographic separation of Tucatinib and the IS (Imatinib) within a short runtime. The analytes eluted at distinct retention times: 0.84 minutes for Tucatinib and 1.01 minutes for Imatinib, with a flow rate of 0.7 ml/minute. Imatinib was meticulously chosen as the IS due to its compatibility with Tucatinib in terms of chromatography, ionization efficiency, and extraction from plasma.
Protein precipitation—the sample preparation method chosen, ensured consistent recovery of Tucatinib from the plasma matrix and yielded clean chromatograms for blank samples, facilitating accurate quantification. Protein precipitation offered high extraction efficiency, enabling an LLOQ, faster analysis times, and reduced assay costs.
RESULTS AND DISCUSSION
Selectivity
To ensure minimal interference from the rat plasma matrix, blank plasma samples were analyzed. Analysis of the chromatograms in Figure 3A revealed the absence of significant peaks at the expected retention times for Tucatinib and the IS in their respective MRM channels. This indicates minimal interference from other substances in the samples. This absence of interference is further supported by Figure 3B, which displays a chromatogram of a blank plasma sample spiked with Tucatinib at the lowest detectable concentration (LLOQ). As expected, only the peak corresponding to Tucatinib is present at the LLOQ level. The absence of interfering peaks in both the blank observed in Figure 3A and LLOQ-spiked samples observed in Figure 3B demonstrates the good selectivity of the analytical method. This translates to minimal background noise from endogenous plasma components, ensuring accurate detection of Tucatinib.
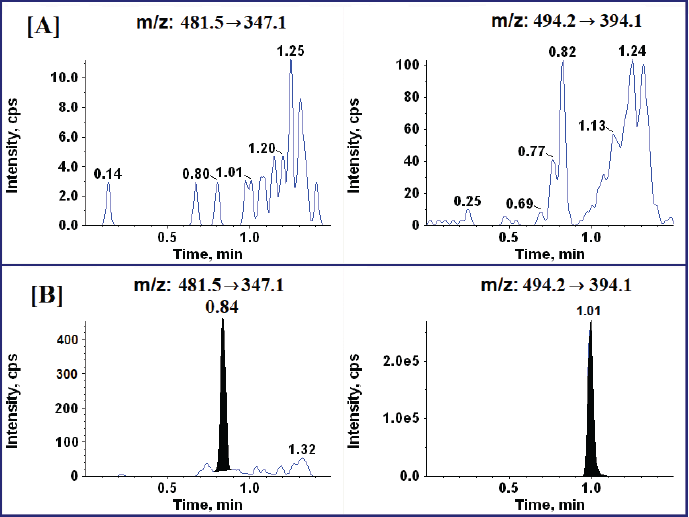 | Figure 3. Typical MRM mode chromatograms (A) Blank chromatograms of Tucatinib and IS, and (B) Rat plasma spiked with Tucatinib at LLOQ level and IS. [Click here to view] |
Linearity
To assess the method’s ability to produce consistent responses across a range of Tucatinib concentrations, a linearity test was conducted. This involved plotting the ratio of the peak area for Tucatinib to the IS (y-axis) against the expected concentration (x-axis) of each calibration standard. A weighted (1/x²) linear regression analysis was then performed on the nine-point calibration curve encompassing concentrations from 0.050 to 1,000 ng/ml. The resulting calibration curve demonstrated excellent linearity, with correlation coefficients ranging from 0.986 to 0.998, indicating a strong positive relationship between the peak area ratio and Tucatinib concentration. High accuracy was also achieved, with the measured concentrations consistently falling within 1.79% to 3.78% of the expected values. Precision, as measured by the CV (%CV), was good as well, ranging from 2.68% to 6.08%. For a more detailed breakdown of these results, refer to Table 1.
Intra- and inter-day pecision and accuracy
The data in Table 2 demonstrates that the method performed well in terms of both precision and accuracy, consistently producing reliable results within a single day (intra-day) and across different days (inter-day) of analysis for Tucatinib. Intra-day analysis revealed excellent accuracy, with measured concentrations closely matching nominal values (99.83%–104.94%). This was accompanied by low variability (%CV: 3.33%–4.64%) in repeated measurements, indicating good precision. Inter-day analysis, as detailed in Table 2, maintained consistent performance. Accuracy remained within an acceptable range (99.20%–104.68%), and precision demonstrated good repeatability with %CV values between 4.20% and 6.07%. These findings collectively suggest the analytical method offers reliable and consistent performance.
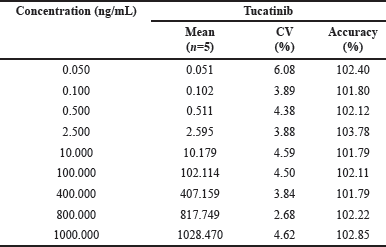 | Table 1. Precision and accuracy data for back—calculated concentrations of calibration standards. [Click here to view] |
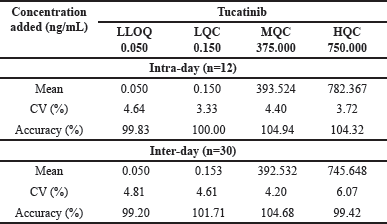 | Table 2. Intra-day and inter-day accuracy and precision of Tucatinib. [Click here to view] |
Recovery
The analysis of Tucatinib and the IS yielded good and consistent recovery from the samples, as evidenced by the data presented in Table 3. This table summarizes the average recovery rates (with precision data) for both Tucatinib and the IS, alongside individual recoveries from each extraction process. These results indicate that the chosen sample preparation method effectively extracts both Tucatinib and the IS with minimal losses. This efficient extraction, as observed in Table 3, ensures reliable quantification of Tucatinib in the analyzed samples.
 | Table 3. Mean overall recoveries of Tucatinib and IS. [Click here to view |
Matrix effect and dilution integrity
Evaluation of the matrix effect revealed negligible suppression of the signal for both Tucatinib and the IS by the plasma matrix. This is evident from the average matrix factor values for Tucatinib, which ideally should be close to 1. In this case, the values ranged from 0.99 to 1.00, demonstrating minimal matrix effects. Additionally, the precision (%CV) for these measurements fell within a tight range of 1.17% to 2.13%, indicating good repeatability. Furthermore, the analytical method’s upper limit of quantification (ULOQ) for Tucatinib was successfully extended to 2,000 ng/ml. This extension was achieved by diluting samples with blank rat plasma. Half and quarter dilutions were prepared and analyzed to confirm the integrity of the dilution process. Importantly, the mean concentrations back-calculated from these diluted samples fell within the acceptable range of 85% to 115% of their nominal values, signifying accurate quantification even at higher concentrations. Moreover, the precision (%CV) of these diluted samples remained remarkably low, ranging from 1.05% to 1.79%, demonstrating minimal variability upon dilution. Collectively, these findings demonstrate the analytical method’s ability to reliably quantify Tucatinib even at concentrations exceeding the initial ULOQ, offering flexibility for wider applicability.
Stability evaluation
Evaluation of Tucatinib stock solution stability (1,000 ng/ml) under various storage conditions revealed excellent stability. Tucatinib exhibited excellent stability in refrigerated storage (2°C–8°C) for 24 days and even remained entirely unchanged (100% recovery) after 6 hours at room temperature. Table 4 provides a comprehensive overview of stability under various conditions, including bench-top stability for up to 8 hours, processed sample stability in the auto-sampler for 24 hours, stability through three freeze-thaw cycles, and long-term storage stability for up to 60 days. All stability assessments met acceptable limits, confirming that Tucatinib exhibits good stability under these typical storage and handling conditions. This ensures reliable analysis without significant degradation concerns.
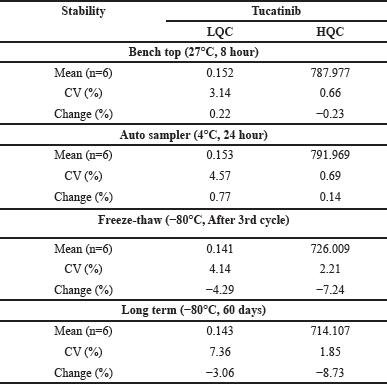 | Table 4. Stability data of Tucatinib in rat plasma. [Click here to view] |
In vivo pharmacokinetic evaluation
The reported method quantified Tucatinib in plasma from six Sprague Dawley rats, facilitating pharmacokinetic assessment [ethical approval number: IAEC/022/11-2023]. Figure 4 illustrates the average concentration of Tucatinib in the blood plasma over time. The key parameters that describe how the drug behaves in the body are presented in Table 5. Following oral administration, Tucatinib reached its peak concentration (Cmax) of 43.229 ng/ml at 8.00 hours post-dosing (Tmax). This information is visually represented in Figure 4. AUC, or area under the curve, represents the total amount of drug in the bloodstream over a specific time period. The amount of Tucatinib absorbed into the bloodstream over time was assessed using the area under the curve (AUC) metric. AUC was calculated from the time of drug administration (time zero) to the last time point where Tucatinib levels could be reliably measured (AUC0-t). This value was 198.986 ng?h/ml. To account for the possibility of Tucatinib remaining in the bloodstream beyond the last measured time point, the AUC was further extrapolated to infinity (AUC0-α). This resulted in an estimated total exposure of 219.379 ng?h/ml. To further illustrate the presence of Tucatinib in plasma samples, Figure 5 showcases representative chromatograms obtained following oral administration.
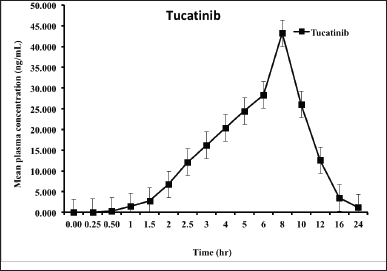 | Figure 4. Mean plasma concentration vs time profile of Tucatinib. [Click here to view] |
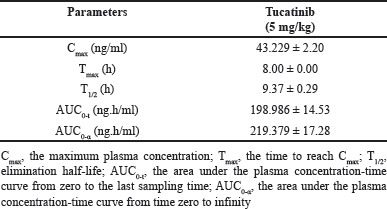 | Table 5. Pharmacokinetic data of Tucatinib (n=6, Mean ± SD). [Click here to view] |
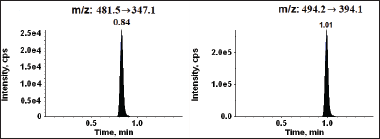 | Figure 5. Typical MRM mode chromatograms of Tucatinib and IS (right panel). [Click here to view] |
CONCLUSION
This research successfully established a validated LC-MS/MS method specifically designed to quantify Tucatinib in rat plasma samples. This method provides a reliable tool for future pharmacokinetic studies. This study bridges a crucial gap in knowledge by establishing the first reported LC-MS/MS method for analyzing Tucatinib in any biological matrix. This method has notable features including a wide linear range, excellent extraction efficiency, and rapid analysis time. Additionally, the LLOQ (0.050 ng/ml) demonstrates the method’s high sensitivity for Tucatinib detection. The combination of a streamlined sample preparation approach with shortened chromatography allows for high-throughput analysis, further enhancing the method’s utility. Validation data confirms the method’s reliability for precise and accurate determination of Tucatinib plasma concentrations, making it a valuable tool for pharmacokinetic studies.
LIST OF ABBREVIATIONS
IS: Internal standard; MRM: Multiple reaction monitoring; QC: Quality control.
AUTHOR CONTRIBUTIONS
All authors made substantial contributions to conception and design, acquisition of data, or analysis and interpretation of data; took part in drafting the article or revising it critically for important intellectual content; agreed to submit to the current journal; gave final approval of the version to be published; and agree to be accountable for all aspects of the work. All the authors are eligible to be an author as per the International Committee of Medical Journal Editors (ICMJE) requirements/guidelines.
FINANCIAL SUPPORT
There is no funding to report.
CONFLICTS OF INTEREST
The authors report no financial or any other conflicts of interest in this work.
ETHICAL APPROVALS
Ethical approval was obtained from the Institutional Animal Ethical Committee with approval number: IAEC/022/11-2023.
DATA AVAILABILITY
All data generated and analyzed are included in this research article.
PUBLISHER’S NOTE
All claims expressed in this article are solely those of the authors and do not necessarily represent those of the publisher, the editors and the reviewers. This journal remains neutral with regard to jurisdictional claims in published institutional affiliation.
USE OF ARTIFICIAL INTELLIGENCE (AI)-ASSISTED TECHNOLOGY
The authors declares that they have not used artificial intelligence (AI)-tools for writing and editing of the manuscript, and no images were manipulated using AI.
REFERENCES
1. The International Agency for Research on Cancer of World Health Organization. Latest global cancer data: cancer burden rises to 19.3 million new cases and 10.0 million cancer deaths in 2020. 2020 [cited 2020 Dec 15] Available from: https://www.iarc.fr/faq/latest-global-cancer-data-2020-qa/
2. Lin NU, Borges V, Anders C, Murthy RK, Paplomata E, Hamilton E, et al. Intracranial efficacy and survival with tucatinib plus trastuzumab and capecitabine for previously treated HER2-positive breast cancer with brain metastases in the HER2CLIMB trial. J Clin Oncol. 2020;38(23):2610.
3. Dong L, Lin S, Zhong L, Nian D, Li Y, Wang R, et al. Evaluation of tucatinib in HER2-positive breast cancer patients with brain metastases: a United States-based cost-effectiveness analysis. Clin Breast Cancer. 2022;22(1):e21–e29.
4. Gupta R, Gupta S, Antonios B, Ghimire B, Jindal V, Deol J, et al. Therapeutic landscape of advanced HER2-positive breast cancer in 2022. Med Oncol. 2022;39(12):258.
5. Murthy RK, Loi S, Okines A, Paplomata E, Hamilton E, Hurvitz SA, et al. Tucatinib, trastuzumab, and capecitabine for HER2-positive metastatic breast cancer. New England J Med. 2020;382(7):597–609.
6. Food U.S. Drug Administration. FDA approves tucatinib for patients with HER2-positive metastatic breast cancer. 2020.
7. Topletz-Erickson AR, Lee AJ, Mayor JG, Sun H, Abdulrasool LI, Rustia EL, et al. The pharmacokinetics and safety of tucatinib in volunteers with hepatic impairment. Clin Pharm 2022;61(12):1761–70.
8. Zhang Y, Liu YN, Xie S, Xu X, Xu RA. Evaluation of the inhibitory effect of quercetin on the pharmacokinetics of tucatinib in rats by a novel UPLC–MS/MS assay. Pharm Biol, 2022;60(1):621–26.
9. Neeharika, T, Ramachandran D. Bio analytic and analytic method quantitative to tucatinib estimation in pure and pharmaceutical dosage form. YMER 2022;21(11):1957–67.
10. Chunduri RHB, Dannana GS. Development and validation of a reliable and rapid LC-MS/MS method for simultaneous quantification of sacubitril and valsartan in rat plasma and its application to a pharmacokinetic study. Biomed Chromatogr. 2016;30(9), 1467–75.
11. Chunduri RHB, Dannana GS. Development and validation of a high throughput UPLC–MS/MS method for simultaneous quantification of esomeprazole, rabeprazole and levosulpiride in human plasma. J Pharm Anal. 2016;6(3):190–8.
12. FDA US. Bioanalytical method validation guidance for industry. US Department of Health and Human Services Food and Drug Administration Center for Drug Evaluation and Research and Center for Veterinary Medicine, 2018.