INTRODUCTION
Tuberculosis (TB) is the second most common infectious disease worldwide. Number of cases of highly drug-resistant as well as multidrug-resistant TB has surged. A common clinical method for determining dosage using plasma drug concentrations is still therapeutic drug monitoring (TDM). TDM gives TB patients unbiased information so the doctor can decide the right dosage. TDM can accelerate the time it takes for some patients to respond to treatment and for the course of treatment to be completed[1] World Health Organisation suggests the use of rifapentine as an alternate first-line treatment for TB and it has approved its use in conjunction with isoniazid [2]. Three months weekly regimen is given for the prevention of TB in non-pregnant adults and children. This regimen can be used in place of 6 months of isoniazid monotherapy [3]. Arylacetamide deacetylase breaks down rifapentine into its less potent metabolite, 25-O-desacetyl rifapentine. It is well known that rifapentine induces CYP3A4 strongly and CYP2C9 somewhat. It decreases the effectiveness of hormonal contraceptives and interacts with HIV-1 protease inhibitors and warfarin [4]. It was reported that rifapentine greatly reduced the bedaquiline and protomanid area under the curve. Literature indicated an assessment of rifapentine in human milk by LS-MS/MS method which is a complex method considering human milk as a complex biological matrix. Also in this analyte was extracted protein precipitation method followed by solid phase extraction which is time consuming [4,5]. The shortcomings of previous techniques, such as UV and HPLC, regarding sample preparation, sensitivity, specificity, and low sensitivity measurement of dried blood samples are particularly problematic. [5–8]. The four first-line medications (isoniazid, pyrazinamide, rifampicin, and ethambutol), the metabolite of isoniazid (acetylisoniazid), and the five primary second-line medications (rifabutin, levofloxacin, linezolid, moxifloxacin, and bedaquiline) could all be quantified simultaneously by developing LC-MS/MS method using content analogue of rifapentine[9]. Metformin, isoniazid, and rifampicin were simultaneously quantified in rat plasma utilizing HILIC chromatography and the LC-MS/MS technique[10]. No literature is available on the determination of rifapentine and 25-O-desacetyl rifapentine by LS-MS/MS method on human plasma. Describing the rationale for choosing LC-MS/MS as the analytical technique, emphasizing its advantages in terms of sensitivity, selectivity, and speed. The steps involved in method development will include chromatographic separation, mass spectrometric detection, and sample preparation. Optimizations were made to enhance method sensitivity, such as the choice of extraction solvents, chromatographic conditions, and mass spectrometric parameters. This method gives details of method validation parameters such as linearity, accuracy, precision, stability studies, and specificity [11]. It highlights the successful validation results and compliance with regulatory guidelines. In contrast with earlier LC-MS/MS methods, the current method focuses on improvements in sensitivity, specificity, and sample throughput. The developed method had reduced analysis time, simplified sample preparation, and lower detection limits. Also, it has potential applications in clinical research, pharmacokinetic studies, and TDM. For further studies, this method can be extended to additional biological matrices or examining its suitability for use with various patient groups.. Thus present research work herewith is discussed with key findings and the significance of developing a novel LC-MS/MS technique for quantifying rifapentine in human plasma. This method definitely will reinforce the importance of our research in advancing analytical techniques for pharmaceutical analysis and clinical practice.
MATERIAL AND METHODS
Materials and reagents
Rifapentine (96.45%), 25-Desacetyl rifapentine (92.75%), Rifapentine D9 (99.88%), and 25-Desacetyl rifapentine D8 (90.05%) were purchased for Vivan Sciences Pvt. Ltd., Maharashtra, India. LC-MS grades of methanol and acetonitrile were sourced from Fisher Scientific. HPLC-grade water was obtained from Adventchembio Pvt. Ltd. based in Navi Mumbai, India. Ammonium formate and Formic acid of analytical grade were supplied by Avantor Performance Materials India Private Limited, situated in Gujarat, India.
Chromatographic conditions and instrumentation
A reverse phase liquid chromatography was conducted on Sciex Exton LC system (Framingham, USA), utilizing a Supelco Discovery C18 column (10 cm*4.6 mm, 5 µm particle size) from Germany. The mobile phase contains an organic mixture of acetonitrile and methanol (50:50 V/V) and 10 mM ammonium formate (70:30 V/V). It was pumped at a flow rate of 1 ml/minute. Detection of Rifapentine and the internal standard (IS) were accomplished via mass spectrometry using a Sciex API 4500 triple-quadrupole mass spectrometer (Framingham, USA) equipped with an electrospray ion source. Source parameters were optimized as follows: Curtain gas flow of 35.00 L/hour, collision gas flow was 8 L/hour, declustering potential was 40 V and collision energy was 20 V. Analytical data processing was performed using Analyst® software (Framingham, USA, ver. 1.7.2).
Calibration standards and quality control sample preparation
Rifapentine calibration curve (CC) stock solution (2,000 µg/ml)
The rifapentine analytical standard was weighed precisely to yield a mass of 10 mg, then it was transferred into a volumetric flask with a capacity of 5 ml, to get the rifapentine CC stock solution. It was mixed thoroughly and sonicated. The batch number was assigned to the solution and it was stored in the refrigerator (2°C–8°C) [11,12].
Rifapentine Q C stock solution (2,000 µg/ml)
Rifapentine analytical standard was precisely weighted to equal approximately 10 mg and transferred into a volumetric flask that holds 5 ml. Methanol was added to get the volume up to 5 ml. It was mixed thoroughly and sonicated. A batch number was assigned and it was stored in the refrigerator (2°C–8°C).
25-Desacetyl rifapentine CC stock solution (1,000 µg/ml)
25-Desacetyl rifapentine analytical standard is equivalent to about 5 mg were weighed and transferred to a volumetric flask. Methanol was added to make 5 ml. It was mixed thoroughly and sonicated. A batch number was assigned and it was stored in a refrigerator (2°C–8°C).
25-Desacetyl rifapentine QC stock solution (1,000 µg/ml)
25-Desacetyl rifapentine analytical standard is equivalent to about 5 mg of 25-Desacetyl rifapentine were transferred into a 5 ml volumetric flask and methanol was added. It was mixed thoroughly and sonicated. A batch number was assigned and it was stored in the refrigerator (2°C–8°C).
Rifapentine D9 stock solution (1,000 µg/ml)): Rifapentine D9 analytical standard equivalent to about 1 mg were weighed and transferred into a 1 ml volumetric flask and the volume was made up to 1 ml with methanol to prepare a stock solution of Rifapentine D9. It was mixed thoroughly. A batch number was assigned.
25-Desacetyl Rifapentine D8 stock solution (1,000 µg/ml))
25-Desacetyl rifapentine D8 analytical standard equivalent to about 1 mg was weighed and poured into 1 ml volumetric flask. Methanol was added to make up the volume.
Internal standard solution (2,500 ng/ml, 4,000 ng/ml)
IS dilution with diluent 2 (Acetonitrile: water 80 : 20 vlv) was 0.200 µl of ISTD1 (based on weighing), 0.421 µl of ISTD2 (based on weighing) in stock of 100 ml. It was vortexed and labeled.
Chromatography
The chromatographic peaks of rifapentine and 25-desacetyl rifapentine, as well as rifapentine D9 and 25-desacetyl rifapentine D8, were observed to be devoid of interfering peaks and merging peaks. Furthermore, the chromatographic peaks of rifapentine and 25-desacetyl rifapentine were well resolved. The retention time of rifapentine and 25-desacetyl rifapentine was 2.45 minutes and 1.77 minutes and rifapentine D9 and 25-desacetyl rifapentine D9 were 2.30 minutes and 1.68 minutes. The total run time for chromatographic analysis was 8 minutes. There was no significant variation in the retention times observed during the validation process. Representative chromatograms illustrating these findings are depicted in Figures 1–18
 | Figure 1. Representative chromatogram of standard blank. [Click here to view] |
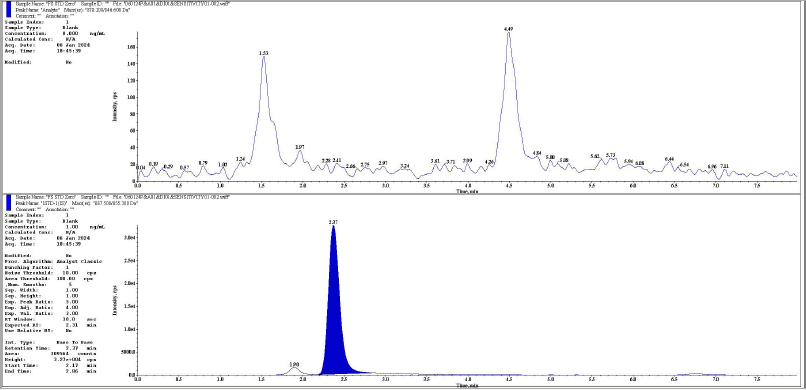 | Figure 2. Representative chromatogram of standard zero analyte and IS respectively. [Click here to view] |
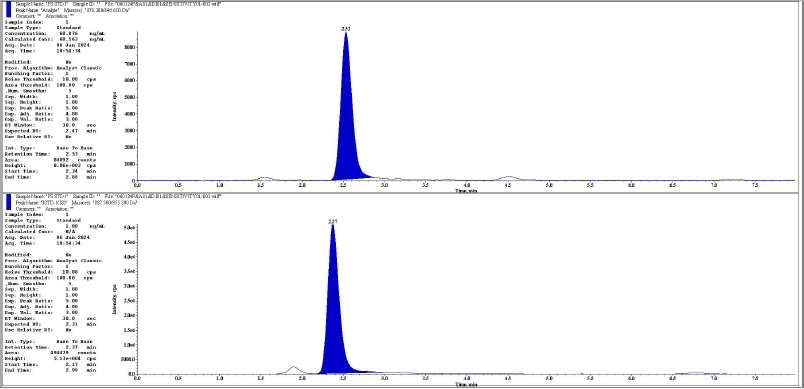 | Figure 3. Representative chromatogram of LLOQ analyte and IS respectively. [Click here to view] |
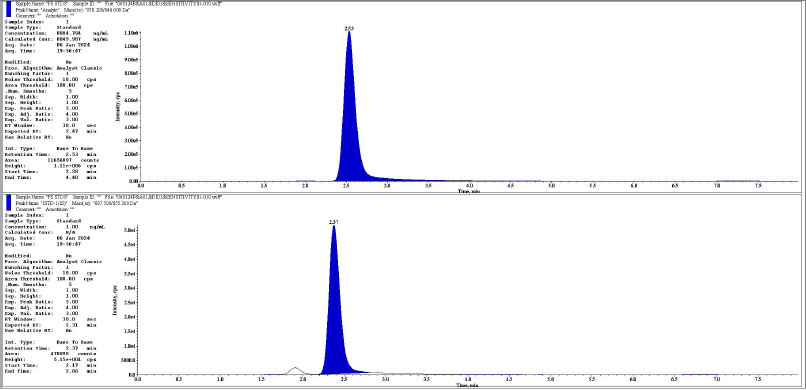 | Figure 4. Representative chromatogram of ULOQ analyte and IS respectively. [Click here to view] |
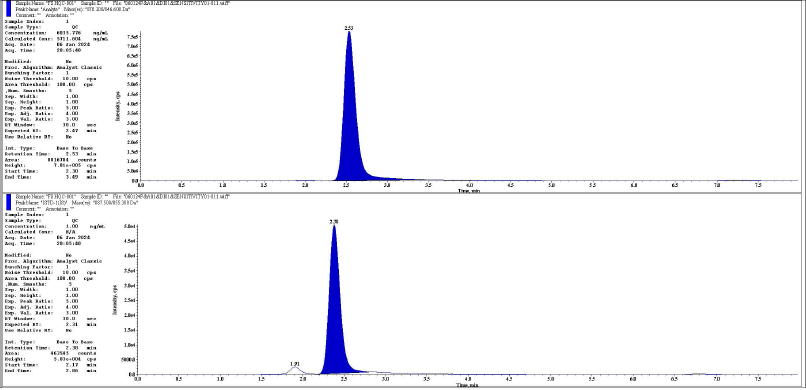 | Figure 5. Representative chromatogram Of HQC analyte and IS respectively. [Click here to view] |
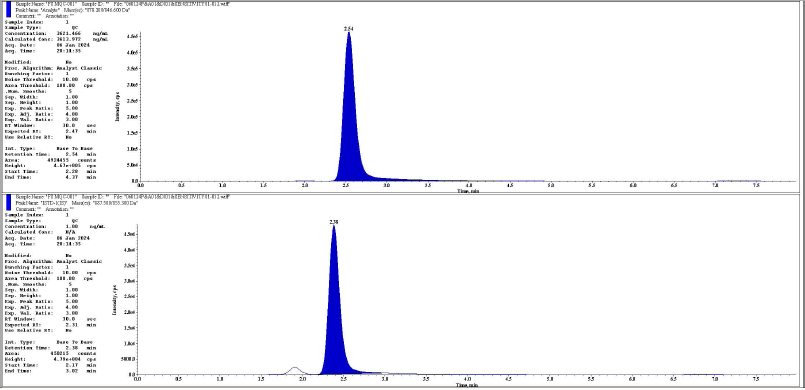 | Figure 6. Representative chromatogram of MQC analyte and IS respectively. [Click here to view] |
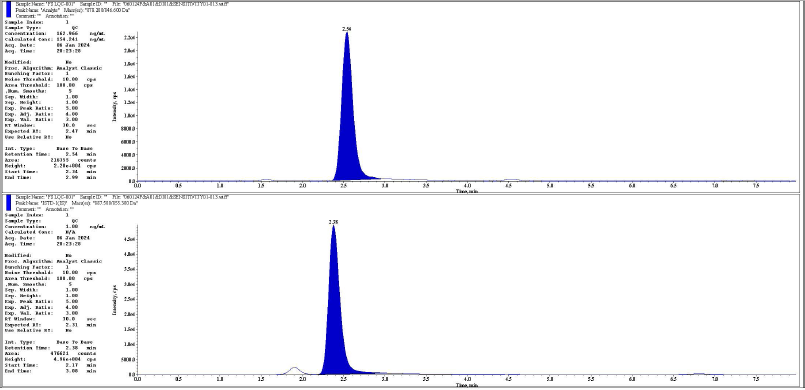 | Figure 7. Representative chromatogram of LQC analyte and IS respectively. [Click here to view] |
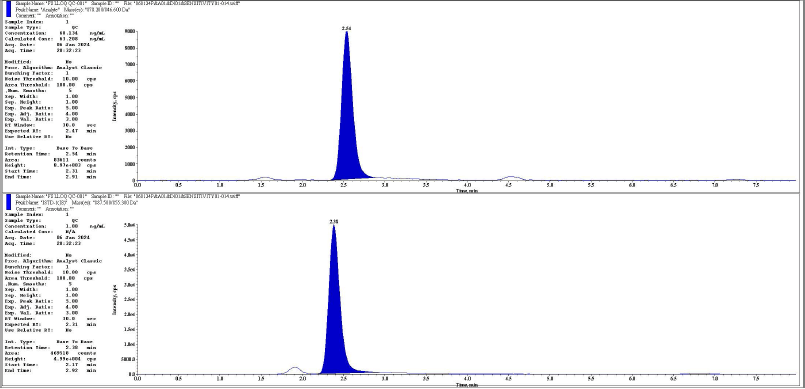 | Figure 8. Representative chromatogram of LLOQQC analyte and IS respectively. [Click here to view] |
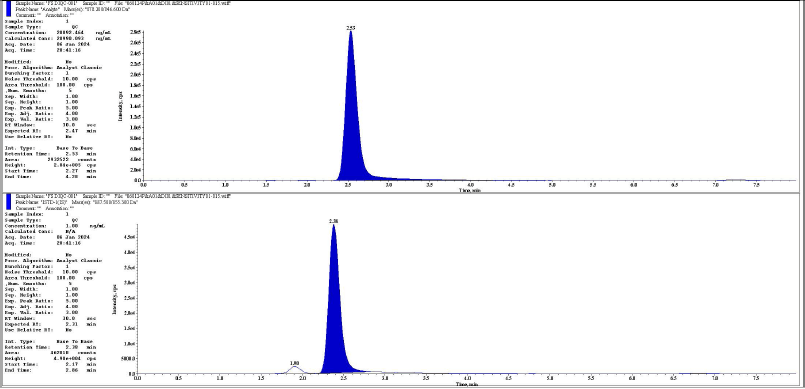 | Figure 9. Representative chromatogram of DIQC analyte and IS respectively. [Click here to view] |
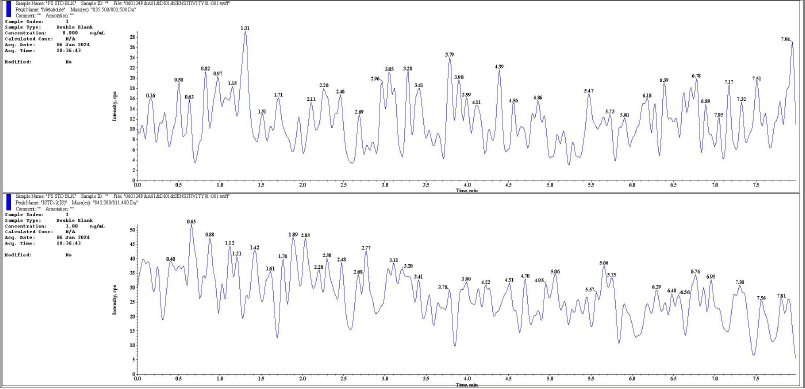 | Figure 10. Representative chromatogram of standard blank metabolite. [Click here to view] |
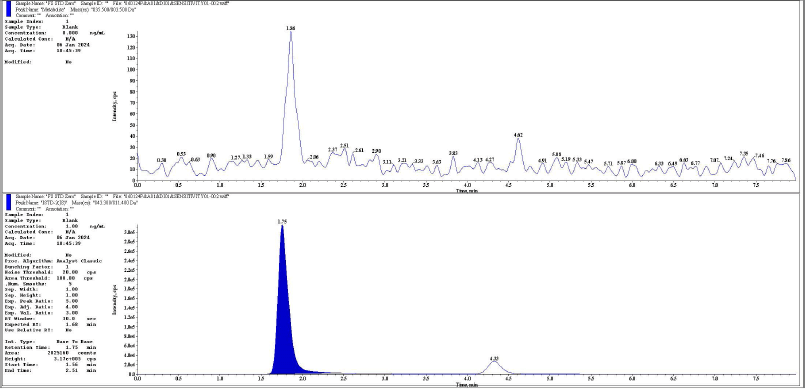 | Figure 11. Representative chromatogram of standard zero metabolites and its. [Click here to view] |
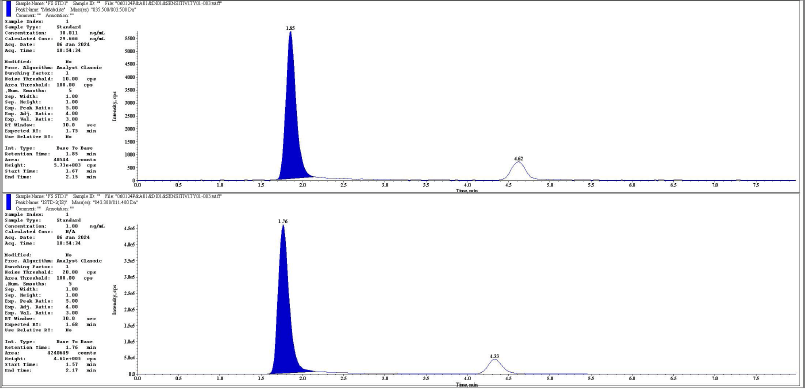 | Figure 12. Representative chromatogram of LLOQ metabolite and its IS respectively. [Click here to view] |
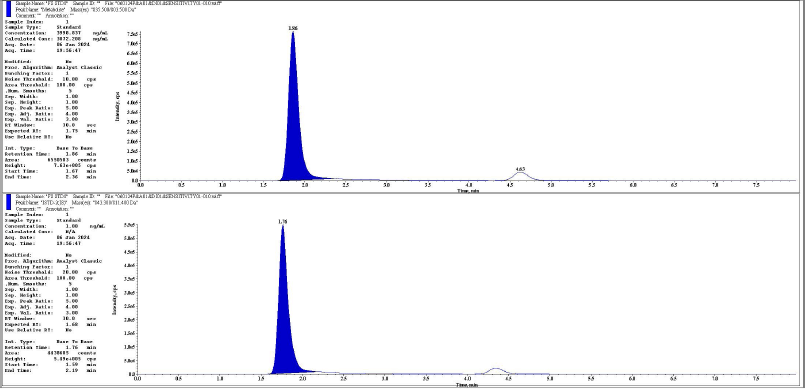 | Figure 13. Representative chromatogram of ULOQ metabolite and its IS respectively. [Click here to view] |
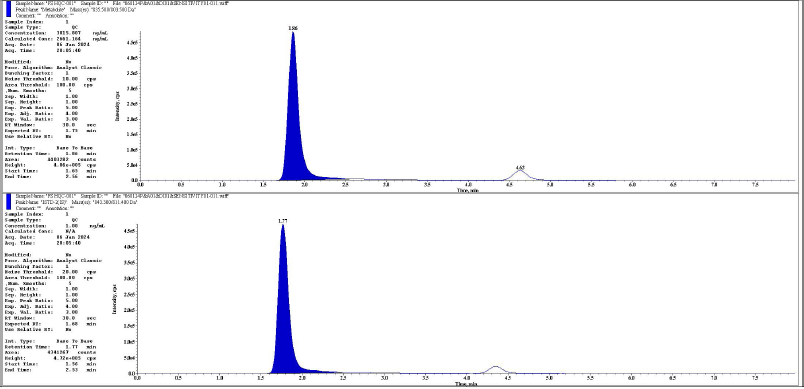 | Figure 14. Representative chromatogram of HQC metabolite and its IS respectively. [Click here to view] |
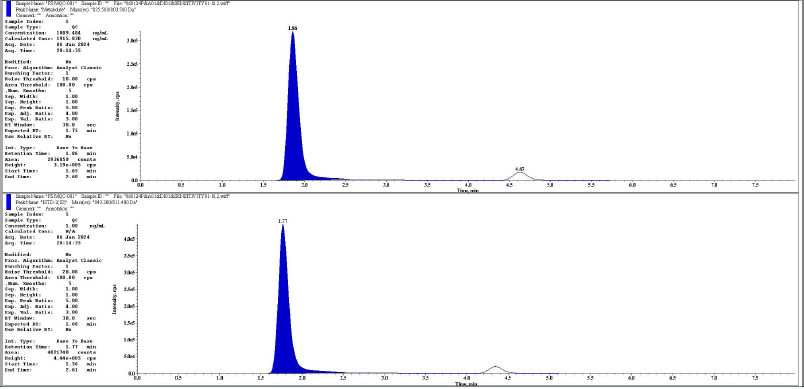 | Figure 15. Representative chromatogram of MQC metabolite and its IS respectively. [Click here to view] |
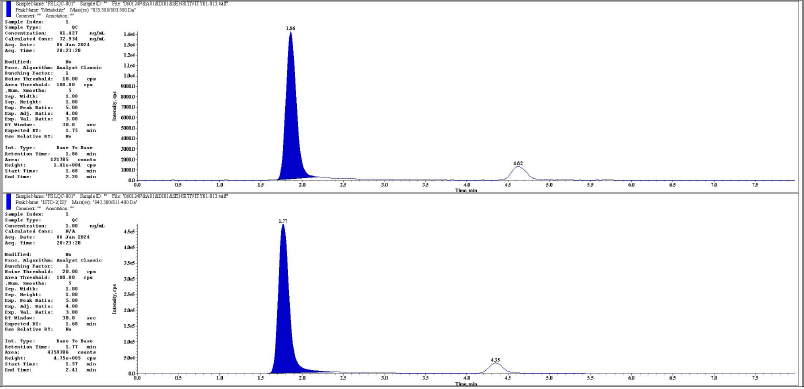 | Figure 16. Representative chromatogram of LQC metabolite and its IS respectively. [Click here to view] |
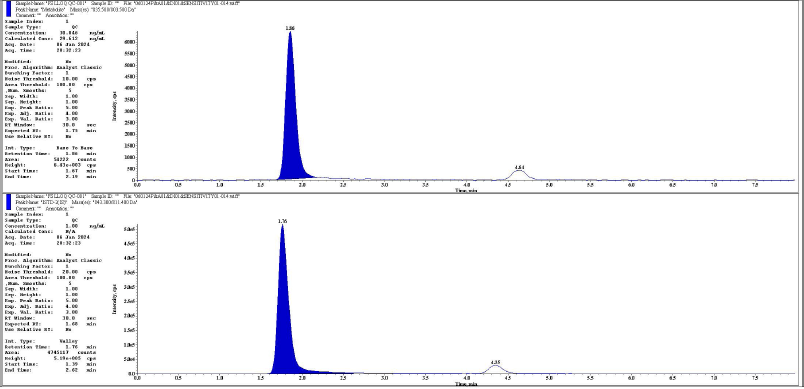 | Figure 17. Representative chromatogram of LLOQQC metabolite and its IS respectively. [Click here to view] |
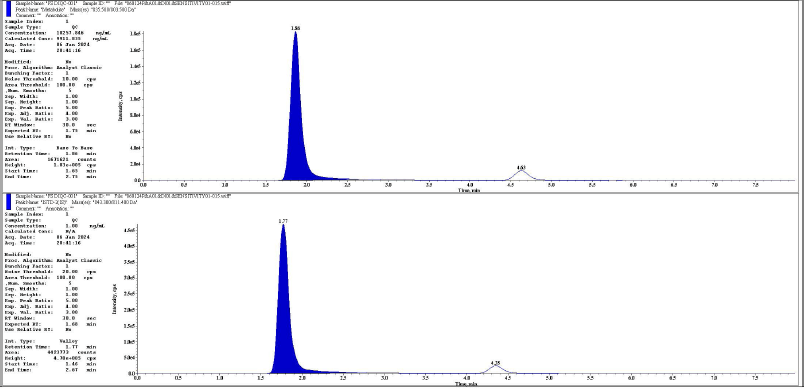 | Figure 18. Representative chromatogram of DIQC metabolite and its IS respectively. [Click here to view] |
Extraction procedure
50.0 μl of ISTWS was added into the pre-labeled tubes except for the standard blank. In the standard blank 50.0 μl of diluent was added. 200 μl aliquots of respective samples were transfered into pre-labelled vials and vortexed to mix. 200 μl of water was added, and vortexed to mix. Then 2.5 ml of tertiary butyl methyl ether was added. Samples in LLE were mixed at 60 rpm for 10 minutes, and centrifuged at 4,000 rpm at 5°C for 5 minutes. 2 ml of the extraction solvent was added into pre-labelled vials. The samples were dried using nitrogen evaporation at 40°C until complete evaporation. Subsequently, the samples were reconstituted with 500 µl of reconstitution solution and vortexed for proper mixing. Finally, the reconstituted samples were pipetted out into pre-labeled LC vials for subsequent analysis.
Method validation
The method described above was validated to ensure compliance with the matrix effect, selectivity, recovery, precision, linearity, accuracy, carry-over and stability requirements outlined in the bioanalytical method validation guidance provided by the USFDA and the ICH M10 Guideline [13,14]. For the acceptance criteria of method validation refer below table.
Selectivity
The selectivity experiment was evaluated using 6 individual lots of blank matrix, along with two individual lots each of lipemic and hemolyzed blank matrix along with STD blank, STD zero, calibration standards, and 02 sets of QCs (H/M/L). Spiked lower limit of quantification (LLOQ) samples were prepared using each individual lot of blank matrix. Blank and LLOQ samples were prepared from each individual lot of blank matrix. Furthermore, it was processed and analyzed along with CC & QC samples.
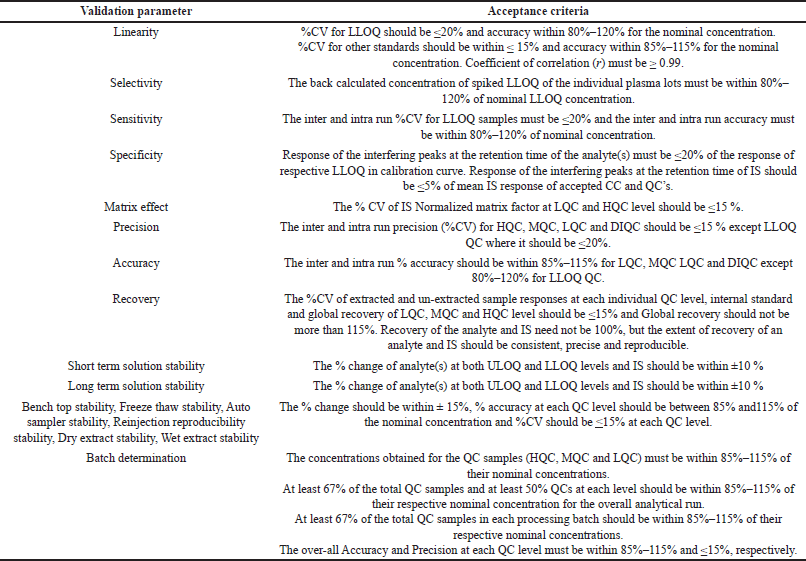 | [Click here to view] |
Sensitivity
The sensitivity experiment involved the analysis of six LLOQ samples along with precision and accuracy (P&A) samples. The sensitivity experiment was performed three times in different analytical runs. The intra run and inter run P&A of the LLOQ samples were found across the 3 runs to assess sensitivity.
Matrix effect
Performed matrix effect experiment using CC set and two sets of high-quality control (HQC)/low quality control (LQC) along with 03 sets of HQC and LQC from at least six individual sources/lots of interference free blank matrix including at least one individual source/lot each of lipemic blank matrix and hemolyzed blank matrix.
Linearity
During method validation, a linear equation was built between concentration v/s detector response relationships. 1/x^2 was used as the weighting factor. 8-point CC were found to be linear from 60.076 to 8004.794 ng/ml and 30.011 to 3998.837 ng/ml for rifapentine and 25-desacetyl rifapentine. 8-point CC were evaluated during method validation. Back calculated concentrations of rifapentine and 25-desacetyl rifapentine in calibration standards were found using the best-fit regression curve calculated for the run. Inter-run calibration standard precision and % nominal for rifapentine and 25-desacetyl rifapentine ranged from 0.60% to 2.49%, 98.24% to 102.14%, and 1.19% to 4.88%, 97.13% to 103.05%, respectively, proving adequate assay linearity throughout the validation process.
Precision and accuracy
Three P&A runs, each with six quality control samples at HQC, medium quality control (MQC), LQC, LLOQ QC, and the dilution integrity quality control (DIQC) levels were used to calculate the intra run and inter run P&A values. Three P&A runs were conducted using freshly spiked QC samples, with each run performed on different days. The accuracy of the assay was calculated as the absolute value of the ratio between the back-calculated average values and the corresponding nominal values of the quality control samples. The precision was determined by calculating the percent coefficient of variation (%CV) over the concentration range of the quality control samples during the validation procedure.
Recovery
The recovery experiment involved analyzing post-spiked samples of high, medium, and low-quality control in blank extracts. Along with extracted high, medium, and low quality control samples, and subsequently comparing the responses. The extracted QC samples’ peak areas for rifapentine and 25-desacetyl rifapentine were compared to the matching post-spiked QC samples’ areas. Furthermore, at HQC, MQC, and LQC the peak areas of rifapentine and 25-desacetyl rifapentine in the extracted quality control samples were compared to the peak areas of rifapentine D9 and 25-desacetyl rifapentine D8 in the post-spiked quality control samples.
Dilution integrity
Dilution integrity samples were created by adding precise volumes of spiking solution to samples to attain a concentration of 20092.464 ng/ml and 10257.846 of rifapentine and 25-desacetyl rifapentine in human plasma (about 2.51 and 2.57 times the highest standard concentration). The former is subjected to 1/10th dilution and the later was subjected to 1/5th dilution to evaluate the dilution integrity. Six samples each of 1/10th dilution and 1/5th dilution were prepared using screened blank plasma and were analyzed along with CC standards to evaluate dilution integrity.
Stability in solution
Short-term stability
Stock solution and spiking solution stability of rifapentine and 25-Desacetyl rifapentine, rifapentine D9 and 25-desacetyl rifapentine D8 were assessed by comparing the average area ratio determined from 6 injections of ULOQ and LLOQ level. Dilution of rifapentine, 25-desacetyl rifapentine, and IS dilution level of rifapentine D9 and 25-desacetyl rifapentine D8 stock and spiking solution, to that of freshly prepared ULOQ and LLOQ level. Dilution of rifapentine and 25-desacetyl rifapentine and IS dilution level of rifapentine D9 and 25-desacetyl rifapentine D8 stock and spiking solution.
Long-term stability
Stock solution and spiking solution stability of rifapentine and 25-Desacetyl rifapentine, rifapentine D9 and 25-Desacetyl rifapentine D8 was assessed by comparing the average of the area ratio obtained from 6 injections of ULOQ and LLOQ level. Dilution of Rifapentine and 25-Desacetyl rifapentine and IS dilution level of Rifapentine D9 and 25-Desacetyl rifapentine D8 stock and spiking solution, to that of freshly prepared ULOQ and LLOQ level dilution of Rifapentine and 25-Desacetyl rifapentine and IS dilution level of Rifapentine D9 and 25-Desacetyl rifapentine D8 stock and spiking solution.
Rifapentine and 25-Desacetyl rifapentine stability in biological matrix
Bench top stability
The stability of rifapentine and 25-desacetyl rifapentine at high- and low-quality control levels were assessed for 1 day, 6 hours, and 47 minutes to freshly spiked quality control samples. Samples were placed on a bench at room temperature (RT). This method helps ensure the reliability of the measurements by checking if the samples maintain their intended concentrations over time under normal storage conditions [8,15].
Auto sampler stability
The stability of rifapentine and 25-desacetyl rifapentine in the auto sampler at HQC and LQC levels was assessed by comparing the average concentrations of samples stored in the auto sampler at 5.0ºC ± 3.0ºC for 3 days and 12 hours, and 28 minutes to freshly spiked QC samples. This evaluation helps to ensure the reliability of the measurements by verifying if the samples maintain their intended concentrations over a defined period under controlled storage conditions.
Reinjection reproducibility
The re-injection reproducibility at HQC, MQC, and LQC levels was determined by comparing the average concentrations of the re-injected samples. Samples were stored in auto sampler, at 5.0ºC ± 3.0ºC for 03 days and 01 hour 58 minutes to the corresponding initial concentrations.
Freeze–thaw stability
The freeze-thaw experiment involved subjecting HQC and LQC samples to 5 freeze-thaw cycles. These samples were stored at –20ºC ± 5ºC and –75ºC ± 10ºC. After completing the five freeze-thaw cycles, six samples each of HQC and LQC were analyzed to assess any potential impact on stability and integrity resulting from the freeze-thaw process.
Wet extract stability
The stability at HQC and LQC level were assessed by comparing the average concentrations of the stability samples stored 04 hours and 59 minutes at RT and 03 days and 12 hours 31 minutes at 2ºC –8?C to that of the freshly spiked QC samples.
Stability of whole blood
The stability of rifapentine in whole blood was assessed at HQC and LQC levels by comparing the average area ratio of stability samples to that of comparison samples at each level. For this evaluation, samples of the high and low-quality samples were prepared in fresh whole blood and were left on the bench at RT for 3 hours. and 16 minutes to simulate real-time conditions. This comparison helps determine if rifapentine remains stable in whole blood over the specified duration, ensuring the reliability of analytical measurements in clinical settings.
Batch determination
The sample size of the analytical runs analyzed during method validation is considerably small when compared to that analyzed during study sample analysis. In order to evaluate the bioanalytical method with respect to sample size, an analytical run with a large sample size was analyzed to substantiate the batch wise analysis during the study sample analysis. In this experiment, a batch determination procedure was conducted using freshly prepared CC standards and bulk spiked samples at HQC, LQC, and MQC levels. The batch size was designed to reflect the organization of a typical analytical run during the analysis of the study sample.
At each QC level, 45 samples of HQC, MQC, and LQC were processed and analyzed alongside calibration standards. This setup ensured a comprehensive assessment of the analytical performance across the different concentration levels. Overall, the total batch size for the analytical run consisted of 145 samples, facilitating a thorough evaluation of the analytical method under realistic conditions.
Application to bioequivalence study
The developed analytical approach was used to analyze plasma samples in a bioequivalence study involving healthy adult Asian male volunteers (n = 18), approved by the Skinovate Independent Ethics Committee (CNR-P-009-23, dated 20/06/2023), in accordance with the Declaration of Helsinki. [15]. The subjects were 30.6 years old on average and weighed 66.32 kg on average. There were 23 blood samples in total, including pre-dose sampling, were taken over the study period. Within 60 minutes before the treatment, 5 ml of pre-dose blood samples were taken. Five ml of post-dosage blood were drawn at different intervals: 1, 2, 2.50, 3, 3.50, 4, 4.33, 4.67, 5, 5.33, 5.67, 6, 6.50, 7, 8, 10, 12, 16, 24, 36, 48, and 72.00 hours. Prior to centrifugation, all blood samples were collected in pre-labeled K2EDTA-Vacutainers and stored in a wet ice bath. The samples were immediately placed in a deep freezer after centrifugation and kept there until they were required for analysis. AUC0-t (the area under the concentration-time curve from time zero to the last measured concentration), Cmax (the maximum concentration), and AUC0-∞ (the area under the concentration-time curve from time zero to infinity) are the three primary parameters for the bioequivalency study. Secondary parameters include Tmax (time to reach maximum concentration), Kel (elimination rate constant), and t½ (half-life). The estimated concentration versus time profiles of rifapentine were employed to assess these primary and secondary parameters and evaluate the bioequivalence of the tested formulations.
RESULTS
Method development
Mass spectrometry
The IS, 25-desacetyl rifapentine, and rifapentine were individually infused into the mass spectrometer in order to maximize the abundance of product and fragment ions in a positive ionization mode using a Turbo spray electrospray ionization interface and the mass spectrometric conditions were optimized. They were dissolved at a concentration of 50 ng/ml of methanol and then continuously pumped at 10 μl/minute using a syringe pump into the mass spectrometer. The Q1/Q3 whole-scan spectra were characterized by [M+H]+ at m/z 878.200/846.600 for rifapentine and m/z 835.500/803.500 for 25-desacetyl rifapentine. Selected product ions were detected at m/z 887.500/855.300 for rifapentine D9 and m/z 843.300/811.400 for 25-desacetyl rifapentine D8 IS. This method allowed for the optimization of mass spectrometric conditions to achieve the desired sensitivity and specificity for the quantification of rifapentine and 25-desacetyl rifapentine in the sample matrix. Figure 19a, b, c, shows the MS spectra scan. The fragmentation pathway mentioned below.
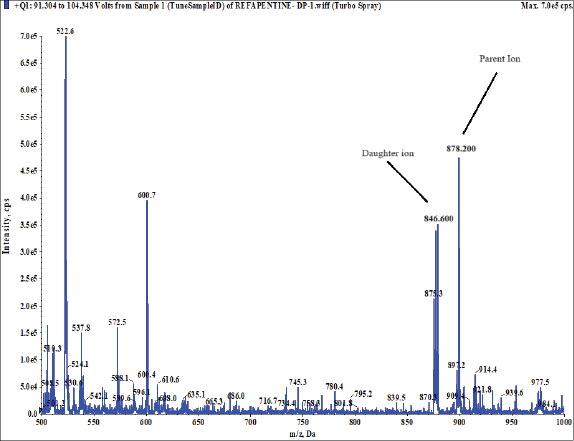 | Figure 19(a). MS spectra scan rifapentine. [Click here to view] |
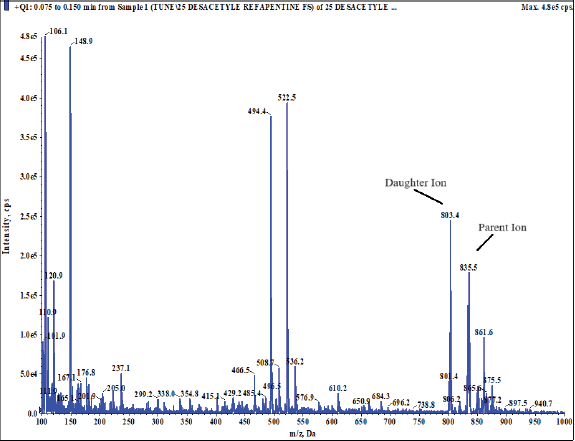 | Figure 19(b). MS spectra scan 25-desacetyl rifapentine. [Click here to view] |
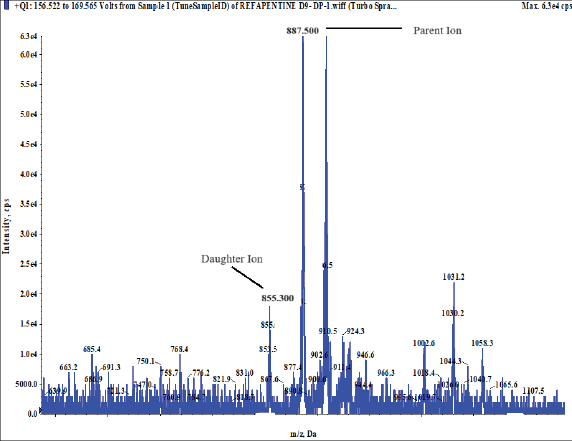 | Figure 19(c). MS spectra scan rifapentine D9 (IS). [Click here to view] |
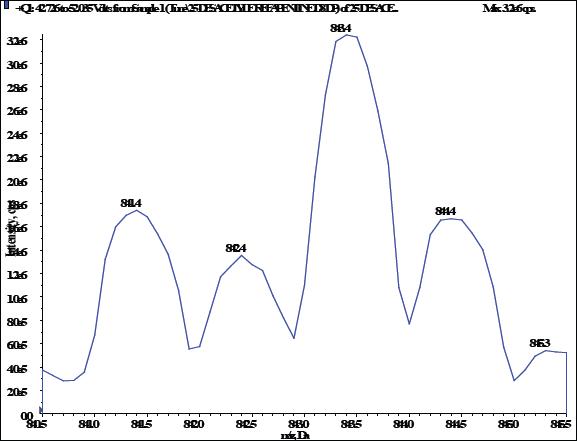 | Figure 19(d). MS spectra scan 25-desacetyl rifapentine (IS). [Click here to view] |
Sensitivity
For rifapentine, the inter-run accuracy and precision at LLOQ were 98.40% and 3.59%, respectively. The intra-run accuracy and precision at LLOQ varies from 95.53% to 102.54% and from 0.99% to 2.61%, respectively. The signal-to-noise ratio for the LLOQ samples ranged from 154.199 to 309.893. For 25-desacetyl rifapentine, the inter-run accuracy and precision at LLOQ were 95.81% and 4.83%, respectively. The intra-run accuracy and precision at LLOQ varies from 95.32% to 96.18% and from 3.24% to 6.90%, respectively. The signal-to-noise ratio for the LLOQ samples ranged from 706.054 to 2572.555.
Matrix effect
For rifapentine, the percentage accuracy at high and low-quality control levels was 92.75% and 97.73%. The percentage coefficient of variation (%CV) at HQC and LQC levels was 0.74% and 4.37%. These values fell within the acceptance limits. For 25-desacetyl rifapentine, the percentage accuracy at HQC and LQC levels was 99.67% and 101.47%, respectively. The %CV at high and low-quality control levels was 2.16% and 1.31%, respectively.
Precision and accuracy
Rifapentine
Intra-run
The intra run precision (%CV) for high, median, low QC, and DIQC samples ranged from 0.91% to 2.01%, 1.37% to 2.59%, 1.98% to 2.78%, and 2.14% to 3.61%, respectively.
The intra run accuracy for these samples ranged from 95.54% to 98.14%, 96.60% to 99.46%, 96.13% to 98.62%, and 99.12% to 100.70%, respectively. For the LLOQQC, intra-run precision varies from 0.96% to 2.03%, and accuracy varies from 95.57% to 103.34%.
Inter-run
The inter run %CV for high, median, low QC, and DIQC quality samples was 1.83%, 2.50%, 2.60%, and 3.05%, respectively. The inter-run accuracy for these samples was 96.48%, 98.36%, 97.47%, and 100.04%, respectively. For the LLOQQC, inter-run precision was 3.66%, and accuracy was 99.69%. Results are as shown in Table 1a.
 | Table 1(a). Intra run and Inter run precision and accuracy of rifapentine. [Click here to view] |
25-Desacetyl Rifapentine
Intra-run
The intra run %CV for high, median, low QC, and DIQC samples varies from 2.21% to 7.03%, 5.51% to 7.20%, 3.91% to 5.17%, and 3.96% to 5.10%, respectively. The intra-run accuracy for these samples ranged from 95.23% to 101.03%, 97.84% to 101.59%, 95.16% to 100.09%, and 98.17% to 101.75%, respectively. For the LLOQQC, intra-run precision varies from 2.33% to 5.57%, and accuracy varies from 90.42% to 100.49%.
Inter-run
The inter run %CV for high, median, low QC, and DIQC quality samples was 5.19%, 6.12%, 4.84%, and 4.68%, respectively. The inter-run accuracy for these samples was 97.98%, 99.82%, 97.40%, and 100.45%, respectively. For the LLOQQC, inter-run precision was 5.84%, and accuracy was 95.65%. Results are as shown in Table 1b.
 | Table 1(b). Precision and accuracy of 25-desacetyl rifapentine. [Click here to view] |
Recovery
Rifapentine
% Recovery for rifapentine at high, median, and low QC levels were 73.32%, 71.27%, and 68.50%, respectively. The % CV for extracted sample responses at high, median, and low QC levels were 4.76%, 2.50%, and 4.17%, respectively. The % CV for post-extracted sample responses at high, median, and low QC levels was 1.54%, 1.56%, and 1.82%, respectively. Global recovery and % CV for rifapentine was 71.03% and 3.41%, respectively. The % recovery for rifapentine D9 at high, median, and low QC levels were 73.29%, 71.47%, and 68.86%, respectively. The %CV for extracted sample responses at high, median, and low QC levels was 4.02%, 2.57%, and 3.75% respectively. The %CV for post-extracted sample responses at HQC, MQC, and LQC levels was determined to be 1.96%, 1.84%, and 1.93%, respectively. Global recovery and % CV for rifapentine D9 were found to be 71.21% and 3.13%, respectively.
25-Desacetyl rifapentine
% Recovery for 25-desacetyl rifapentine at HQC, MQC, and LQC levels were 72.57%, 71.89%, and 68.67%, respectively. The % CV for extracted sample responses at high, median, and low QC levels were 5.05%, 4.44%, and 6.23%, respectively. The % CV for post- extracted sample responses at HQC, MQC, and LQC levels was 4.30%, 3.17%, and 5.65%, respectively. Global recovery and % CV for 25-desacetyl rifapentine were 71.04% and 2.93%, respectively. The % recovery for 25-desacetyl rifapentine D8 at HQC, MQC, and LQC levels were 76.32%, 74.75%, and 65.30%, respectively. The %CV for extracted sample responses at high, median, and low QC levels was 6.06%, 2.62%, and 4.06%, respectively. The %CV for post-extracted sample responses at high, median, and low QC levels was determined to be 5.93%, 3.75%, and 6.37%, respectively. Results are presented in Table 2. Global recovery and % CV for 25-desacetyl rifapentine D8 were determined to be 72.12% and 8.27%, respectively.
 | Table 2. Recovery of rifapentine. [Click here to view] |
Dilution integrity
Rifapentine
The % accuracy of the dilution integrity with 1/10th and 1/5th dilution were 99.12% and 97.59%, respectively. The precision of the dilution integrity samples at 1/10th and 1/5th dilution were 3.54% and 2.35%, respectively.
25-Desacetyl rifapentine
The % accuracy of the dilution integrity with 1/10th and 1/5th dilution was 98.17% and 95.15%, respectively, which were within the acceptance limits. The %CV of the dilution integrity at 1/10th and 1/5th dilution is 4.84% and 3.36%, respectively, also within the acceptance limit. These results show the reliability and accuracy of the analytical method for both rifapentine and 25-desacetyl rifapentine, even after dilution, ensuring the validity of the measurements for samples with varying concentrations.
Stability in solution
Short-term stability in solution
Rifapentine (stock solution)
Stock solution stability at ULOQ and LLOQ levels was demonstrated for a duration of 07 hours and 13 minutes in ice bath. The % change at ULOQ and LLOQ levels was found to be −1.49% and −0.20%, respectively.
Rifapentine (spiking solution)
Spiking solution stability at ULOQ and LLOQ levels was demonstrated for a duration of 07 hours and 15 minutes in ice bath. % Change at ULOQ and LLOQ levels for was found to be 0.19% and −0.68%, respectively.
Rifapentine D9 (stock solution)
Stock solution stability for rifapentine D9 was demonstrated for a period of 07 hrs and 13 minutes in ice bath. % Change was found to be −0.31%.
Rifapentine D9 (spiking solution)
Spiking solution stability for rifapentine D9 was demonstrated for a period of 07 hours and 13 minutes in ice bath. % Change was determined to be −1.04%.
25-Desacetyl rifapentine (stock solution)
Stock solution stability at ULOQ and LLOQ levels for 25-desacetyl rifapentine was demonstrated for a period of 07 hours and 16 minutes in ice bath. % Change at ULOQ and LLOQ level was determined to be −1.06% and 0.24%, respectively.
25-Desacetyl rifapentine (spiking solution)
Spiking solution stability at ULOQ and LLOQ levels for 25-desacetyl rifapentine was demonstrated for a period of 07 hours and 15 minutes in ice bath. % Change at ULOQ and LLOQ was determined to be 1.12% and 0.24%, respectively.
25-Desacetyl rifapentine D8 (stock solution)
Stock solution stability for 25-desacetyl rifapentine D8 was demonstrated for a period of 07 hours and 15 minutes in ice bath. % Change was found to be −0.19%.
25-Desacetyl rifapentine D8 (spiking solution)
Spiking solution stability for 25-desacetyl rifapentine D8 was demonstrated for a period of 07 hours and 03 minutes in ice bath. % Change was determined to be −0.92%.
Long-term stability in solution
Rifapentine
Stock solution
Long-term stability at the ULOQ and LLOQ levels was demonstrated for 13 days, 21 hours, and 58 minutes at 2ºC–8°C. The % change was −1.48% and 0.94%, respectively.
Spiking solution: Long-term stability at ULOQ and LLOQ levels was demonstrated for the same period and conditions. The % change was −1.31% and 2.50%, respectively.
Rifapentine D9
Stock solution: Long-term stability was demonstrated for the same period and conditions. The % change was found to be −0.44%.
Spiking solution
Long-term stability was demonstrated for the same period and conditions. The % change was found to be 2.27%.
25-Desacetyl rifapentine
Stock solution: Long-term stability at ULOQ and LLOQ levels was demonstrated for the same period and conditions. The % change was 1.81% and −4.06%, respectively.
Spiking solution: Long-term stability at ULOQ and LLOQ levels was demonstrated for the same period and conditions. The % change was −0.52% and 0.20%, respectively,
25-Desacetyl rifapentine D8
Stock solution: Long-term stability was demonstrated for the same period and conditions. The % change was found to be −1.48%.
Spiking solution: Long-term stability was demonstrated for the same period and conditions. The % change was found to be 5.31%.
Rifapentine & 25-Desacetyl rifapentine stability in biological matrix
Bench top stability
% Accuracy for rifapentine at high and low-quality control levels were 100% and 98.71%. % CV at HQC and LQC levels were 1.43% and 1.63% which fall within the acceptance limit.
% Accuracy for 25-Desacetyl rifapentine at HQC and LQC levels were 101.44% and 101.48%. % CV at HQC and LQC levels were 3.86% and 6.16% which were within the acceptance limit. Results are indicated in Table 3a and b.
 | Table 3 (a). Stability data for rifapentine. [Click here to view] |
 | Table 3 (b). Stability data for 25-desacetyl rifapentine. [Click here to view] |
Auto sampler stability
%Accuracy for rifapentine at HQC and LQC levels were 97.94% and 96.62%, respectively. % CV at HQC and LQC levels were 3.33% and 1.46%, respectively, which fall under the acceptance limit.
% Accuracy for 25-Desacetyl rifapentine at HQC and LQC levels were 97.93% and 100.69%, respectively. % CV at HQC and LQC levels were 6.39% and 5.28%, respectively, which were within the acceptance limit. Results are indicated in Table 3a and b.
Reinjection reproducibility
%Accuracy for rifapentine at HQC, MQC, and LQC levels were 86.71%, 86.15%, and 87.42%, respectively. % CV at high, median, and low-quality control levels were 3.31%, 0.85%, and 1.65%, respectively.
%Accuracy for 25-desacetyl rifapentine at HQC, MQC, and LQC levels were 95.48%, 95.28%, and 90.51%, respectively. % CV at high, median, and low-quality control levels were 4.64%, 4.51%, and 5.40%, respectively, which were within the acceptance limit. Results are indicated in Table 3a and b.
Dry extract stability
% Accuracy for rifapentine at HQC and LQC levels were 99.69% and 96.91%, respectively. % CV at HQC and LQC levels were 4.05% and 1.42%, respectively, which was in the acceptance limit.
% Accuracy for 25-desacetyl rifapentine at HQC and LQC levels were 100.20% and 94.36%, respectively. % CV at HQC and LQC levels were 3.93% and 5.51%, respectively, which were within the acceptance limit. Results are indicated in Table 3a and b.
Freeze–thaw stability
Freeze–thaw stability (–20ºC ± 5ºC)
% Accuracy for rifapentine after five freeze, thaw cycles at HQC and LQC levels at –20ºC ± 5ºC were 99.50% and 99.01%, respectively. % CV at HQC and LQC levels were 2.75% and 1.45%, respectively, which fall in the acceptance limit.
% Accuracy for 25-desacetyl rifapentine after five freeze-thaw cycles at HQC and LQC levels at –20ºC ± 5ºC were 106.82% and 100.31%, respectively. % CV at HQC and LQC levels were 5.06% and 4.50%, respectively, which is in the acceptance limit. Results are indicated in Table 3a and b.
Freeze–thaw stability (–75ºC ± 10ºC)
% Accuracy for rifapentine after 5 freeze thaw cycles at HQC and LQC levels at –75ºC ± 10ºC were 101.03% and 99.84%, respectively. % CV at HQC and LQC levels were 2.00% and 2.12%, respectively, which were within the acceptance limit.
% Accuracy for 25-desacetyl rifapentine after 5 freeze thaw cycles at HQC and LQC levels at −75ºC ± 10ºC were 101.99% and 100.81%, respectively. % CV at HQC and LQC levels were 6.01% and 5.79%, respectively, which were within the acceptance limit. Results are indicated in Table 3a and b.
Wet extract stability
At room temperature
% Accuracy for rifapentine at HQC and LQC levels at RT was 98.10% and 101.67%, respectively. % CV at HQC and LQC levels was 2.72% and 2.17%, respectively, which were within the acceptance limit.
% Accuracy for 25-desacetyl rifapentine at HQC and LQC level at 2ºC–8?C was 103.71% and 94.32%, respectively, and % CV at HQC and LQC level was 7.51% and 3.95, respectively, were in the acceptance limit. Results are indicated in Table 3a and b.
At 2ºC–8?C
% Accuracy for rifapentine at HQC and LQC levels at RT was 99.99% and 96.42%, respectively, and % CV at high and low QC levels was 1.56% and 1.32%, respectively, which were in the acceptance limit.
% Accuracy for 25-desacetyl rifapentine at HQC and LQC level at 2ºC–8?C was 98.54% and 103.12%, respectively, and % CV at HQC and LQC level was 5.65% and 6.49%, respectively, which were within the acceptance limit. Results are indicated in Table 3a and b.
Stability of whole blood
% Change for rifapentine at HQC and LQC level at RT were 0.00% and 1.90%, respectively. % Coefficient variations at HQC and LQC levels were 1.49% and 3.26%, respectively, was in the acceptance limit. % Change for 25-desacetyl rifapentine at HQC and LQC level at RT were −2.09% and −3.57%, respectively, % CV at HQC and LQC level were 2.29% and 2.33%, respectively, which were within the acceptance limit.
Batch determination
Rifapentine
For the high, median, and low QC samples, the accuracy was 101.77%, 102.62%, and 98.14%, respectively, all within the acceptance limits. The precision values for HQC, MQC, and LQC quality control samples were 2.66%, 2.48%, and 2.89%, respectively, all within the acceptance limit.
25-Desacetyl rifapentine
The accuracy for high, median, and low QC samples was 101.06%, 103.04%, and 100.93%, respectively, all within the acceptance limits. The precision for HQC, MQC, and LQC quality control samples was 6.59%, 5.58%, and 5.56%, respectively, all within the acceptance limit.
Application to bioequivalence study
The rifapentine and 25-desacetyl rifapentine, analytical method was developed and validated. It was effectively applied in a bioequivalence study. Approximately 1,110 plasma samples were analyzed from healthy, adult, male subjects. They were administered a single oral dose of rifapentine tablets, 150 mg manufactured by DelNova Healthcare LLP, India, compared to Priftin (Rifapentine) 150 mg Tablet manufactured by Sanofi-Aventis U.S. LLC, Bridgewater, NJ 08807, under fasting conditions. The study included analysis of concentration-time profiles for both rifapentine and 25-desacetyl rifapentine. It is depicted in linear and semi-log plots as seen in Figure 20 a, b, c, and d. The calculated 90% confidence intervals for the relative mean Cmax, AUC0-t, and AUC (0-inf) of the test and reference products fell within the bioequivalency criterion of 80%–125%. The Ln-transformed data are shown in Table 4. This led to the conclusion that, following a single oral dose administration in fasting conditions, healthy adult male subjects exhibited bioequivalence in response to 150 mg rifapentine tablets from DelNova Healthcare LLP, India, and 150 mg Priftin (Rifapentine) tablets from Sanofi-Aventis, U.S. LLC, Bridgewater, NJ 08807.
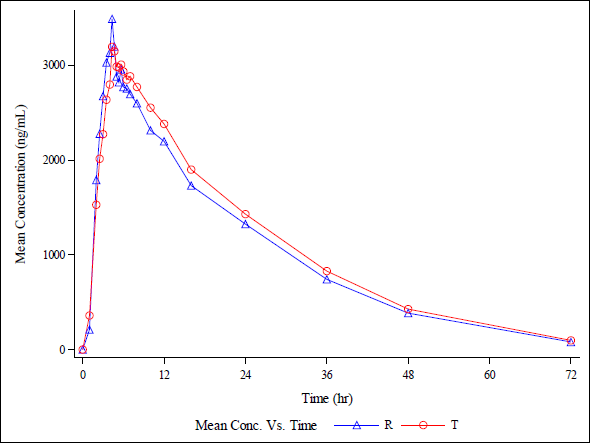 | Figure 20(a). Linear plot of average plasma concentrations v/s time for Test product (T) and Reference product (R) in 18 healthy, adult, human male subjects under fasting condition for analyte (Rifapentine ). [Click here to view] |
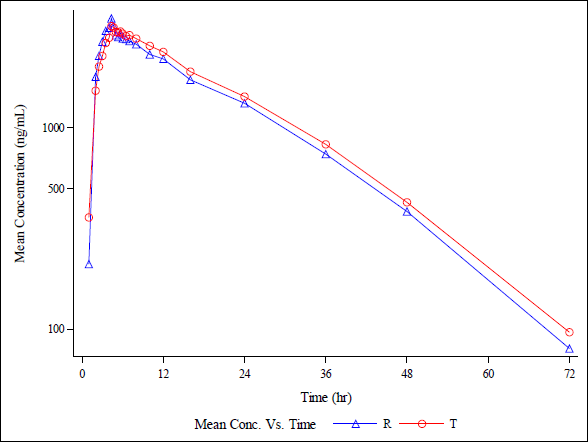 | Figure 20(b). Semi-log plot of average plasma concentrations v/s time for T and R in 18 healthy, adult, human male subjects under fasting condition for analyte (Rifapentine ). [Click here to view] |
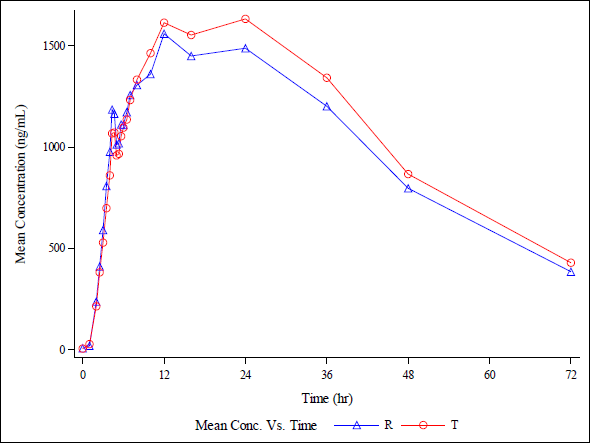 | Figure 20(c). Linear plot of average plasma concentrations v/s time for test product and rteference product in 18 healthy, adult, human male subjects under fasting condition for metabolite (25-Desacetyl Rifapentine ). [Click here to view] |
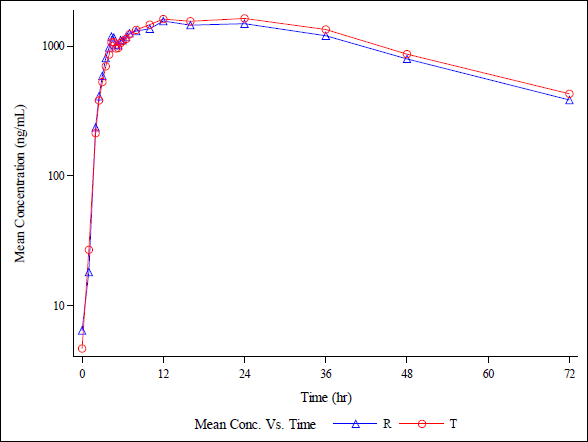 | Figure 20 (d). Semi-log plot of the average plasma concentrations over time for the T and R in 18 adult male, healthy human participants during a fast for Metabolite (25-Desacetyl Rifapentine ). [Click here to view] |
 | Table 4. Geometric least squares mean, ratios, 90% confidence interval, ISCV% and power of analyte (rifapentine). [Click here to view] |
DISCUSSION
The LC-MS-MS method that was used in the present study has a number of benefits for measuring rifapentine in human plasma. Our technique has a LLOQ of 50 ng/ml. Our technique demonstrates excellent sensitivity, allowing for accurate detection of rifapentine even at low concentrations. Furthermore, the method boasts a short runtime of 8 minutes per sample, making it efficient and appropriate for high-throughput analysis of several clinical samples. We achieved these results using conventional solvents, acetonitrile, and water, as mobile phase, along with a standard C18 column. This choice of materials enabled us to achieve the best possible sensitivity, acceptable resolution, and sufficient chromatographic separation of the analytes while maintaining a rapid analysis time. The developed analytical technique for rifapentine proved to be instrumental in the bioequivalence investigation of rifapentine tablet formulations, requiring the analysis of approximately 1,110 plasma samples. During this investigation, we assessed several methods for preparing samples, one of which is the liquid-liquid extraction (LLE) approach was evaluated. Our findings indicate that the LLE approach exhibited consistent and high recovery rates for the analyte. Among the different testing solvents investigated for the LLE process, we observed that the extraction efficiency was highest using ethyl acetate. This highlights the effectiveness of the LLE approach in extracting rifapentine from plasma samples, ensuring reliable and accurate quantification in the bioequivalence study. Overall, the present assessment underscores the importance of selecting an appropriate sample preparation technique to achieve optimal recovery and reliability in analytical measurements, ultimately contributing to the success of bioequivalence investigations for rifapentine tablet formulations.
CONCLUSION
The combination of simplicity, speed, accuracy, and reproducibility in our newly developed analytical method for rifapentine makes it exceptionally well-suited for applications like bioavailability and bioequivalence studies. With the ability to efficiently and reliably analyze large nos. of samples, our method can provide valuable insights into the pharmacokinetics and bioequivalence of rifapentine formulations. This could ultimately contribute to improved drug development and patient care. Overall, our newly developed analytical method for rifapentine offers simplicity, speed, accuracy, and reproducibility, making it highly suitable for applications such as bioavailability and bioequivalence studies where large numbers of clinical samples need to be analyzed efficiently and reliably.
AUTHOR CONTRIBUTIONS
All authors made substantial contributions to conception and design, acquisition of data, or analysis and interpretation of data; took part in drafting the article or revising it critically for important intellectual content; agreed to submit to the current journal; gave final approval of the version to be published; and agree to be accountable for all aspects of the work. All the authors are eligible to be an author as per the International Committee of Medical Journal Editors (ICMJE) requirements/guidelines.
FINANCIAL SUPPORT
There is no funding to report.
CONFLICTS OF INTEREST
The authors report no financial or any other conflicts of interest in this work.
ETHICAL APPROVALS
Bioequivalency investigation protocol was approved by Skinovate Independent Ethics Committee (CNR-P-009-23 Dated 20/06/2023).
DATA AVAILABILITY
All data generated and analyzed are included in this research article.
PUBLISHER’S NOTE
This journal remains neutral with regard to jurisdictional claims in published institutional affiliation.
REFERENCES
1. Alsultan A, Peloquin CA. Therapeutic drug monitoring in the treatment of tuberculosis: an update. Drugs. 2014;74:839–54. CrossRef
2. World Health Organization. Global tuberculosis report 2020: executive summary. In global tuberculosis report 2020: executive summary. Geneva, Switzerland: World Health Organization; 2020.
3. Deanasa RS, Simanjuntak AM, Syafira F, Afladhanti PM, Hawari A, Riviati N. Efficacy and safety rifapentine -containing regimen for drug sensitive tuberculosis: systematic review and meta-analysis. Pneumon. 2024;37(2):22. CrossRef
4. Winters N, Belknap R, Benedetti A, Borisov A, Campbell JR, Chaisson RE, et al. Completion, safety, and efficacy of tuberculosis preventive treatment regimens containing rifampicin or rifapentine: an individual patient data network meta-analysis. Lancet Respir Med. 2023;11(9):782–90. CrossRef
5. Mathad JS, Savic R, Britto P, Jayachandran P, Wiesner L, Montepiedra G, et al. Pharmacokinetics and safety of 3 months of weekly rifapentine and isoniazid for tuberculosis prevention in pregnant women. Clin Infect Dis. 2022;74(9):1604–13. CrossRef
6. Parsons TL, Marzinke MA, Hoang T, Bliven-Sizemore E, Weiner M, Mac Kenzie WR, et al. Quantification of rifapentine, a potent antituberculosis drug, from dried blood spot samples using liquid chromatographic-tandem mass spectrometric analysis. Antimicrob Agents Chemother. 2014;58(11):6747–57. CrossRef
7. Li Q, Xu Q, Lo N, Leeks Jr AT, Han M, Nefliu M, et al. Mitigating matrix effects for LC-MS/MS quantification of nitrosamine impurities in rifampin and rifapentine. J Pharm Biomed Anal Open. 2024;3:100027 CrossRef
8. Mkhize B, Kellermann T, Norman J, Castel S, Joubert A, van der Merwe M, et al. Validation and application of a quantitative liquid chromatography tandem mass spectrometry assay for the analysis of rifapentine and 25-O-desacetyl rifapentine in human milk. J Pharm Biomed Anal. 2022;215:114774. CrossRef
9. Fage D, Brilleman R, Deprez G, Payen MC, Cotton F. Development, validation and clinical use of a LC-MS/MS method for the simultaneous determination of the nine main antituberculosis drugs in human plasma. J Pharm Biomed Anal. 2022;215:114776. CrossRef
10. Govender K, Adamson JH, Owira P. The development and validation of a LC-MS/MS method for the quantitation of metformin, rifampicin and isoniazid in rat plasma using HILIC chromatography. J Chromatogr B Analyt Technol Biomed Life Sci. 2018;1095:127–37. CrossRef
11. US Food and Drug Administration (FDA) guidance for the validation of bioanalytical methods. 2018 [cited 2024 Jul 10]. Available from: https://www.fda.gov/regulatory-information/search-fda-guidance-documents/bioanalytical-method-validation-guidance-industry
12. Kole PL, Venkatesh G, Kotecha J, Sheshala R. Recent advances in sample preparation techniques for effective bioanalytical methods. Biomed Chromatogra. 2011;25(1-2):199–217 CrossRef
13. ICH guidelines M10: Bioanalytical method valdation and study sample analys. 2022 [cited 2024 Jul 10]. Available from: https://www.gmp-compliance.org/gmp-news/ich-m10-guideline-on-bioanalytical-method-validation-and-study-sample-analysis#:~:text=The%20ICH%20M10%20guideline%20provides,and%20efficacy%20of%20medicinal%20products
14. Kuhlin J, Sturkenboom MG, Ghimire S, Margineanu I, Van den Elsen SH, Simbar N, et al. Mass spectrometry for therapeutic drug monitoring of anti-tuberculosis drugs. Clin Mass Spectrometry. 2019;14:34–45. CrossRef
15. Goodyear MD, Krleza Jeric K, Lemmens T. The declaration of Helsinki. BMJ. 2007;335(7621):624–5. CrossRef