INTRODUCTION
Peptic ulcer disease (PUD) refers to acid-induced lesions in any part of the gastrointestinal tract (GIT) mainly the stomach and duodenum which further invade the mucosal, submucosal, and outer muscular layers leading to the gastric wall perforation thereby causing death in severe cases. Excessive pepsin secretion and an acidic environment cause mucosal damage by increasing the abrasive action of gastric acid secretion, which is caused by a disparity between the mucosa’s protective factors and aggressive components [1,2]. The most frequent and serious complication of peptic ulcers is GIT bleeding. In some cases, liver dysfunction and coagulation are also associated with it. Generally, the stomach curvature and the proximal part of the duodenum are more prone to such kind of injury. However, peptic ulcer may also persist in the lower portion of the oesophagus, the distal part of the duodenum, and the stomach jejunum [3]. Risk factors include alcohol intake, tobacco consumption, H. pylori infection, and non-steroidal anti-inflammatory drugs overuse in the healthcare system [4]. In patients of age 55–65 years, the duodenal ulcer is very common, while the gastric ulcer is more common in men of age 25–30 and women of age 40–45. Gastric ulcers were more common than duodenal ulcers [5]. The primary interventions used in the management of PUD are conventional medical therapy through the oral route such as antibiotics, histamine H2-receptor antagonists, cytoprotective drugs, and proton pump inhibitors [6]. But for some drugs in conventional dosage form, a major drawback is poor absorption and oral bioavailability which can pose serious challenges in the treatment and management of peptic ulcers. To address the shortcomings of conventional oral dosage forms, numerous novel oral dosage forms have been developed by formulation scientists. Among numerous novel drug delivery system approaches, nanosponges (NSs) are emerging novel nanocarriers with a size range of less than 1,000 nm and three-dimensional structure formed by crosslinking polymers and are better than alternative delivery methods because they can administer drugs with targeted delivery and controlled release pattern. The porous nature of NSs is due to spongy spheres that have innumerable interconnected empty spaces termed voids. These voids entrap a wide variety of small drug molecules that are poorly water-soluble and encompass them in matrix structure thereby improving their oral bioavailability. NSs are used to overcome the problems of all biopharmaceutical classification system (BCS II, IV) drugs which possess problems of low solubility, low permeability, and low oral bioavailability [7,8]. NSs can be employed for site-specific drug delivery, reducing redundant exposure of the drug to tissue, hence possibly reducing systemic side effects, and causing the reduction in therapeutic doses [8]. For improving oral bioavailability and therapeutic efficacy, NSs formulation for many drugs are reported in the scientific literature for example lansoprazole [9,10], celecoxib [11], imatinib [12], paliperidone [13], insulin [14], griseofulvin [15], clobetasol propionate [16], chitosan [17], resveratrol [18], olmesartan medoxomil [8], α-Mangostin [19], budesonide [20], lafutidine [21], lapatinib [22], docetaxel [23], naringenin [24], nimesulide [25], and abemaciclib [26] were reported.
Famotidine (FAM), an H2-receptor antagonist, is a BCS class IV drug (low solubility and low permeability) used to treat peptic ulcers and is available in the form of a conventional tablet in the market. Oral bioavailability of FAM has been reported to be very low (40%–50%) due to poor aqueous solubility and gastric degradation [27,28]. There is a need to explore novel drug delivery approaches for enhancing the therapeutic potential of FAM. So, the present investigation focused on the development of ethyl cellulose (EC)-based FAM-loaded NSs to sustain the release of the drug and enhance its oral bioavailability for the effective treatment of peptic ulcers.
MATERIALS AND METHODS
Materials
FAM was procured as a gift sample from Innova Captab, Baddi, Solan, Himachal Pradesh. EC (18–22 cps), dichloromethane were purchased from Loba chemical Pvt. Ltd., Mumbai while polyvinyl alcohol (PVA) was purchased from Molychem. Analytical-grade chemical reagents were all that were employed in the current study.
Methods
High-performance liquid chromatography (HPLC) method of analysis for FAM
For the HPLC analysis of FAM, an already reported HPLC method was employed. Analytical HPLC (Agilent 1200) method with Supelcosil LC18 column at room temperature, mobile phase consisted of acetonitrile (ACN) and sodium dihydrogen orthophosphate buffer (25:75 v/v) at a flow rate of 0.5 ml/minute used for the determination of FAM. Analysis of FAM was carried out for the run time of 10 minutes at a wavelength of 265 nm and the injection volume was 5 µL. Different concentrations of FAM such as 1, 2, 4, 6, 8, 10, and 15 µg/ml were used for making the calibration curve of FAM, respectively [29,30].
Formulation of FAM-loaded NSs
FAM-loaded NSs were prepared by the already reported emulsion solvent evaporation method [23,27,31]. Two phases were prepared in which the organic phase contained an accurately weighed amount of FAM (40 mg), EC dissolved in 10 ml of dichloromethane, and the aqueous phase was prepared by adding 0.2% w/v PVA in distilled water. Further, the organic phase was emulsified slowly into the aqueous phase by using ultra-probe sonication (Cole-Parmer Ultrasonic) at 60% amplitude for 3 minutes. Colloidal dispersions of nanomaterial formed were then kept on a magnetic stirrer with continuous stirring at 700 rpm for 12 hours under atmospheric conditions. Following complete evaporation of organic solvents, colloidal dispersion was washed three consecutive times with distilled water to clear away the absorbed PVA. Then it was further ultracentrifuged at 12,000 rpm for 30 minutes to get a clear supernatant. The sediment was then recovered and washed three times with deionized water. Finally, FAM-loaded NSs slurry was dried in an oven at 40?C for 12 hours and kept in glass vials for further evaluation [7, 25].
Characterization of FAM-loaded NSs
Percentage yield (%)
All formulations of FAM-loaded NSs were accurately weighed. The percentage yield for NSs was calculated as per the following equation [32]:
Entrapment efficiency (%EE)
The freshly prepared FAM-loaded NSs containing an equivalent dose of FAM were centrifuged at 10,000 rpm for 15 minutes. The supernatant was taken out for free drug analysis after centrifugation. The free FAM existing in the supernatant was determined by the HPLC method at λmax of 265 nm. The % entrapment efficiency was calculated by the given formula [31,33,34]:
Particle size, polydispersity index (PDI), and zeta potential determination
Particle sizes, PDI, and zeta potential of FAM-loaded NSs formulations were determined by using Zetasizer (Litesizer 500). All the samples were suitably diluted with distilled water in the ratio of 1:100 and sonicated for 5 minutes to avoid particle agglomerates. The mean hydrodynamic diameter, PDI, and zeta potential of particles were analyzed by Zetasizer [31].
In vitro drug release studies
In vitro release profiles of FAM-loaded NSs and pure powdered drug were carried out using a USP type II apparatus (Electrolab dissolution tester) [25,31]. Pure drug and NSs formulation containing an equivalent dose of FAM was accurately weighed and filled into a hard gelatin capsule shell and transferred into 900 ml of dissolution media containing 0.1N HCL for an initial 2 hours at 37?C ± 0.5?C in USP II apparatus operated at a constant rotation speed of 100 rpm. After 2 hours, acidic media was replaced by phosphate buffer (pH 6.8). At fixed time intervals, 1 ml of aliquots were withdrawn and replaced with freshly prepared dissolution media to maintain the sink conditions. The samples were filtered (pore size 0.45 μm membrane filter) and the drug was analyzed in aliquots using HPLC method at λmax of 265 nm. All the studies were performed in triplicate [25,31]. Data were represented as % cumulative drug release versus time graph. Moreover, drug release data of FAM-loaded NSs were fitted to different kinetic models such as zero-order release first-order, Higuchi–Connors, Korsmeyer–Peppas, and Hixon-Crowell model using add-in program DD Solver to study the drug release mechanism from the formulations [31,34]. Based on results of entrapment efficiency, particle size, PDI, and % drug release of formulations, the optimized NSs were chosen for further in vitro evaluation which includes surface morphology field-emission scanning electron microscopy (FE-SEM), X-ray diffractometry (XRD), and differential scanning electron microscopy differential scanning calorimeter (DSC) and in vivo studies.
Characterization of optimized formulation
Field-emission scanning electron microscopy
The surface morphological study of optimized FAM-loaded NSs was performed using FE-SEM (JSM-IT800). The sample was placed in a sample holder pre-coated by a gold sputtering technique. By using a fine beam of electrons, the test samples were scanned to obtain the morphological images [22,35].
Differential scanning calorimetry
The thermal activity of FAM, excipients, and optimized NS formulation as a function of temperature were examined utilizing a DSC (SETLINE DSC+). The instrument was calibrated with indium for melting point and heat of fusion. The sample was heated at a rate of 10?C/minute in the 100?C–300?C temperature range. Standard aluminum sample pans were employed and an empty pan was used as reference standard [9,22].
X-ray diffraction
XRD studies were carried out to evaluate the samples physical characteristics and determine if the substance is in an amorphous or crystalline form. X-ray diffraction patterns of pure drug, excipient, and optimized FAM-loaded NSs formulation were carried out using X-ray diffractometer (X’Pert Pro) [22,36].
In vivo studies
The animal studies were performed with prior approval of the Institutional Animal Ethics Committee (IAEC), School of Pharmaceutical Sciences, Shoolini University of Biotechnology and Management Science, duly approved for the purpose of control and supervision of experiments on animals by the Government of India, (IAEC/SU/22/23). The research was carried out following the Committee for the Purpose of Control and Supervision of Experiments on Animals recommendations. All animals were acclimatized for seven days under standard husbandry conditions of temperature (22?C + 2?C), relative humidity (45%–65%), and a 12-hour light/12-hour dark cycle. The rats were fed regular rat pellets and were given unlimited access to water under strict hygienic guidelines. Male Wistar rats of 300–350 g weight were employed in the study. Optimized formulation containing an equivalent animal dose was administered to the rats by using an oral cannula.
Pharmacokinetic (PK) studies
The Wistar rats were divided into two groups (Group I and Group II), with each group including four rats (n = 4). Pure drug solution (3.6 mg/kg animal dose) was given to group I. Optimized FAM-loaded NSs formulation containing an equivalent dose of the drug (3.6 mg/kg animal dose) was administered orally to group II. Blood samples were collected from retro-orbital vein of each rat after drug administration at specific time intervals (30 minutes, 1, 2, 4, 8, 12 hours) after dosing. The supernatant was collected after the blood samples were centrifuged for 10 minutes at 4°C at 4,000 rpm [22,37]. The FAM in each sample was extracted with ACN followed by centrifugation. FAM concentration in plasma samples was determined by using the HPLC method. The PK parameters [Cmax, Tmax and area under the curve (AUC)] were further determined using the add-in program PK Solver [38].
Antiulcer study [ulcer index (UI)]-alcohol-induced ulcer model
The animal model of alcohol-induced stomach ulcers is similar to human acute gastric ulcers [39,40]. Animals were fed ethanol to cause ulcers by fasting them for 24–36 hours. Absolute ethanol was administered at a dose of 5 ml/kg body weight to each animal. It was suggested that for each study, a preliminary assessment should be done to govern the effective dose of ethanol required for optimum induction of ulcers [41]. Total four groups of Wistar rats were taken having four animals in each group (n = 4 each). In group 1 (normal control group), healthy rats were kept as control and no treatment was given. In group 2, rats were administered orally with a 5 ml/kg dose of absolute ethanol for inducing ulcers [ulcer control (UC) group]. Group 3 (UC + FAM solution) rats with induced ulcers were treated with pure FAM solution (3.6 mg/kg oral dose). Group 4 rats (UC + NS) with induced ulcers were treated with optimized formulation of FAM-loaded NSs. FAM-loaded NSs formulation and pure FAM solution were administered to the rats orally once daily for 7 days [42]. All animals were euthanized by decapitation after 24 hours of administration of the last dose. The stomach was dissected and opened along the greater curvature, and the mucosal surface of the stomach of each animal was washed with saline solution to determine the UI [38,41]. Photographic images of the stomach mucosal surface were obtained using a digital camera, and the total mucosal area and ulcerated area were measured using Image J software. The formula used to get the UI is UI = Ulcerated area/ Total mucosal area × 100.
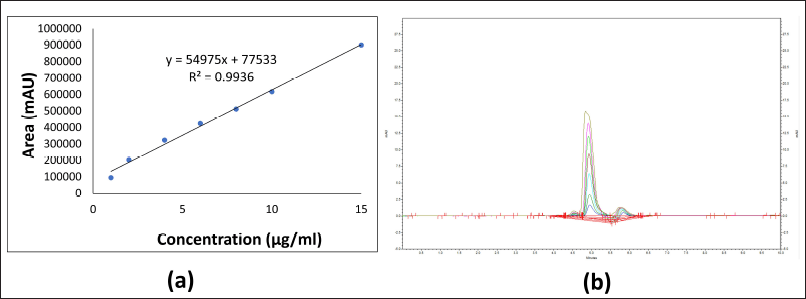 | Figure 1. (a) Standard calibration curve of FAM by HPLC method; (b) Overlay chromatogram of FAM. [Click here to view] |
 | Table 1. Composition and characterization of FAM-loaded NSs formulations (NS1–NS4). [Click here to view] |
Statistical analysis
Data were expressed as mean ± standard error (n = 4). Statistical Means were compared by one-way analyses of variance and post hoc Tukey’s multiple comparisons which were performed using the GraphPad Prism (version 8.0.1 GraphPad Software Inc., La Jolla, CA) to evaluate the differences in all biochemical parameters. Differences were considered significant if p < 0.05.
RESULTS AND DISCUSSION
HPLC method of analysis for determination of FAM
The standard calibration curve of FAM was plotted between peak area vs concentration using serially diluted known concentration (1–15 µg/ml) of FAM by using the HPLC method. Standard curve was found to be linear with correlation coefficient (R2) value of 0.9936 as shown in Figure 1a. FAM showed a sharp peak at a retention time of 4.9 minutes as shown in overlay chromatogram in Figure 1b.
Formulation and characterization of drug-loaded NSs
Four FAM-loaded NSs formulations (NS1–NS4) were prepared with different ratios of EC by emulsion solvent evaporation method (Table 1). The percentage yield for all the NSs formulation was found to be in the range of 60.46% to 87.64% (Table 1). With the increase in polymer concentration (EC), the yield of NSs was found to be increased [33]. The entrapment efficiency of formulations (NS1–NS4) was found to be in the range of 47.18%–66.41%. Formulation NS3 and NS4 showed highest entrapment efficiency of 66.59% and 66.41%, respectively. High entrapment was probably due to the presence of a high concentration of EC, hydrophobic cellulose derivate, as a polymer, i.e., 1.5% and 2% w/v. A higher concentration of EC increases the volume of complex formation for entrapping more drugs but it also increases the viscosity of the formulation because it also act as a thickening agent, which will eventually lead to the formation of agglomerates. So, an optimum concentration of polymer is required for the formation of a sponge-like structure with optimum viscosity. Formulation NS4 has a maximum concentration of EC (18–22 cps) (2% w/v) as compared to NS3 (1.5% w/v) due to which it is more viscous and tends to the formation of the agglomerate [32]. Particle size and PDI value for all formulations of FAM-loaded NSs were found to be in the range of 195.46–295.58 nm and 0.095–0.128, respectively, whereas zeta potential was found in the range of −14 to −20 mV. The negative sign indicates the stability of formulated NSs. The NSs surface acquires a negative charge as a result of ionization of hydroxyl or carboxyl groups present on the EC surface in aqueous environment. A particle size of less than 400 nm was thought to be optimal for the NSs formulation. However, a formulation is considered to be monodispersed if its PDI is less than 0.5 [22]. All the formulated NSs were found to be in nano-size range with narrow particle size distribution. Zeta potential of prepared systems was found to be negatively charged which indicates non-agglomeration and the formation of a stable dispersion system. The stability of the formulation is ensured by the inclusion of a PVA as a stabilizer.
In vitro drug release studies
In vitro release profiles of pure FAM and FAM-loaded NSs formulations (NS1–NS4) (n = 3) are presented in Figure 2. The content of EC (18–22 cps) in the formulation affects the drug release rate. NSs formulations exhibited a sustained release pattern for 12 hours drug release study. Slower rates of dissolution can result from hydrophobicity of EC, which prevents water from penetrating the NS matrix. Polyvinal alcohol (2% w/v), which acts as a crosslinking agent, also effects the dissolution process of the NSs as it determines the rigidity and porosity of the NSs structure. A structure with a higher cross-linking density is more compact and less porous, which may hinder the dissolution process. On the other hand, a structure with a lower cross-linking density can be more porous and dissolve more easily. In acidic media at pH 1.2 drug release for pure drug after 120 minutes was found to be 16.01% ± 0.38%, whereas for NS1, NS2, NS3, and NS4 it was 25.91% ± 0.58%, 44.88% ± 0.90%, 61.07% ± 0.49%, and 50.65% ± 0.34%, respectively. In contrast to this in phosphate buffer (pH 6.8), out of four formulations, NS3 showed maximum drug release of 76.75% ± 0.68% after 12 hours whereas plain drug showed 18.01% ± 0.82% drug release due to poor solubility and permeability. Also, NS3 formulation has the highest entrapment efficiency of 66.59% which could be a reason for maximum drug release. Lowest drug release (38.97% ± 0.02%) was found in NS1 which is due to the low concentration of EC polymer (18–22 cps) (0.5% w/v) which is not sufficient to form the sponge complex. The sustained release pattern of FAM-loaded NSs might be due to hydrophobic nature of EC which swells slowly upon contact with dissolution medium. Degree of swelling affects the rate at which drug dissolves. [26]. From the results, it can be concluded that the drug’s sustained release profile was due to the polymer EC, most likely as a result of the aqueous medium’s slower dispersion within the porous matrix. Moreover, EC is a non-toxic, hydrophobic, swellable, and viscous polymer appropriate for formulating sustained drug-release dosage forms [7]. Additionally, when NSs formulations were subjected to release kinetics studies, all the NSs formulations were found to demonstrate good linearity regression coefficient (R2) for the Korsmeyer-peppas model as compared to the Higuchi model, which reveals that the drug release mechanism is governed by the diffusion process (Table 2). The release exponent (n) for all the formulations was found to be less than 0.45 exhibiting drug release by Fickian diffusion. In conclusion, when release media enters the porous polymer matrix of NSs, it will allow the polymer to swell causing the slow diffusion of the drug out of the porous matrix [26]. Based on the results of percentage yield (87.64%), entrapment efficiency (66.59%), particle size (204.8 nm), zeta potential (−12.5 mV), and % drug release (76.75%), the FAM loaded NSs formulation NS3 was considered as optimized formulation and subjected further to in vitro and in vivo evaluations.
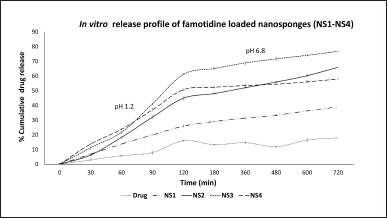 | Figure 2. In vitro drug release profile of FAM loaded NSs (NS1–NS4) and pure drug. [Click here to view] |
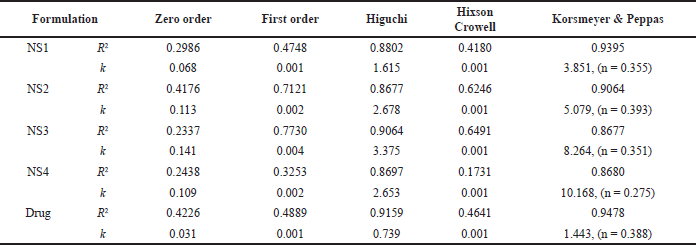 | Table 2. Correlation coefficient (R2) and rate constant of different kinetic models for FAM-loaded NSs formulations and pure drug. [Click here to view] |
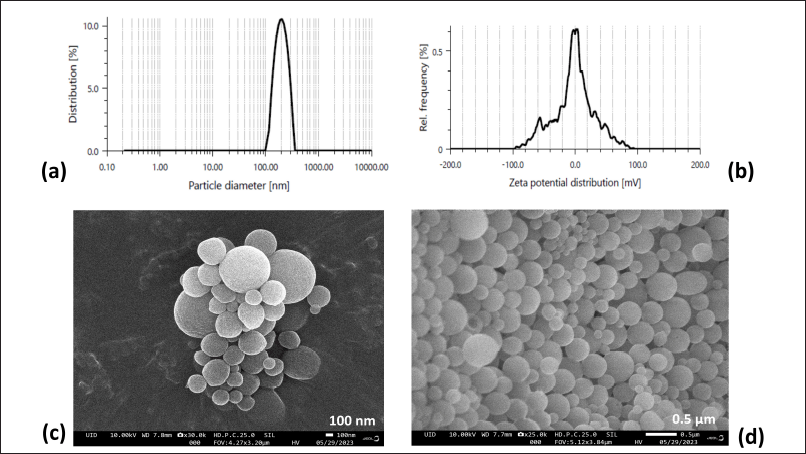 | Figure 3. (a) Particle size distribution, (b) Zeta potential and FE-SEM images of optimized FAM loaded NSs formulation (NS3) at scale of (c) 100 nm and (d) 0.5 µm. [Click here to view] |
In vitro evaluation of optimized FAM-loaded NSs
Field-emission scanning electron microscopy
The surface morphology of the optimized nanocarrier (NS3) is shown in Figure 3 which exhibited nanosized, spherical NSs with the spongy and homogenous surface. The particle size of NSs was observed in the nanometer range (Fig. 3a), confirmed by FE-SEM result (Fig. 3c and d), and also observed by the dynamic light scattering method [22].
DSC analysis
The DSC thermograms of pure FAM, EC polymer, and optimized NSs formulation (NS3) are represented in Figure 4. DSC thermogram of FAM demonstrated a sharp characteristic endothermic peak at 166.9?C corresponding to its melting point which signifies that the FAM used was in pure crystalline state. The thermogram of EC showed broad endothermic peaks at 45.26?C. DSC thermogram of NS3 formulation does not show the respective thermal peak of pure FAM. DSC results thus indicated that FAM was entirely encapsulated inside the spongy voids of the EC polymer matrix [43].
X-ray powder diffraction studies
XRD diffraction patterns of pure drug FAM revealed various characteristic sharp peaks at different angles. However, optimized NSs (NS3) demonstrated broad diffraction peaks, which indicates loss of drug crystalline nature due to the entrapment of FAM inside the polymer matrix. Also, the broadening or weak diffraction pattern of the drug in XRD analysis confirms the entrapment of FAM in the NSs. XRD patterns (Fig. 5) demonstrated that the polymer matrix was properly coated over the FAM and PVA was accountable for anti-adhesiveness between the particles and smooth surface of NS3 [31].
In vivo PK study of optimized FAM-loaded NSs
The oral bioavailability of optimized FAM-loaded NSs (NS3) was predicted by carrying out PK studies in male Wistar rats administered with a single oral dose. Comparative plasma drug concentration versus time graph is shown in Figure 6a. Non-compartmental extravascular analysis was accomplished for PK analysis. The linear trapezoidal method was applied to compute the AUC. The mean plasma concentration Cmax, AUC(0–12) for the pure drug was found to be 0.87 ± 0.19 μg/ml and 446.25 μg hour/ml at tmax of 120 minutes, respectively, whereas for NS3 it was found to be 1.55 ± 0.10 μg/ml and 760.50 μg hour/ml at tmax of 240 minutes, respectively. t1/2 for pure drug was 358.25 minutes whereas for NS3, it was found to be 382.85 minutes. PK analysis results presented that mean Cmax and AUC0–12 in the group administered with NS3 was 1.78 and 1.70 folds greater than the animal group administered with pure FAM, which showed improved oral bioavailability of FAM when loaded into NSs.
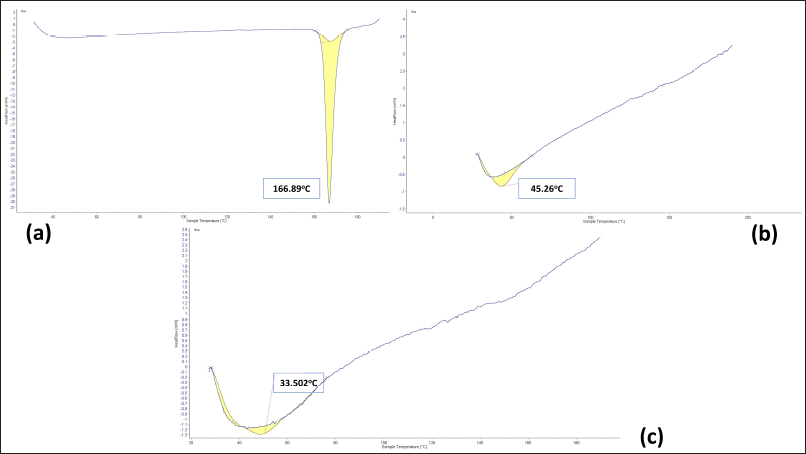 | Figure 4. DSC thermogram of (a) FAM (b) EC (c) Optimized NSs formulation NS3. [Click here to view] |
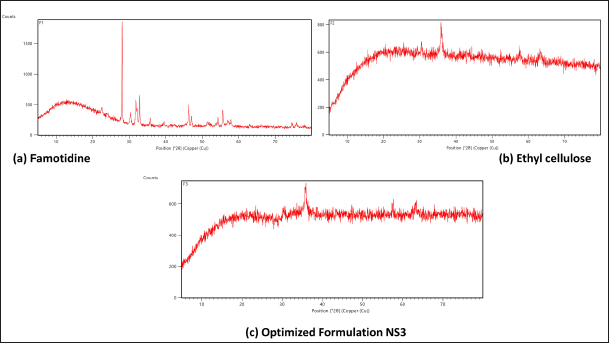 | Figure 5. Powder X-ray diffraction pattern of (a) FAM (b) EC (c) Optimized drug loaded NSs formulation NS3. [Click here to view] |
Ulcer index
Visually inspected stomach curvature in the UC group showed severe ulcer lesions and bleeding which is due to ethanol exposure to the stomach (Fig. 6d). Rats treated with pure FAM showed a very mild reduction in ulcer lesions as shown in Figure 6e as compared to the FAM-loaded NSs-treated group in which no remarkable lesion was seen (Fig. 6f). The ulcer healing efficacy of FAM-loaded NSs was further evaluated in terms of UI calculation. Gastric UIs calculated for groups 2, 3, and 4 were in the following order: NS3 (5.77% ± 0.69%) < FAM solution (19.23% ± 0.82%)
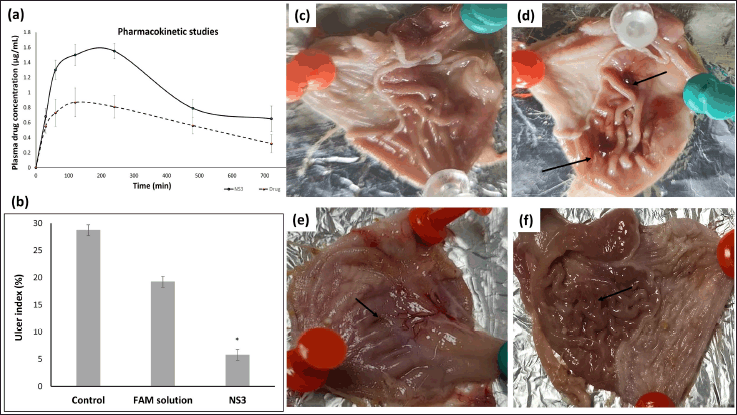 | Figure 6. (a) PK profile of pure drug and FAM loaded NSs formulation NS3 (mean ± SD, n = 4) following oral administration in rat; (b) Ulcers expressed as % UI in group 2, 3 and 4 (n = 4). After 7 days of treatment in group 3 (FAM sol) and 4 (NS3), there is a significant reduction in % UI as compared to UC group 2. Data is represented as mean ± SEM (n = 4); *p < 0.05; SEM: standard error of mean; (c–f) Photographs of the stomach opened along greatest curvature (c) Group 1 Normal group without ulcer lesions (d) Group 2 UC group showing severe ulcer lesions (black arrow) (e) Group 3 ulcer + FAM solution showing moderate ulcer lesions (black arrow) as compared to UC group (f) Group 4 ulcer + optimized FAM loaded NSs (NS3) showing very mild or none lesions. [Click here to view] |