
INTRODUCTION
Diabetics around the world continue to grow along with the increase in population and lifestyle changes, as well as genetic factors. Based on data from the International Diabetes Federation, around 537 million people worldwide had diabetes in 2021, with around 374 million having type 2 diabetes [1,2]. This number continues to increase along with research and global demographic development. The disease is of global public health concern because of its significant impact on the health and quality of life of individuals as well as the burden it places on the health care system [3].
Nowadays, diabetes medication treatment still uses synthetic medicine such as thiazolidinediones, sulfonylureas, and artificial insulin [4,5]. It causes antibiotic resistance if used for a long period. Furthermore, natural content such as ω-3 fatty acids are faced to overcome this problem. These fatty acids are of great importance, but cannot be synthesized by the human body’s metabolism [6,7]. The most essential ω-3 fatty acid consist of several types such as α-linolenic acid (ALA), eicosapentaenoic acid (EPA), and docosahexaenoic acid (DHA). ALA has an important role in human growth, development, and disease prevention. It functions as a precursor of long-chain ω-3 fatty acids, including EPA, DPA, and DHA [8].
Furthermore, as highlighted in disease prevention, ALA is emerging as a key aspect of diabetes management by reducing nitrative stress, strengthening eNOS activity, and improving insulin sensitivity [9]. This prevents endothelial dysfunction through the PI3K/Akt pathway due to chronic hyperglycemia and increases glucose absorption which can treat insulin resistance. It also reduces the symptoms of diabetes complications such as cataract formation, blood vessel damage, and polyneuropathy [10].
The highest content of the ALA compound is found in purslane leaves (Portulaca oleracea). The compound almost accounts for the majority of the abundance of ω-3 fatty acids in these leaves [11]. Generally, the ω-3 fatty acid content (FAC) in purslane leaves is five times higher compared to spinach. That leaves also contain 2%–2.5% protein which can lower blood cholesterol and is rich in vitamins A, B, C, and minerals [12]. Compared to ω-3 fatty acids from fish oil, its leaves have the advantage of being low in cholesterol, triglycerides, and calories [13]. Therefore, purslane leaves have very high potential thereby the right method is needed to obtain ω-3 fatty acids. In this research, purslane leaf extract will be obtained using stirring maceration which can optimize the yield of ω-3 fatty acids. The results obtained will be tested using several fatty acid parameters, and the contents were identified to analyze the potential development as an antidiabetic herbal medicine with molecular docking.
MATERIAL AND METHODS
Materials
Ethanol (≥99.7%), chloroform (99.5%), and iodine (≥99.8%) were purchased from PT. Smart Lab in Indonesia. N-hexane (≥99%), H2SO4 (≥98%), potassium hydroxide (≥85%), and potassium iodide (≥99%) were purchased from Merck, Germany. Acetic acid (≥99.7%), sodium thiosulfate (99%), and phenolphthalein (≥98.0 %) were both purchased from Sigma Aldrich, Singapore. Filter paper Whatman TM grade 40 quantitative and aquadest were purchased from Chemindo, Indonesia. Purslane leaves were obtained from Mojokerto, Indonesia.
Instrumentations
Gas chromatography-flame ionization detection (GC-FID) (PerkinElmer Clarus 690), rotary evaporator (Buchi R-300), grinder 50–300 mesh (Shenzhen Yason General Machinery), magnetic stirrer (NESCO LAB MS-H280-Pro), Fourier transform infrared spectroscopy (FTIR) spectrophotometer (Perkin Elmer Spectrum Two).
Preparation of purslane leaves extract
Fresh purslane leaves are selected, cleaned, and dried. 10 g of dried leaves each were put into three separate beakers to be extracted using the solvents ethanol, n-hexane, and ethanol-n-hexane (1:1) and performed at different volumes (50, 100, and 200 ml). Stirring maceration was carried out with variations in time (15, 30, 60, and 120 minutes) and speed (600, 800, and 1,000 rpm). The extraction results were filtered and concentrated using a rotary evaporator at a temperature of 50°C(water bath) and 1°C (chiller) to obtain ω-3 fatty acid concentrate. Table 1 shows the operational conditions for maceration stirring using ethanol (E). The same operational conditions are also used for two other types of solvents, namely n-hexane (H), and ethanol-n-hexane (EH).
Characterization of purslane leaves extract
Optimization of yield
Response surface methodology is used to determine the relationship between response results and stirring maceration parameters based on Table 1 based on optimal solvent volume. The graph obtained will show the impact of the parameters by looking at the surface and contours formed [14].
Determination of moisture content (MC)
MC testing is carried out by measuring the difference in weight before and after heating (AOAC 930.15). The test was carried out at a temperature of 103°C ± 2°C for 3 hours and calculated using the following calculations [15].
where W is the container mass (g), W1 is the container mass with the sample (g), and W2 is the sample mass after drying (g).
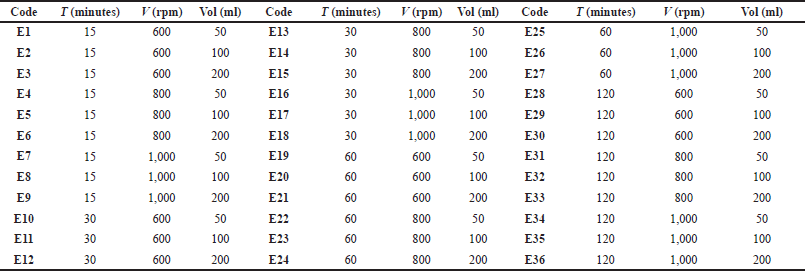 | Table 1. Operational conditions on stirring maceration of purslane leaves with ethanol solvent. [Click here to view] |
Determination of free fatty acid (FFA)
FFA is measured using the AOAC 940.28 method. 2 g of sample were weighed and placed in a 250 ml conical flask. A mixture of 25 ml diethyl ether, 25 ml of alcohol, and 1 ml of 1% PP indicator (w/v) was added to the flask. The flask is placed in a water bath until the mixture is completely dissolved. The hot solution is then titrated with 0.1 M KOH until a pink color emerges for 15 seconds. The FFA can be calculated by the following equation [16]:
where V is the KOH volume (ml), and W is the sample mass (g).
Determination of peroxide value (PV)
PV uses AOAC 965.33 method. 5 g of sample is put in a closed conical flask. A mixture of 18 ml CH3COOH and 12 ml CHCl3 (3:2) is added and stirred until homogeneous. A 0.5 ml of saturated KI solution is added using a pipette. The flask is shaken for 1 minute, then 30 ml of distilled water is added. Titration is carried out using 0.01 N Na2S2O3 until obtained a pale-yellow. Before continuing, the titrate is added with a starch solution to liberate all iodine in the CHCl3 layer, titrated with Na2S2O3, and shaken to the end point with marked loss of blue. The calculation is explained by the following equation [17]:
where V is Na2S2O3 volume (ml), N is Na2S2O3 normality (N), and W is the sample mass (g).
Determination of iodine value (IV)
The method used is AOAC 993.20. 10 ml CH3Cl and 25 ml of Hanus reagent were mixed into the 0.5 g sample, incubated the solution for 30 minutes in the dark add 10 ml of 15% KI, and 100 ml of aquadest as well. The mixed solution was titrated with 0.1 M Na2S2O3 until a pale-yellow color and continued titration until the blue color disappeared, using starch solution as an indicator. The IV is calculated using the following equation [18]:
The chemical reactions involved in iodine value determination are illustrated in Figure 1. where V1 is Na2S2O3 volume (ml), V2 is Na2S2O3 and sample volume (ml), M is Na2S2O3 molarity (M), and W is the sample mass (g).
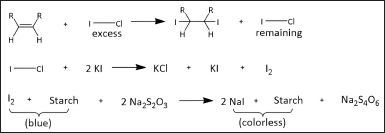 | Figure 1. Chemical reactions involved in IV determination. [Click here to view] |
Determination of saponification value (SV)
SV is specified using the AOAC 920.160 method. 5 g of purslane leaf extract was dissolved in 100 ml KOH (0. 5 M) and heated under reflux for 2 hours. After cooling, three drops of PP indicator are added, then titrated with 1 M HCl until the pink color disappears. Each sample is treated in triplicate to calculate the average value. The SV is calculated using the following equation [19]:
where M is HCl molarity (M), V2 is HCl volume as a blank (ml), V1 is HCl volume with sample (ml), and W is the sample mass (g).
Functional group evaluation by FTIR
The FTIR (Perkin Elmer Spectrum Two) was employed to obtain infrared spectra from purslane leaves extract samples. The sample is carefully placed into an iron tube located above the diamond crystal plate. The range of wavenumbers examined from 4,000 to 500 cm−1. The information obtained from the FTIR band will show the functional groups of ω-3 fatty acids in the sample [20].
Identification of fatty acids by GC-FID
Analysis of the fatty acid composition is carried out using GC-FID. The column used is a glass column (length 25 m, thickness 0.25 μm, diameter 0.25 mm) with stationary phase CPSil 5 CB. This analysis was performed at a temperature of 50°C–250°C, with an increase rate of 25°C/minute-200°C/ml and 18 minutes for separation ratio. The helium, with a pressure of 12 kPa, is used as a carrier gas. The result of the resulting analysis is the composition of fatty acids and their relative percentage. Quantitative determination of FAC is carried out using the following equation [21]:
where C is the fatty acids percentage (%), Y is the filtrate mass after evaporation (g), and W is the sample mass (g).
Antidiabetic analysis by molecular docking
The protein used in this study was phosphatase 1B (PTP1B) (PDB ID: 4Y14) as an antidiabetic target. X-ray crystals for protein receptors were obtained from the Research Collaboratory for Structural Bioinformatics webserver. The proteins are sterilized using AutoDockTools-1.5.7 to remove water molecules. Proteins use only the A chains needed for molecular docking. The initial preparation is that all nonessential ligands and molecules must be removed from the protein. Then the protein is added to polar hydrogen and charge. Protein is designated as macromolecule on a grid arrangement and saved as .pdbqt format.
The preparation of the 3D ligand conformer refers to the identified GC-FID compound. Compound data is obtained from the PubChem web server in .sdf format, and converted into .pdb format using the NCI/CADD Group Chemoinformatics User Tools and Services for processing in AutoDockTools 1.5.7.
The complex compound between the PTP1B protein as a receptor and ligand was simulated using AutoDock Vina with predetermined ligand coordinates. Compounds with the lowest binding affinity were visualized in 3D using PyMOL to see the position of ligands against protein receptors. The 3D results are stored in .pdb form to analyze the interaction between receptors and ligands in 2D form using LigPlot+.
RESULTS AND DISCUSSION
Yield
This research provides statistical data that a solvent with a volume of 200 ml obtains an optimal yield. This occurs because increasing the solvent volume causes an expansion of the contact area on the samples [22]. Figure 2 is a surface and contour graph that shows the results of yield volume with maceration stirring in different types of solvents. Figure 2a shows the optimal location of the sample which produces the highest yield volume with a time of 120 minutes and a speed of 1,000 rpm. The distribution of the widest contour area (purple) can be seen in Figure 2a that too short a time is not able to increase the yield volume. Figure 2b from also shows the optimal location of the sample under the same operational conditions. However, the difference in the area of the contour can be seen in red that the speed in Figure 2a has a significant influence compared to Figure 2b. Figure 2c provides a different indication compared to the two previous images where the purple contour area is not the widest part. This explains that speed has a significant impact on increasing the yield volume. According to Martínez-Ramos et al. [23], stirring maceration with two combinations of solvents can cause interactions between solvents, thereby affecting the chemical and physical properties of the solvent. This interaction causes changes in the contour.
Regarding the type of solvent, the more polar ethanol has a significant influence on the binding of unsaturated fatty acids (UFAs). As also explained by Montoya-García et al. [24], purslane leaves have a high UFA content (50%–88%) and most of it comes from ω-3 fatty acids which are easily attracted by polar solvents. This fact is supported by Wang et al. [25] who reported a low yield of fatty acids with nonpolar solvents (n-hexane) because most of the fat was still in lipoproteins. Apart from that, the use of a mixture of ethanol with n-hexane is also not recommended by Saini et al. [26] because it affects carbon chain interactions and interferes with the yield of the ethanol solvent. However, to obtain a significant comparison, further characterization was carried out on the three types of solvents with the highest volume. Samples that meet these criteria are E36, H36, and EH36.
Characterization of Purslane leaves extract
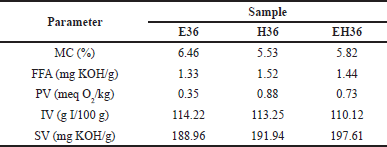
Characterization was performed to determine the optimal condition of ω-3 fatty acids in samples based on AOAC standards. Several characterizations involved are shown in Table 2. MC has an important role in determining the shelf life of extracts. High MC triggers fungus growth and conglomeration, thereby impacting physical and chemical stability. In general, 5%–15% of MC represents the requirement for most fatty acids used in various industries [27]. Purslane leaves extract showed an MC of 5.52%–6.36%. Low MC will minimize lipid oxidation, suppress free radicals, and slow hydroperoxide decomposition. Ethanol has a higher MC percentage because it interacts with water in the sample but is still within the appropriate range [28]. This was explained by Bai et al. [29] that ethanol provides a higher MC due to the presence of hydrogen bonds between ethanol and water compared to the n-hexane solvent (Figure 3). N-Hexane has the lowest MC due to the weak bonds between water molecules and n-hexane and the large polarity difference. Consistently, EH had an MC between the two solvents.
FFA are used to find out the levels of fatty acids that are not esterified. FFA can be used to estimate the fatty acids amount that will be lost during purification. When FFAs are volatile, the quantity can be a measure of rancidity. In this study, the FFA was 1.33 (E36); 1.52 (H36); 1.44 mg (EH36) KOH/g. This value indicates the low long-chain fatty acids amount in the sample [30].
The PV of purslane leaves extract is 0.35 (E36); 0.88 (H36); 0.73 (EH36) meq/kg. PV measures the degree of lipid oxidation in fatty acids. The PV measures the transient oxidation product [31]. The lower values represent early or late oxidation, which may be distinguished by time. Based on the research of Desta et al. [32], PV can be categorized as low when it is below 0.75 ± 0.21 meq/kg. This is in accordance with research by Gharby et al. [33], the PV increases when the extract is oxidized due to proper purification and rancidity removal conditions. The rancidity occurs because the higher the PV and FFA, the easier it is for oxidation to occur [34]. In the pathway (Figure 4), the main focus is on lipids as the fatty acid backbone. In the first step as shown in Figure 4, fatty acids will be initiated to obtain lipid radicals due to OH radicals produced from the decomposition of hydroperoxides (ROOH) in the atmosphere, through the reaction of excited oxygen atoms with water. Then it reacts with oxygen to form peroxyl radicals. Continuously, lipids combine with peroxyl radicals and produce lipid peroxide, then increasing rancidity [35,36].
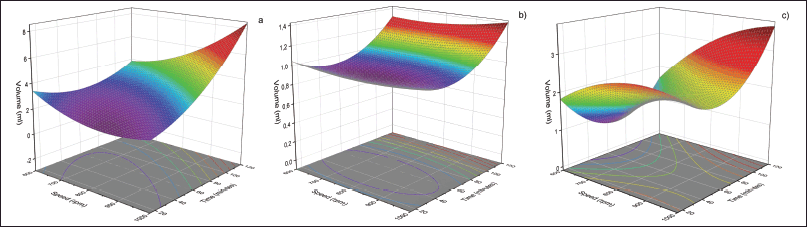 | Figure 2. Surface and contour plot of purslane leaves extract yield: a) ethanol; b) n-hexane; c) EH. [Click here to view] |
The IV measures 114.22 (E36); 113.25 (H36); 110.12 (EH36) g I/100 g. A higher IV indicates greater unsaturation in fatty acids, leading to specific physical, chemical, and nutritional properties [37]. Purslane leaves extract has a high IV with a minimum standard of 100 g I/100g. High IV can have a good impact on humans to reduce the risk of heart disease, high cholesterol, and cancer [38,39].
 | Table 2. Characterization of purslane leaves extract. [Click here to view] |
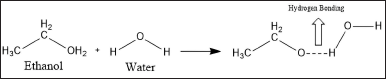 | Figure 3. Hydrogen bonding of ethanol and water molecule. [Click here to view] |
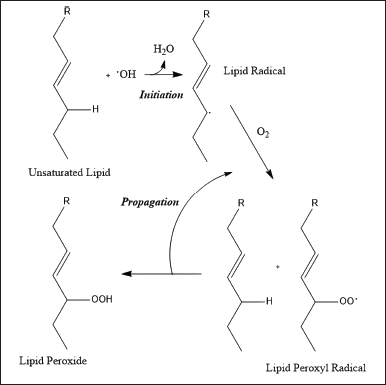 | Figure 4. Free radical pathway of the oxidative rancidification of lipid. [Click here to view] |
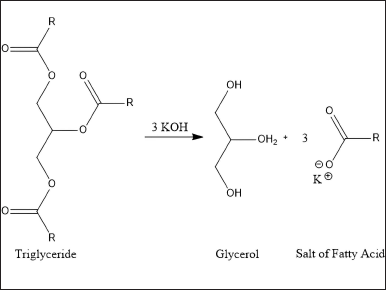
The SV of purslane leaves extract is described in Table 2. The reference value proposed by AOCS is a minimum of 196 mg KOH/g for SV, a higher value than observed in this study with successive values of 188.96 (E36); 191,94 (H36); and 197.61 (EH36) mg KOH/g. SV relates to the length of the fatty acid chain or double bond in triglycerides which lowers its value. Then, a higher SV indicates the alkali amount required in the saponification reaction as shown in Figure 5 [40]. According to Folayan et al. [41], the proportionality of SV can be known due to the higher amount of UFA (61%) than SFA.
Functional group identification
FTIR analysis of samples from solvents shows the spectrum profile (Figure 6). EH36 and E36 have hydroxyl group peaks (-OH: strain Ar-OH) at 3,350.67 and 3,338.85 cm−1 which generally represent carboxylic acids [42,43]. Hydroxyl groups (-OH) were identified in both solvents at peaks 1,015.12 and 1,017.10 cm−1 with vibrating O-H bonds [44]. The methyl group was identified in E36 with peaks of 2,947.53 cm−1 and 2,835.94 cm−1 and in EH36 with peaks of 2,952.50 and 2,843.04 cm−1 which are sp2 hybridization (-CH3) with symmetric and asymmetric vibrations [45]. Apart from that, E36 has a peak of 1,449.69 cm−1 which is the scissor vibration of the methyl group (-CH3) and also 1,405–1,409 cm−1 area with a weak intensity which is the bending vibration of the methyl group (-CH3) in aliphatic compounds [46,47]. This compound is a group of ω-3 fatty acids which are easily soluble in fat [48]. According to Tilinti et al. [49], aliphatic compounds emerge due to the nonpolar of carbon chain. Meanwhile, the hydroxyl group (-OH) that appears in ethanol occurs due to its high level of polarity rather than n-hexane.
 | Figure 5. Saponification reactions in general. [Click here to view] |
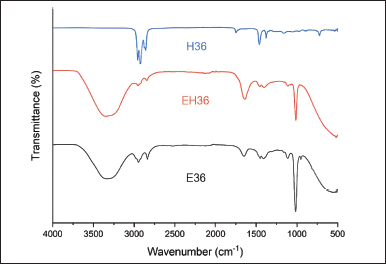 | Figure 6. Infrared spectrum of purslane leaves extract. [Click here to view] |
Furthermore, the spectrum of E36 and EH36 shows a peak of 1,601.20–1,639.30 cm−1 which indicates the presence of an alkane group (-C=C-) [50]. The samples gave rise to a peak in the range 1,701.56–1,748.12 cm−1 indicating the carbonyl group (C=O) of carboxylic acid followed by an O-H group at 1,002.33–1,015.12 cm−1 [51]. According to Nimbalkar and Bhat [52], The presence of a carboxyl group (-COOH) is important for binding other molecules.
The H36 spectrum shows peaks at 2,956.49 and 2,924.54 cm−1 as a methyl group (-CH3) with a C-H sp3 bond that vibrates symmetrically and asymmetrically [53]. Furthermore, the peaks 2,873.07 and 2,857.19 cm−1 are the methylene group (-CH2) from the C-H sp2 bond which vibrates symmetrically [54]. The methyl group (-CH3) was also identified from the peak at 1,460.07 cm−1 which indicated the vibrations of stretching and the peak at 1,378.29 cm−1 which indicated rocking vibrations [55,56]. These results show that the n-hexane solvent can identify various variations of methyl groups (-CH3). However, this solvent cannot reveal other functional groups of ω-3 fatty acids. This fact strengthens the statement by Su et al. [57] that the nonpolar of n-hexane is unable to bind ω-3 fatty acids, resulting in low yields. Regarding the spectrum comparison, the E36 sample has the potential for further analysis because it retains many functional groups of ω-3 fatty acids in high yields.
Composition of fatty acids in Purslane leaves extract and molecular docking analysis
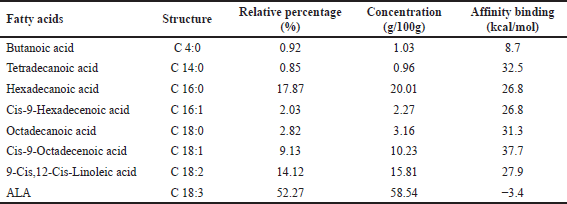
GC-FID chromatogram analysis shows the FAC in sample E36 which is presented in Table 3 and in Figure 7. One of the ω-3 fatty acid compounds in sample E36 was successfully identified as ALA with a concentration of 58.54 g/100 g. However, EPA and DHA were not identified in purslane leaves extract. The presence of this compound is useful as an antidiabetic by preventing insulin resistance [58]. These results strengthen the overall research that ALA is the most abundant component in purslane leaves extract.
The composition of ω-3 fatty acids obtained based on Table 3 was analyzed using molecular docking to obtain accurate information regarding the antidiabetic properties of these compounds so that purslane leaf extract has great potential to be developed as an antidiabetic herbal medicine in Indonesia in the future. The antidiabetic properties are based on the binding affinity value of each compound obtained through a molecular docking process using AutoDock Vina.
Molecular docking analysis was carried out to evaluate the potential of the ω-3 fatty acid compound in purslane leaves as an antidiabetic herbal medicine targeting the protein tyrosine PTP1B. This protein is a cell growth enzyme involved in differentiation, metabolism, and immune response [59]. However, the most important properties of this protein is that it removes phosphate groups from important tyrosine residues on the insulin receptor and causes decreased glucose uptake in insulin-responsive cells [60]. The ligand compounds for protein receptors are explained in Table 3 by showing that the ALA compound has the lowest binding affinity −3.4 kcal/mol compared to other compounds in the GC-FID chromatogram. It has also the lowest binding affinity rather than common drugs such as metformin, sulfonylurea, thiazolidinedione, and miglitol (Table 4). According to Saffaryazdi et al. [61], the lower the binding affinity, the more stable the complex so that its inhibitory activity is greater. This is supported by Dreny [62] that it may decrease blood glucose levels, improve liver and kidney function, and increase body weight when purslane leaves are added to the diet of diabetes mice. In addition, Kumar et al. [63] identified water-soluble polysaccharides in purslane leaves significantly improved glucose tolerance and lowered blood glucose levels in diabetic rats, thus suggesting a potential mechanism for its antidiabetic properties.
Figure 8a shows the position of the ALA compound at the receptor potential with its active side. This figure explains that a complex contains various interactions, including hydrophobic, electrostatic, and hydrogen bonds. The interaction affects the affinity value of complex binding. According to Verma and Subbaro [64], stable complexes will have a low-affinity value because they have few unfavorable bonds.
 | Table 3. The composition of ω-3 fatty acids in purslane leaves extract. [Click here to view] |
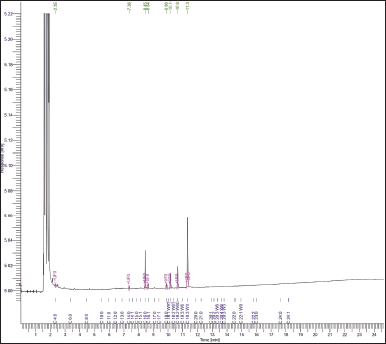 | Figure 7. GC-FID chromatogram of purslane leaves extract. [Click here to view] |
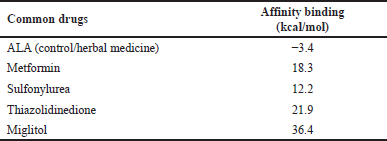 | Table 4. Binding affinity of common diabetes drugs. [Click here to view] |
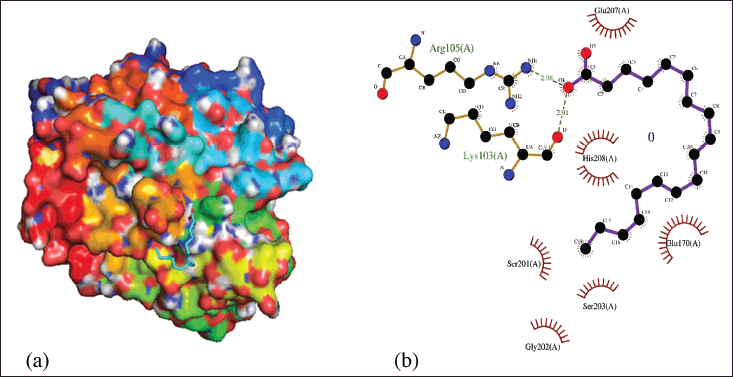 | Figure 8. Molecular docking analysis: a) 3D complex compound; b) 2D interaction of receptor and ligand. [Click here to view] |
Each compound on the receptor has an amino acid residue position that can bind and interact with ligand ALA compounds. These explain the ligand’s performance mechanism against its antidiabetic properties. ALA binds to the catalytic site of the receptor with two H-bonds. Arg105 by H-bonding to the hydroxyl group of ligand at a bond length of 2.98 Å. Another H-bond is observed between Lys103 and the hydroxyl group of the ligand which has a bond length of 2.91 Å. According to Ali et al. [65], the shorter hydrogen bond length gives an increase in bond strength. Brinck and Borrfors [66] added that the strength of hydrogen bonds has a significant influence on binding affinity. The shorter hydrogen bonds result in low-affinity value due to the correlation between the redshift strain mode of the H-bond group and the hydrogen bond length.
Furthermore, Arg105 and Lys103 run into hydrophobic interactions with several other residues as seen in Glu70, Glu207, Gly202, His208, Ser201, Ser203. By previous research [67,68], molecular docking results show that ALA carries out catalytic inhibition that forms hydrogen bonds and hydrophobic interactions at PTP1B residues. These in silico follow the results of in vitro kinetic analysis carried out by Bhowmick et al. [69], showing that UFA, such as ALA, bind to each of the catalytic and allosteric sites of PTP1B. This is under the properties of ALA which can regulate growth factor signaling and cell proliferation through dephosphorylation of major receptor tyrosine kinases, such as the insulin receptor. It directly interacts with activated insulin receptors, exhibits a role in insulin receptor signal transduction, and exerts therapeutic effects on diabetics.
CONCLUSION
In conclusion, the highest volume was achieved with a time of 120 minutes, a speed of 1,000 rpm, and a solvent volume of 200 ml. Extract MC plays an important role in determining its shelf life. The PV and IV indicate the low amount of long chain carboxylic acids in the sample. SV is influenced by the levels of unsaturated and saturated fatty acids. From the initial characterization, the E36 sample has the potential for further analysis because it can retain many ω-3 fatty acid functional groups in high yield. Then the samples were analyzed with GC-FID. The results showed that ALA was the most abundant composition. Molecular docking analysis evaluated the potential of purslane leaf extract as an antidiabetic herbal medicine targeting protein tyrosine PTP1B. By the binding affinity of −3.4 kcal/mol, the ALA ligand shows strong inhibitory activity against the PTP1B receptor. Molecular docking simulations between PTP1B and the ALA ligand support the bond affinity results with hydrogen bonds occurring at residues Arg105 and Lys103 and several hydrophobic interactions at other residues. This compound in silico provides in-depth knowledge of how the ALA compound in purslane leaf extract has great potential to be developed as an anti-diabetic herbal medicine. This compound can be further explored to determine its efficacy in vivo and in vitro in diabetes models with the molecular mechanisms involved.
ACKNOWLEDGMENTS
We thank the Ministry of Education, Culture, Research, and Technology for supporting Indonesia’s collaborative research program. We would like to express our gratitude to the fundraiser based on Decree of The Rector of Universitas Negeri Surabaya Number under Contract Number: B/42877/UN38.3/LT.02/2022. We also thank our research partners from Universitas Negeri Semarang and Universitas Gadjah Mada.
AUTHOR CONTRIBUTIONS
All authors made substantial contributions to conception and design, acquisition of data, or analysis and interpretation of data; took part in drafting the article or revising it critically for important intellectual content; agreed to submit to the current journal; gave final approval of the version to be published; and agree to be accountable for all aspects of the work. All the authors are eligible to be an author as per the International Committee of Medical Journal Editors (ICMJE) requirements/guidelines.
CONFLICTS OF INTEREST
The authors report no financial or any other conflicts of interest in this work.
ETHICAL APPROVALS
This study does not involve experiments on animals or human subjects.
DATA AVAILABILITY
All data generated and analyzed are included in this research article.
PUBLISHER’S NOTE
This journal remains neutral with regard to jurisdictional claims in published institutional affiliation.
REFERENCES
1. Rooney MR, Fang M, Ogurtsova K, Ozkan B, Echouffo-Tcheugui JB, Boyko EJ, et al. Global prevalence of prediabetes. Diabetes Care. 2023;46:1388–94. CrossRef
2. Ong KL, Stafford LK, McLaughlin SA, Boyko EJ, Vollset SE, Smith AE, et al. Global, regional, and national burden of diabetes from 1990 to 2021, with projections of prevalence to 2050: a systematic analysis for the Global Burden of Disease Study 2021. Lancet. 2023;402:203–34. CrossRef
3. Pati S, Pati S, van den Akker M, Schellevis FG, Jena S, Burgers JS. Impact of comorbidity on health-related quality of life among type 2 diabetic patients in primary care. Prim Health Care Res Dev. 2020;21:e9. CrossRef
4. Sagandira CR, Khasipo AZ, Sagandira MB, Watts P. An overview of the synthetic routes to essential oral anti-diabetes drugs. Tetrahedron. 2021;96:132378. CrossRef
5. Sivakumar PM, Prabhawathi V, Zarrabi A, Akthar S, Prabhakar PK. Current trends in the therapeutic strategies for diabetes management. Curr Med Chem. 2021;28:4616–37. CrossRef
6. Rodriguez D, Lavie CJ, Elagizi A, Milani RV. Update on omega-3 polyunsaturated fatty acids on cardiovascular health. Nutrients. 2022;14:5146. CrossRef
7. D’Angelo S, Motti ML, Meccariello R. ω-3 and ω-6 polyunsaturated fatty acids, obesity and cancer. Nutrients. 2020;12:2751. CrossRef
8. Fu Y, Wang Y, Gao H, Li D, Jiang R, Ge L, et al. Associations among dietary omega-3 polyunsaturated fatty acids, the gut microbiota, and intestinal immunity. Mediators Inflamm. 2021;2021:1–11. CrossRef
9. Gupta A, Jamal A, Jamil DA, Al-Aubaidy HA. A systematic review exploring the mechanisms by which citrus bioflavonoid supplementation benefits blood glucose levels and metabolic complications in type 2 diabetes mellitus. Diabetes Metab Syndr. 2023;17:102884. CrossRef
10. Huang K, Luo X, Liao B, Li G, Feng J. Insights into SGLT2 inhibitor treatment of diabetic cardiomyopathy: focus on the mechanisms. Cardiovasc Diabetol. 2023;22:86. CrossRef
11. Nemzer B, Al-Taher F, Abshiru N. Phytochemical composition and nutritional value of different plant parts in two cultivated and wild purslane (Portulaca oleracea L.) genotypes. Food Chem. 2020;320:126621. CrossRef
12. Du H, Zaman S, Hu S, Che S. Transcriptome profiling of unigenes participating in salt tolerance in purslane (Portulaca oleracea) under salinity stress. Acta Physiol Plant. 2023;45:76. doi: CrossRef
13. Santurino C, López-Plaza B, Fontecha J, Calvo MV, Bermejo LM, Gómez-Andrés D, et al. Consumption of goat cheese naturally rich in omega-3 and conjugated linoleic acid improves the cardiovascular and inflammatory biomarkers of overweight and obese subjects: a randomized controlled trial. Nutrients. 2020;12:1315. CrossRef
14. Manmai N, Unpaprom Y, Ramaraj R. Bioethanol production from sunflower stalk: application of chemical and biological pretreatments by response surface methodology (RSM). Biomass Convers Biorefin. 2021;11:1759–73. CrossRef
15. Drudi KCR, Drudi R, Martins G, Antonio GC, Leite JTC. Statistical model for heating value of municipal solid waste in Brazil based on gravimetric composition. Waste Manag. 2019;87:782–90. CrossRef
16. Bultum LE, Emire SA, Tufa LT. Physicochemical characterization of microwave-stabilized rice bran oil from Ethiopian small-scale rice-processing plants. Front Food Sci Technol. 2022;2. CrossRef
17. Geng L, Zhou W, Qu X, Sa R, Liang J, Wang X, et al. Iodine values, peroxide values and acid values of Bohai algae oil compared with other oils during the cooking. Heliyon. 2023;9:e15088. CrossRef
18. Hanjaya C, Pranata FS, Swasti YR. Quality of virgin coconut oil with addition of peppermint oil. Agritech. 2020;40:215. CrossRef
19. Nchimbi HY. Quantitative and qualitative assessment on the suitability of seed oil from water plant (Trichilia emetica) for soap making. Saudi J Biol Sci. 2020;27:3161–8. CrossRef
20. Asemani M, Rabbani AR. Detailed FTIR spectroscopy characterization of crude oil extracted asphaltenes: curve resolve of overlapping bands. J Pet Sci Eng. 2020;185:106618. CrossRef
21. Jarukas L, Kuraite G, Baranauskaite J, Marksa M, Bezruk I, Ivanauskas L. Optimization and validation of the GC/FID method for the quantification of fatty acids in bee products. Appl Sci (Basel). 2020;11:83. CrossRef
22. Nemati M, Afshar Mogaddam MR, Farazajdeh MA, Tuzen M, Khandaghi J. In-situ formation/decomposition of deep eutectic solvent during solidification of floating organic droplet-liquid-liquid microextraction method for the extraction of some antibiotics from honey prior to high performance liquid chromatography-tandem mass spectrometry. J Chromatogr A. 2021;1660:462653. CrossRef
23. Martínez-Ramos T, Benedito-Fort J, Watson NJ, Ruiz-López II, Che-Galicia G, Corona-Jiménez E. Effect of solvent composition and its interaction with ultrasonic energy on the ultrasound-assisted extraction of phenolic compounds from Mango peels (Mangifera indica L.). Food Bioprod Process. 2020;122:41–54. CrossRef
24. Montoya-García CO, García-Mateos R, Becerra-Martínez E, Toledo-Aguilar R, Volke-Haller VH, Jesús Magdaleno-Villar J. Bioactive compounds of purslane (Portulaca oleracea L.) according to the production system: a review. Sci Hortic (Amsterdam). 2023;308:111584. CrossRef
25. Wang Y, Su Y, Shehzad Q, Yu L, Tian A, Wang S, et al. Comparative study on quality characteristics of Bischofia polycarpa seed oil by different solvents: lipid composition, phytochemicals, and antioxidant activity. Food Chem X. 2023;17:100588. CrossRef
26. Saini RK, Prasad P, Shang X, Keum YS. Advances in lipid extraction methods—A review. Int J Mol Sci. 2021;22:13643. CrossRef
27. Sharma S, Barkauskaite S, Jaiswal AK, Jaiswal S. Essential oils as additives in active food packaging. Food Chem. 2021;343:128403. CrossRef
28. Machado M, Rodriguez-Alcalá LM, Gomes AM, Pintado M. Vegetable oils oxidation: mechanisms, consequences and protective strategies. Food Rev Int. 2023;39:4180–97. CrossRef
29. Bai Z, Jia K, Liu C, Wang L, Lin G, Huang Y, et al. A solvent regulated hydrogen bond crosslinking strategy to prepare robust hydrogel paint for oil/water separation. Adv Funct Mater. 2021;31. CrossRef
30. Vargas-Muñoz MA, Cerdà V, Turnes Palomino G, Palacio E. Determination of long-chain fatty acids in anaerobic digester supernatant and olive mill wastewater exploiting an in-syringe dispersive liquid-liquid microextraction and derivatization-free GC-MS method. Anal Bioanal Chem. 2021;413:3833–45. CrossRef
31. Figueiredo ARP, da Costa E, Silva J, Domingues MR, Domingues P. The effects of different extraction methods of lipids from Nannochloropsis oceanica on the contents of omega-3 fatty acids. Algal Res. 2019;41:101556. CrossRef
32. Desta M, Molla A, Yusuf Z. Characterization of physico-chemical properties and antioxidant activity of oil from seed, leaf and stem of purslane (Portulaca oleracea L.). Biotechnol Rep (Amst). 2020;27:e00512. CrossRef
33. Gharby S, Hajib A, Ibourki M, Sakar EH, Nounah I, Moudden HEL, et al. Induced changes in olive oil subjected to various chemical refining steps: a comparative study of quality indices, fatty acids, bioactive minor components, and oxidation stability kinetic parameters. Chem Data Coll. 2021;33:100702. CrossRef
34. Crisosto CH, Donis-Gonzalez IR, Wang SC, Lampinen BD. Removing english walnut (Juglans regia) ready-to-use shelled walnuts consumption barriers. Horticulturae. 2023;9:891. CrossRef
35. Huang X, Ahn DU. Lipid oxidation and its implications to meat quality and human health. Food Sci Biotechnol. 2019;28:1275–85. CrossRef
36. Yu X, Li B, Ouyang H, Xu W, Zhang R, Fu X, et al. Exploring the oxidative rancidity mechanism and changes in volatile flavors of watermelon seed kernels based on lipidomics. Food Chem X. 2024;21:101108. CrossRef
37. Nduka JKC, Omozuwa PO, Imanah OE. Effect of heating time on the physicochemical properties of selected vegetable oils. Arab J Chem. 2021;14:103063. CrossRef
38. Ivanova M, Hanganu A, Dumitriu R, Tociu M, Ivanov G, Stavarache C, et al. Saponification value of fats and oils as determined from 1H-NMR data: the case of dairy fats. Foods. 2022;11:1466. CrossRef
39. Nodeh HR, Rashidi L, Gabris MA, Gholami Z, Shahabuddin S, Sridewi N. Chemical and physical characterization of the Hackberry (Celtis australis) seed oil: analysis of tocopherols, sterols, ECN and fatty acid methyl esters. J Oleo Sci. 2020;69:1359–66. CrossRef
40. Semwal PC, Semwal A, Bhatt SP, Parashar T, Ankur, Jakhmola V, et al. Apricot- a new source of chemically active constituents: a medicinal overview. Biomed Pharmacol J. 2023;16:1133–42. CrossRef
41. Folayan AJ, Anawe PAL, Aladejare AE, Ayeni AO. Experimental investigation of the effect of fatty acids configuration, chain length, branching and degree of unsaturation on biodiesel fuel properties obtained from lauric oils, high-oleic and high-linoleic vegetable oil biomass. Energy Rep. 2019;5:793–806. CrossRef
42. Ali S, Jan FA, Ullah R, Wajidullah, Ullah N. Kinetic and thermodynamic study of the photo catalytic degradation of methylene blue (MB) in aqueous solution using cadmium sulphide (CdS) nanocatalysts. Chem Afr. 2022;5:293–304. CrossRef
43. Sulak M, Kavakc?o?lu Yard?mc? B. The green synthesis of MgO nanoparticles using dried jujube fruit extract and their anti-yeast activity against Saccharomyces cerevisiae. Inorg Nano-Met Chem. 2022;52:653–60. CrossRef
44. Yusuf MO. Bond characterization in cementitious material binders using Fourier-transform infrared spectroscopy. Appl Sci (Basel). 2023;13:3353. CrossRef
45. Nejad SAT, Amanian S, Alibakhshi E, Hajisoltani M, Haddadi SA, Arjmand M, et al. Enhancing epoxy-silicone coating’s protection performance: harnessing the power of sulfur-doped graphene oxide. Prog Org Coat. 2024;188:108195. CrossRef
46. Saleh NS, Ostad Movahed S, Attarbashi F. The functionalization of selected chemical agents on a polypropylene fiber and the study on the physical and anti-bio-fouling properties of the functionalized fibers. SPE Polymers. 2022;3:128–41. CrossRef
47. Faizan M, Ahmad S. FTIR and FT-Raman spectra of 6-(dimethylamino)purine and its theoretical studies of anharmonic vibrational analysis using quantum chemical calculations. Vib Spectrosc. 2021;113:103224. CrossRef
48. Alfio VG, Manzo C, Micillo R. From fish waste to value: an overview of the sustainable recovery of omega-3 for food supplements. Molecules. 2021;26:1002. CrossRef
49. Tilinti BZ, Ayichiluhim TB, Tura AM, Duraisamy R. Extraction and characterizations of omega 3-fatty acid from cat fish collected from Arba Minch Chamo Lake. Cogent Food Agric. 2023;9(1):216042. doi: 10.1080/23311932.2023.2216042
50. Liu J, Wang T, Lv Q, Meng Y, Gao Z, Hu S, et al. Reactive oxygen species-responsive hydrophobic crosslinked chitosan films based on triple-function crosslinkers. Int J Biol Macromol. 2024;257:128606. CrossRef
51. Pielesz A, Binia? D, Waksma?ska W, Bobi?ski R. Lipid bands of approx. 1740 cm−1 as spectral biomarkers and image of tissue oxidative stress. Spectrochim Acta A Mol Biomol Spectrosc. 2023;286:121926. CrossRef
52. Nimbalkar MN, Bhat BR. Simultaneous adsorption of methylene blue and heavy metals from water using Zr-MOF having free carboxylic group. J Environ Chem Eng. 2021;9:106216. CrossRef
53. Prajapati AK, Yadawa Y, Dwivedi D, Kumar R. Fuel property enhancement of Jatropha biodiesel by blending with nanoparticles. Chem Eng Technol. 2024;47:200–7. CrossRef
54. Kanazawa S, Yamada Y, Sato S. Infrared spectroscopy of graphene nanoribbons and aromatic compounds with sp3C–H (methyl or methylene groups). J Mater Sci. 2021;56:12285–314. CrossRef
55. Liu J, Zhang QH, Ma F, Zhang SF, Zhou Q, Huang AM. Three-step identification of infrared spectra of similar tree species to Pterocarpus santalinus covered with beeswax. J Mol Struct. 2020;1218:128484. CrossRef
56. Yuan K, Chen Q, Zhang A, Xiao N, Zou X, Lin Z. Efficient thermal energy conversion and storage enabled by hybrid graphite nanoparticles/silica-encapsulated phase-change microcapsules. J Mater Chem A. 2024;12:2456–64. CrossRef
57. Su D, Miao J, Liu X, Wang X, Yu Y, Leng K, et al. Separation and concentration of phospholipids and glycerides from ethanol extraction of krill by hydration and solvent partitioning. Sep Purif Technol. 2023;317:123900. CrossRef
58. Syed RU, Moni SS, Huwaimel B, Alobaida A, Almarshdi AA, Abouzied AS, et al. Bioactive principles, anti-diabetic, and anti-ulcer activities of Ducrosia anethifolia Boiss leaves from the Hail region, Saudi Arabia. Arab J Chem. 2022;15:104308. CrossRef
59. Teimouri M, Hosseini H, ArabSadeghabadi Z, Babaei Khorzoughi R, Gorgani Firuzjaee S, Meshkani R. The role of protein tyrosine phosphatase 1B (PTP1B) in the pathogenesis of type 2 diabetes mellitus and its complications. J Physiol Biochem. 2022;78:307–22. CrossRef
60. Lennicke C, Cochemé HM. Redox regulation of the insulin signalling pathway. Redox Biol. 2021;42:101964. CrossRef
61. Saffaryazdi A, Ganjeali A, Farhoosh R, Cheniany M. Variation in phenolic compounds, α-linolenic acid and linoleic acid contents and antioxidant activity of purslane (Portulaca oleracea L.) during phenological growth stages. Physiol Mol Biol Plants. 2020;26:1519–29. CrossRef
62. Dreny EGE. Antidiabetic activity of aerial parts and seeds of purslane (portulaca oleracea) on diabetic rats. Eur J Nutr Food Saf. 2020;12:13–23. CrossRef
63. Kumar A, Sreedharan S, Kashyap AK, Singh P, Ramchiary N. A review on bioactive phytochemicals and ethnopharmacological potential of purslane (Portulaca oleracea L.). Heliyon. 2022;8:e08669. CrossRef
64. Verma J, Subbarao N. In silico study on the effect of SARS-CoV-2 RBD hotspot mutants’ interaction with ACE2 to understand the binding affinity and stability. Virology. 2021;561:107–16. CrossRef
65. Ali F, Kasry A, Amin M. The new SARS-CoV-2 strain shows a stronger binding affinity to ACE2 due to N501Y mutant. Med Drug Discov. 2021;10:100086. CrossRef
66. Brinck T, Borrfors AN. The importance of electrostatics and polarization for noncovalent interactions: ionic hydrogen bonds vs ionic halogen bonds. J Mol Model. 2022;28:275. CrossRef
67. Akay MB, ?ener K, Sari S, Bodur E. Inhibitory action of omega-3 and omega-6 fatty acids alpha-linolenic, arachidonic and linoleic acid on human erythrocyte acetylcholinesterase. Protein J. 2023;42:96–103. CrossRef
68. Paul A, Sarkar A, Banerjee T, Maji A, Sarkar S, Paul S, et al. Structural and molecular insights of protein tyrosine phosphatase 1B (PTP1B) and its inhibitors as anti-diabetic agents. J Mol Struct. 2023;1293:136258. CrossRef
69. Bhowmick S, Biswas T, Ahmed M, Roy D, Mondal S. Caveolin-1 and lipids: association and their dualism in oncogenic regulation. Biochim Biophys Acta Rev Cancer. 2023;1878:189002. CrossRef