INTRODUCTION
Cystic fibrosis (CF) is a hereditary genetic condition that follows an autosomal recessive pattern. The primary cause of this condition lies in mutations within the cystic fibrosis transmembrane conductance regulator (CFTR) gene. The CFTR gene plays a pivotal role in the production of a protein responsible for regulating the passage of chloride and bicarbonate ions. When this protein malfunctions, it gives rise to a range of systemic complications that impact multiple organs, including the lungs, liver, pancreas, gastrointestinal system, and even the reproductive system [1–7].
The respiratory system faces severe consequences, leading to damaging events. These include a decrease in the fluid lining the airways, reduced mucus clearance, recurring bacterial infections, the onset of bronchiectasis, and organ failure in severe cases [8,9]. Respiratory issues are the leading cause of the high rates of illness and death linked to CF. Current treatments primarily aim to control these symptoms, ranging from pancreatic enzyme supplements and physical therapy for the lungs to hydration techniques and strong antibiotics [10,11].
Recent strides in CF treatment have led to the development of CFTR modulators, commonly called “caftor” medications. These drugs are designed to fix the malfunctioning CFTR protein in people with specific, treatable mutations. A notable example is a drug called Kaftrio® in Europe and Trikafta® in the United States, made by Vertex Pharmaceuticals Inc. This medication combines three different agents: ivacaftor (IVA), tezacaftor (TEZ), and elexacaftor (ELX), and is intended for patients over 6 years old who have at least one F508del mutation, the most frequently occurring genetic mutation in CF cases [12–14].
In medical care, measuring drug levels in the blood is crucial for fine-tuning medication doses, a process known as therapeutic drug monitoring (TDM). TDM is particularly helpful for drugs where there is a lot of difference in how people react to them and where the concentration of the drug in the blood is closely tied to its effectiveness or possible side effects. It is valid for CFTR modulators such as IVA, TEZ, and ELX [15–19].
To aid in TDM, reliable ways to measure these drugs in the blood are needed. In this study, we introduce an innovative method that uses a type of liquid chromatography combined with a specific kind of mass spectrometry (LC-MS/MS) to accurately measure levels of IVA, TEZ, and ELX in blood samples. This method is vital for gathering data on dosage, concentration, and response, which is crucial for managing CF effectively with these new CFTR modulators [20–23].
Few methods have been documented for measuring the concentrations of ELX, IVA, and TEZ in human plasma using LC-MS/MS equipment. Various extraction approaches have been explored for assessing the levels of these medications in plasma using LC-MS/MS. An examination of the existing literature reveals a need for updated analytical techniques, primarily due to long operation times, complex chromatographic conditions, and involved sample preparation processes. The ideal analytical method should be robust, straightforward, reliable, and cost-effective for determining analyte concentrations in plasma. A new method using solid phase extraction (SPE) was devised that operates on LC-MS/MS. This method utilizes only 100 μl of plasma and avoids the use of large volumes of chemicals. Additionally, it boasts a shorter chromatographic runtime of just 2.0 minutes and employs lumacaftor (LUM) (Molecular formula: C24H18F2N2O5, Molecular weight: 452.414) as the internal standard (IS) [24–26].
MATERIALS AND METHODS
Materials and chemicals
ELX, IVA, TEZ, and LUM standards were procured from Clearsynth Labs Ltd in Mumbai, India. The molecular configurations of these compounds can be seen in Figure 1. The LC-MS/MS testing utilized water from a Milli Q purification system provided by Millipore from Bangalore, India. J.T. Baker in Phillipsburg, USA, supplied the HPLC-grade methanol. Additionally, Merck Ltd in Mumbai, India, supplied the analytical-grade formic acid. K2-EDTA human plasma samples for control purposes were gathered from Deccan’s Pathological Labs, Hyderabad, India.
Instrument configuration
We employed an LC-20AD model HPLC device from Shimadzu Corporation, Kyoto, Japan. This was integrated with an API 4500 Triple Quadrupole MS/MS System, a product of Business unit of Analytical technologies (MDS) Sciex and Applied Biosystems, hailing from Foster City, CA, USA. This HPLC system encompassed a range of components: a column oven for maintaining temperature consistency, an autoinjector for sample introduction and injection, as well as a Degasser unit, and pumps that directed the mobile phase. The mass spectrometer drew its nitrogen gas—used in sample ionization—from a generator provided by Peek Scientific. In the context of data analysis, particularly when quantifying analyte and IS concentrations in human plasma, we depended on Analyst Software version 1.6.3.
METHODS
Stock solutions and dilutions
Initial stock solutions of ELX, IVA, TEZ, and LUM were individually weighed and dissolved in pure methanol to make 1 mg/ml solutions. One of these primary stock solutions was used for calibration curve preparation (CC), and another for quality control (QC).These primary stock solutions were further diluted using a 70% methanol-water mixture. Similar dilution conditions were applied for the IS.
 | Figure 1. Chemical structures. [Click here to view] |
 | Figure 2. Mass spectra of parents and products [M+H]+ of ELX. [Click here to view] |
Buffer and mobile phase preparation
A 0.1% formic acid buffer was made by combining 1 ml of formic acid with 1,000 ml of HPLC-grade water. The mobile phase was a mix of 150 ml of 0.1% formic acid and 850 ml of methanol.
Reagents and solutions
All additional reagents were prepared to their closest concentrations utilizing HPLC-grade water.
Method development
The method development involved an exhaustive investigation into various factors that affect the quantification and detection of the target compounds. By altering one parameter at a time while keeping all others fixed, a rigorous evaluation was conducted. The factors under study included mass parameters, stationary and mobile phase choices, ISs, and the extraction solvent.
Mass spectrometry and chromatographic conditions
Source parameters such as curtain gas, ion spray voltage, and GS1 and GS2, as well as compound parameters such as declustering potential (DP), collision energy (CE), and collision cell exit potential (CXP) were fine-tuned for higher responsiveness and superior peak shapes. The sensitivity was enhanced through meticulous tuning, using a standard concentration of 10 ng/ml for both the analyte and IS. Experiments were conducted in both positive (+ve) and negative (–ve) ion modes, with the positive ion mode showing a better response.
The MDS Sciex API-4500 mass spectrometer, featuring a TurboionsprayTM interface heated to 550°C, was employed for quantification in positive ion mode. The ion spray voltage was consistently held at 5000 V. Source parameters, encompassing nebulizer gas, auxiliary gas, curtain gas, and collision gas, were set at fixed values of 35, 45, 40, and 8 psi, respectively, in the specified order. Compound settings, such as DP, CE, entrance potential, and CXP, were identical at 90, 38, 10, and 11 V for ELX, IVA, TEZ, and its IS. The multiple reaction monitoring mode was the chosen observation method, with transition m/z values outlined in Figures 2–5. We ensured unit resolution for both Quadrupole Q1 and Q3, and the analysis of data was carried out using Analyst Software version 1.6.3.
 | Figure 3. Mass spectra of parents and products [M+H]+ of IVA. [Click here to view] |
 | Figure 4. Mass spectra of parents and products [M+H]+ of TEZ. [Click here to view] |
 | Figure 5. Mass spectra of parents and products [M+H]+ of LUM (IS). [Click here to view] |
Chromatographic separation
The chromatographic division was successfully executed using a Zodiac C18 column. The mobile phase, consisting of a methanol and 0.1% formic acid buffer mixture (85:15, v/v), was propelled at a flow rate of 1.0 ml/minute. This systematic approach to method development ensures the accuracy and reliability of the analytical process, making it a vital tool in pharmacological studies.
Sample preparation
Before tests, we ensured all cryopreserved samples, reference metrics, and QC samples reached room conditions. After thawing, we employed a cyclonic mixer to guarantee uniformity. From each specimen, we drew 100 μl into designated Radio Immunoassay receptacles. We then introduced a 10 μl aliquot of our benchmark mix, sidestepping both the null and initial dosage samples. Following this, we incorporated 500 μl of ultra-purified water, ensuring a well-blended concoction. This prepared solution was next channeled into primed Strata™-X cylinders. Upon pressurizing these vessels, a purification sequence ensued, allowing for compound retrieval, and priming them for subsequent LC-MS/MS scrutiny.
 | Figure 6. Chromatograms of plasma blank sample A) ELX B) IVA C) TEZ and D) LUM. [Click here to view] |
Method validation
Under the validation section, various parameters were assessed, encompassing selectivity, specificity, limit of quantification (LOQ), linearity, precision, accuracy, matrix effect, recovery, and stability (including freeze-thaw, autosampler, benchtop, and long-term stability).
Selectivity and specificity
In the pursuit of selectivity and specificity, 10 lots of blank plasma underwent rigorous scrutiny for potential interference. From this selection, six lots that exhibited no interference were chosen for in-depth studies. The criteria for interfering peak areas were defined in relation to the lower limit of quantification (LLOQ) of both the target analytes and the IS.
 | Figure 7. Plasma sample of blank with IS A) ELX B) IVA C) TEZ. [Click here to view] |
 | Table 1. Sensitivity data. [Click here to view] |
Linearity
To assess linearity, calibration standards were meticulously prepared and subjected to assay measurements over several consecutive days.
Precision and accuracy
To evaluate both intra-day and inter-day precision and accuracy, we meticulously prepared calibration and QC standards and conducted comprehensive analyses.
Matrix effect
The matrix effect was studied by spiking extracted blank plasma with mid QC concentrations and comparing it with unextracted standards.
Recovery
The extraction recovery was examined through protein precipitation methods, comparing extracted QC standards with unextracted ones at different concentration levels.
Stability tests
Stability was carried out to determine the shelf-life and handling conditions for samples. These included bench-top (48 hours), freeze-thaw (−70°C), autosampler (2°C–8°C, 36 hours), and extended-term stability (−70°C, 120 days), each with its own set of protocols.
RESULTS AND DISCUSSION
Selectivity
The first step in method validation was selectivity testing. Six different plasma lots along with one hemolyzed and one lipemic K2-EDTA human plasma lot were screened for interferences at the analyte and IS retention times. No interferences were found, as depicted in Figures 6 and 7. By carrying out a thorough and systematic method validation process, we ensure that the analysis is not only accurate but also reliable, making it invaluable in various applications including pharmacological research. The lowest reliable concentration for ELX was established to be 0.151 ng/ml. At this concentration level, the precision was remarkably consistent at 4.24%, and the accuracy was also notable at 80.57%. For IVA, the LLOQ was 0.101 ng/ml, with a precision of 3.10% and an accuracy of 100.33%. TEZ showed an LLOQ of 20.160 ng/ml, with precision and accuracy figures at 4.07% and 101.77%, respectively.
Sensitivity
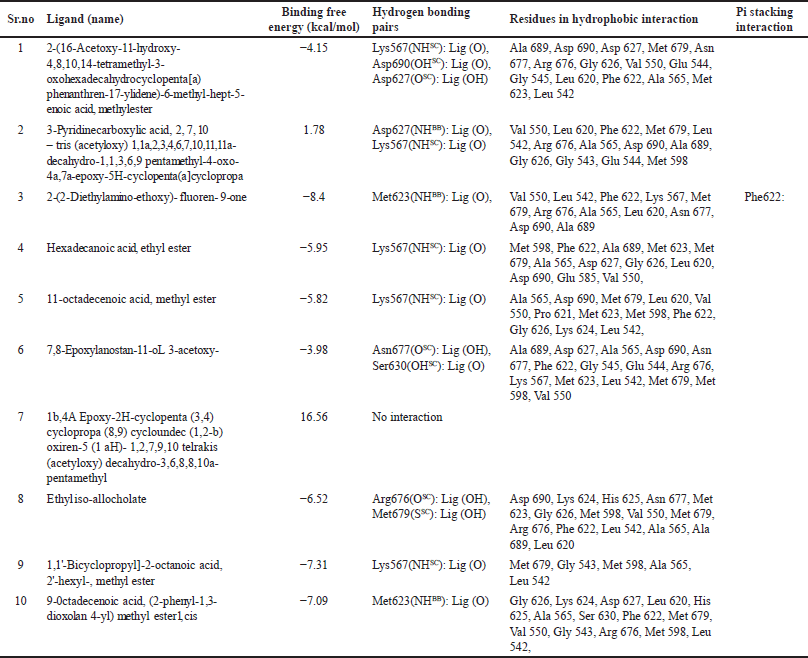
The sensitivity data for ELX, IVA, and TEZ are summarized in Table 1. The table serves as a straightforward reference for the observed precision and accuracy at the LLOQ for each compound, making it easier to compare and analyze the data.
 | Table 2. Linearity data for ELX . [Click here to view] |
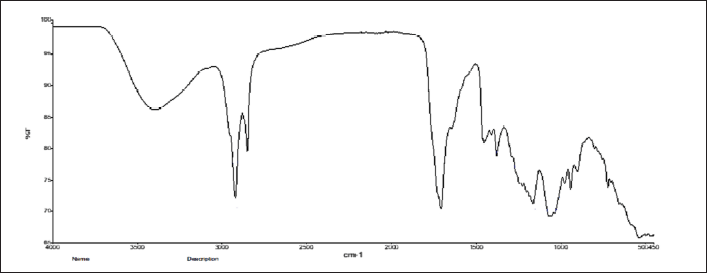 | Table 3. Linearity data for IVA. [Click here to view] |
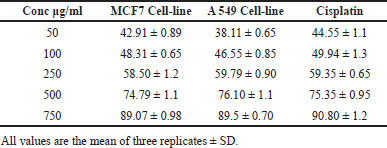 | Table 4. Linearity data for TEZ. [Click here to view] |
 | Table 5. Intraday precision and accuracy data. [Click here to view] |
 | Figure 8. Representative CC of ELX. [Click here to view] |
Linearity
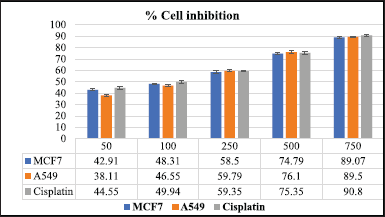
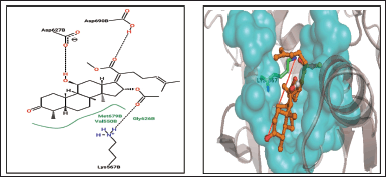
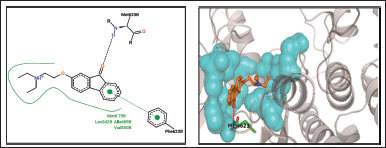
The correlation coefficient (r2) surpassed 0.99 for each test substance, including ELX in the concentration span of 0.151–40.382 ng/ml, IVA ranging from 0.101 to 30.010 ng/ml, and TEZ within 20.187–6,026.032 ng/ml. These outcomes are detailed in Tables 2 through 4 and Figures 8 through 10.
 | Figure 9. Representative CC of IVA. [Click here to view] |
 | Figure 10. Representative CC of TEZ. [Click here to view] |
PRECISION AND ACCURACY
Intra-day precision and accuracy
For ELX, when assessing various concentration levels including lowest level of quantification QC (LLOQ QC), lowest QC (LQC), middle QC (MQC), and highest QC (HQC), we observed the %CV values lying between 0.74% and 9.20%. The accuracy of these measurements spanned from 89.90% to 100.68%. IVA’s intra-day precision at the specified QC concentrations was found to vary between 3.03% and 5.31%, with accuracy measurements ranging from 99.84% to 102.57%. As for TEZ, the intra-day precision for the given QC levels fluctuated between 3.17% and 7.54%, and the accuracy values spanned from 96.78% to 101.29%. Refer to Table 5 and Figures 11 through 14 for a comprehensive breakdown.
Inter-day precision and accuracy
When evaluating data across multiple days, the precision and accuracy for ELX at LLOQ QC, LQC, MQC, and HQC were found to have %CV values between 0.76% and 7.44%. The corresponding accuracy measurements ranged from 91.99% to 100.88%. In the case of IVA, the inter-day precision measurements varied from 2.27% to 4.58% and accuracy values ranged from 100.05% to 102.34%. For TEZ, the observed precision spanned from 2.43% to 8.52%, while accuracy values were between 98.36% and 100.98%. A detailed summary of these findings can be viewed in Table 6.
 | Figure 11. LLOQ QC sample with IS of A) ELX B) IVA C) TEZ. [Click here to view] |
 | Figure 12. LQC sample with IS of A) ELX B) IVA C) TEZ. [Click here to view] |
Matrix effect analysis
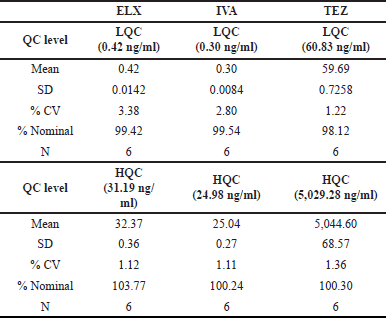
When we examined the matrix effect for ELX, we found minimal interference from endogenous components in all the screened plasma lots at both the LQC and HQC concentrations. At LQC, the interference was 99.42%, with a percent CV of 3.38%; at HQC, it was 103.77%, with a percent CV of 1.12%. These results indicate no significant interference from endogenous components in the analyzed samples.
Furthermore, the selected matrix lots showed no significant matrix effect. This means that the matrix in which the samples were analyzed did not significantly impact the results.
For IVA and TEZ, the precision at the LQC level was 2.80% and 1.22%, respectively, and at the HQC level, it was 1.11% and 1.36%, respectively. These low precision values indicate high consistency and repeatability in the measurements.
In terms of accuracy, IVA showed an accuracy of 99.54% at the LQC level and 100.24% at the HQC level. TEZ demonstrated an accuracy of 98.12% at the LQC level and 100.30% at the HQC level. These accuracy values indicate that the measurements were very close to the valid values. A summary of these results is in Table 7.
Recovery and stability assessment
Recovery assessment
ELX demonstrated an average overall recovery rate of 80.62%. IVA and TEZ showed mean overall recovery rates of 77.85% and 80.96%, respectively. The mean recovery rate for the IS, LUM, was 74.47%. LUM (IS) exhibited a recovery rate of 78.31%.
Stability assessment
Bench top stability
ELX exhibited excellent stability, with a %Stability ranging from 95.22% to 100.03% after 10 hours at both LQC and HQC levels. The %CV at LQC and HQC ranged from 0.73% to 3.77% for ELX. IVA and TEZ were stable for up to 12 hours during benchtop stability testing, as confirmed by six LQC and HQC samples. The percent stability for IVA and TEZ ranged from 100.74% to 101.72% and 99.62% to 101.61%, respectively. Precision for IVA and TEZ ranged from 0.58% to 2.85% and 2.25% to 2.87%. Detailed results are presented in Table 8 for reference.
Short-term stability evaluation
For assessing short-term stability at a temperature of −20°C, we embarked on a study storing six batches each of LQC and HQC samples at said temperature after a collective spiking. Within this 4-day span, ELX’s %Stability displayed a range of 99.91%–101.00%, and its %CV fluctuated between 0.84% and 1.19%. Similarly, the stability of both IVA and TEZ was analyzed while conserving plasma specimens at −20°C in a specialized freezer over 4 days. We measured six batches of both LQC and HQC by comparing them to freshly spiked calibration standards, which reflected the concentration parameters set for precision and accuracy metrics. IVA and TEZ’s stabilities over the 4 days spanned from 98.76% to 99.14% and from 99.86% to 99.95%, respectively. Their precision measurements were between 1.85% and 2.06% for IVA, and 1.10% and 3.78% for TEZ. Comprehensive results are presented in Table 9.
 | Table 6. Inter-day precision and accuracy. [Click here to view] |
 | Table 7. Matrix effect data. [Click here to view] |
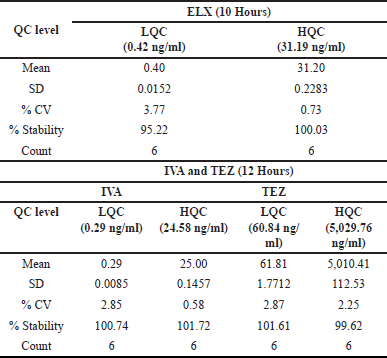 | Table 8. Benchtop stability data. [Click here to view] |
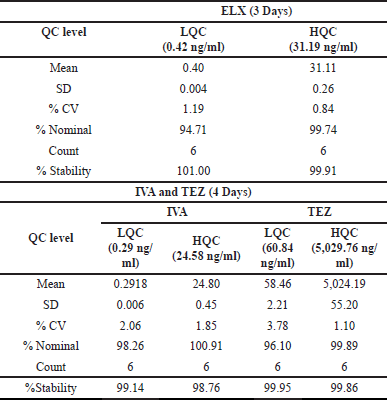 | Table 9. Short-term stability at −20°C data. [Click here to view] |
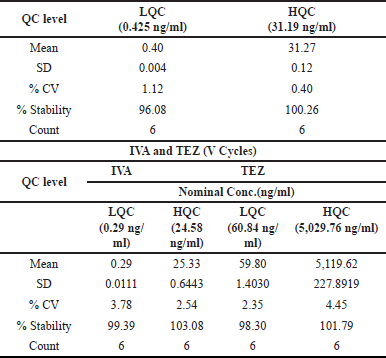 | Table 10. Freeze-thaw stability data. [Click here to view] |
Freeze-thaw stability analysis
In the endeavor to determine freeze-thaw stability, we subjected six batches each of LQC and HQC specimens to intensive testing, categorizing them as Freeze-thaw (FT)samples. After an initial 24-hour freeze, the FT batches were thawed and kept aside for the FT-1 cycle. Post a 12-hour interval, the samples underwent another freeze-thaw iteration, tagged as FT-2. This procedure was replicated until a total of four cycles were completed, post which the samples earmarked for stability were analyzed. CC samples, freshly constituted and treated, were paralleled with stability QC samples before being initiated into the analysis phase.
ELX’s stability percentage oscillated between 96.08% and 100.26%, and the coefficient of variation (%CV) was observed to be from 0.40% to 1.12%. These insights are cataloged in Table 10. As for IVA and TEZ in human plasma, their endurance across five freeze-thaw iterations was gauged. Each LQC and HQC specimen was analyzed six times after these cycles. The freeze-thaw QC batches were quantified against a newly spiked CC, echoing the concentration benchmarks for precision and accuracy, as delineated in Tables 5 and 6.
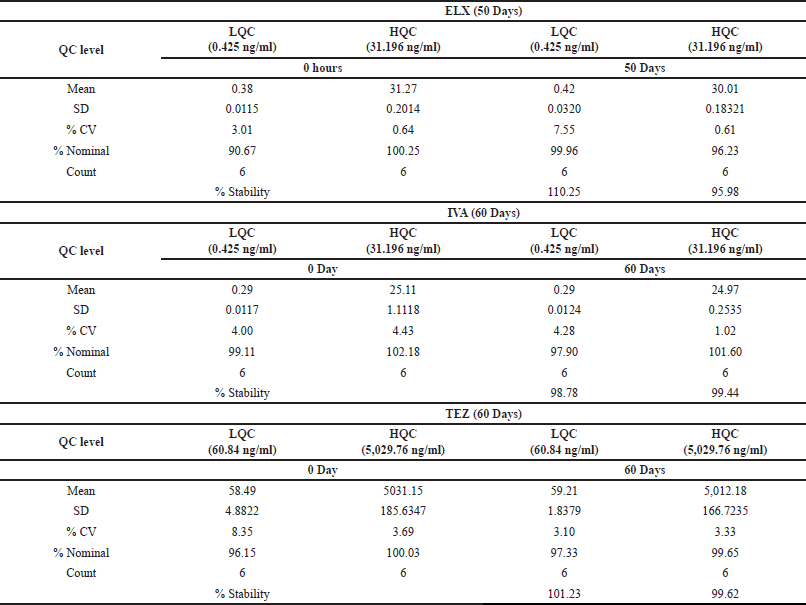 | Table 11. Extended-term stability at -70°C data. [Click here to view] |
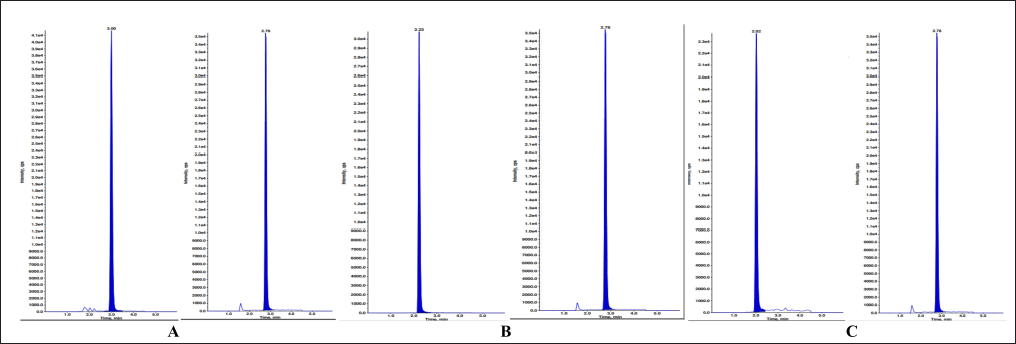 | Figure 13. MQC sample with IS of A) ELX B) IVA C) TEZ. [Click here to view] |
 | Figure 14. HQC sample with IS of A) ELX B) IVA C) TEZ. [Click here to view] |
IVA and TEZ’s stability percentages were recorded between 99.39% to 103.08% and 98.30% to 101.79%, respectively. Precision readings for IVA and TEZ oscillated from 2.54% to 3.78% and 2.35% to 4.45% in that order. These exhaustive results are encapsulated in Table 10.
Extended-term stability
To assess the extended-term stability within the matrix, we initiated an experiment by storing six sets of LQC and HQC samples at −70°C following bulk spiking. On the day designated for the stability assessment, we prepared and processed a fresh CC in addition to stability quality controls (QCs), which were subsequently injected into the system. Over a period of 50 days, ELX exhibited varying levels of stability, with percentages ranging from 95.98% to 110.25%. The corresponding coefficient of variation (%CV) fluctuated between 0.61% and 7.55%.
In the case of IVA and TEZ, the evaluation extended to 60 days, during which their percent stability was observed to range from 98.78% to 99.44% and 99.62% to 101.23%, respectively. The precision values for IVA and TEZ spanned from 1.02% to 4.28% and 3.10% to 3.33%, respectively. A summary of these findings can be found in Table 11.
This research work is unique and innovative due to several factors:
1. Thorough method development: The researchers conducted an exhaustive investigation into various factors that affect the quantification and detection of the target compounds. They systematically evaluated mass parameters, stationary and mobile phase choices, ISs, and extraction solvents, ensuring a comprehensive approach to method development.
2. Rigorous method validation: The validation process covered selectivity, specificity, LOQ, linearity, precision, accuracy, matrix effect, recovery, and stability. This extensive validation ensured the accuracy and reliability of the analytical process, meeting FDA validation standards.
3. Advanced analytical techniques: The study utilized advanced mass spectrometry and chromatographic conditions, including meticulous tuning for enhanced sensitivity, positive ion mode for better response, and sophisticated mass spectrometer features such as the TurboionsprayTM interface.
4. Efficient sample preparation: The researchers employed a cyclonic mixer for uniformity in sample preparation and utilized purification sequences for compound retrieval, ensuring thorough and precise sample processing.
5. Detailed stability testing: The stability tests included various conditions such as bench-top, freeze-thaw, autosampler, and extended-term stability, each with its own set of protocols. This comprehensive stability testing provided insights into the shelf-life and handling conditions for the samples.
Overall, the combination of thorough method development, rigorous validation, advanced analytical techniques, efficient sample preparation, and detailed stability testing makes this research work unique and innovative in the field of pharmacological studies.
CONCLUSION
The manuscript presents a developed and validated method across specific concentration ranges: 0.151 to 40.382 ng/ml for ELX, 0.101 to 30.010 ng/ml for IVA, and 20.187 to 6,026.032 ng/ml for TEZ. The method consistently maintained the precision within batches (intra-batch) and between batches (inter-batch), as denoted by %CV, below 15.0%, and the %accuracy exceeded 95%. Furthermore, the overall %Recovery for ELX, IVA, and TEZ surpassed 90%. The method’s selectivity, sensitivity, precision, and accuracy suit the intended study.
To summarize, our study’s methodology stands out because it is uncomplicated, executes rapidly, and can yield precise, accurate, and discriminating outcomes, perfectly in sync with FDA validation standards. It meets all the criteria of the strict standards set beforehand. Significantly, it identifies the minimum limits for quantification and detection, maintaining the LOQ precision consistently under the 1% mark. We achieved efficient extraction of both the analyte and IS via SPE. We made analytical enhancements in areas such as the linearity spectrum, choice of column, mobile phase, flow velocity, injection quantity, and the volume of plasma used. As a result, this method boasts superior selectivity, sensitivity, linearity, and repeatability in comparison to earlier methodologies.
ACKNOWLEDGMENTS
The authors would like to express their gratitude to Krishna University, Machilipatnam, Andhra Pradesh, India, for their valuable support in providing a literature survey and facilitating this research.
AUTHOR CONTRIBUTIONS
All authors made substantial contributions to conception and design, acquisition of data, or analysis and interpretation of data; took part in drafting the article or revising it critically for important intellectual content; agreed to submit to the current journal; gave final approval of the version to be published; and agree to be accountable for all aspects of the work. All the authors are eligible to be an author as per the International Committee of Medical Journal Editors (ICMJE) requirements/guidelines.
FINANCIAL SUPPORT
There is no funding to report.
CONFLICTS OF INTEREST
The authors report no financial or any other conflicts of interest in this work.
ETHICAL APPROVALS
This study does not involve experiments on animals or human subjects.
DATA AVAILABILITY
All data generated and analyzed are included in this research article.
PUBLISHER’S NOTE
All claims expressed in this article are solely those of the authors and do not necessarily represent those of the publisher, the editors and the reviewers. This journal remains neutral with regard to jurisdictional claims in published institutional affiliation.
USE OF ARTIFICIAL INTELLIGENCE (AI)-ASSISTED TECHNOLOGY
The authors declares that they have not used artificial intelligence (AI)-tools for writing and editing of the manuscript, and no images were manipulated using AI.
REFERENCES
1. Taylor-Cousar JL, Munck A, McKone EF, van der Ent CK, Moeller A, Simard C, et al. Tezacaftor-ivacaftor in patients with cystic fibrosis homozygous for Phe508del. N Engl J Med. 2017;377(21):2013–23.
2. Schneider EK, Reyes-Ortega F, Li J, Velkov T. Can cystic fibrosis patients finally catch a breath with lumacaftor/ivacaftor? Clin Pharmacol Ther. 2017;101(1):130–41.
3. Schneider-Futschik EK. Beyond cystic fibrosis transmembrane conductance regulator therapy: a perspective on gene therapy and small molecule treatment for cystic fibrosis. Gene Ther. 2019;26(9):354–62.
4. Qiu F, Habgood M, Schneider-Futschik EK. The balance between the safety of mother, fetus, and newborn undergoing cystic fibrosis transmembrane conductance regulator treatments during pregnancy. ACS Pharmacol Transl Sci. 2020;3(5):835–43.
5. Rowe SM, Daines C, Ringshausen FC, Kerem E, Wilson J, Tullis E, et al. Tezacaftor-ivacaftor in residual-function heterozygotes with cystic fibrosis. N Engl J Med. 2017;377(21):2024–35.
6. Rowe SM, McColley SA, Rietschel E, Li X, Bell SC, Konstan MW, et al. VX09-809-102 study group. Lumacaftor/Ivacaftor treatment of patients with cystic fibrosis heterozygous for F508del-CFTR. Ann Am Thorac Soc. 2017;14(2):213–9.
7. Donaldson SH, Pilewski JM, Griese M, Cooke J, Viswanathan L, Tullis E, et al. VX11-661-101 study group. Tezacaftor/ivacaftor in subjects with cystic fibrosis and F508del/F508del-CFTR or F508del/G551D-CFTR. Am J Respir Crit Care Med. 2018;197(2):214–24.
8. Paulin O, Schneider-Futschik E. Treatment challenges associated with drug-drug interactions in cystic fibrosis, in optimizing pharmaceutical treatment in cystic fibrosis. Karup, Denmark: ECFS.
9. Keating D, Marigowda G, Burr L, Daines C, Mall MA, McKone EF, et al. VX16-445-001 study group. VX-445-Tezacaftor-Ivacaftor in patients with cystic fibrosis and one or two Phe508del Alleles. N Engl J Med. 2018;379(17):1612–20.
10. Ghelani DP, Schneider-Futschik EK. Emerging cystic fibrosis transmembrane conductance regulator modulators as new drugs for cystic fibrosis: a portrait of in vitro pharmacology and clinical translation. ACS Pharmacol Transl Sci. 2019;3(1):4–10.
11. Middleton PG, Mall MA, D?evínek P, Lands LC, McKone EF, Polineni D, et al. VX17-445-102 study group. Elexacaftor-tezacaftor-ivacaftor for cystic fibrosis with a single Phe508del allele. N Engl J Med. 2019;381(19):1809–19.
12. Tan M, Reyes-Ortega F, Schneider-Futschik E. Successes and challenges: inhaled treatment approaches using magnetic nanoparticles in cystic fibrosis. Magnetochemistry. 2020;6:25.
13. Assessment Report. Committee for medicinal products for human use. Orkambi (Ivacaftor/Lumacaftor). London, UK: European Medicines Agency; 2015. Report No. EMEA/H/C/003954/0000
14. Schneider EK, Reyes-Ortega F, Wilson JW, Kotsimbos T, Keating D, Li J, et al. Development of HPLC and LC-MS/MS methods for the analysis of ivacaftor, its major metabolites and lumacaftor in plasma and sputum of cystic fibrosis patients treated with ORKAMBI or KALYDECO. J Chromatogr B Analyt Technol Biomed Life Sci. 2016;1038:57–62.
15. Schneider EK, Reyes-Ortega F, Li J, Velkov T. Optimized LC-MS/MS method for the high-throughput analysis of clinical samples of ivacaftor, its major metabolites, and lumacaftor in biological fluids of cystic fibrosis patients. J Vis Exp. 2017;128:56084.
16. Hanafin PO, Sermet-Gaudelus I, Griese M, Kappler M, Ellemunter H, Schwarz C, et al. Insights into patient variability during ivacaftor-lumacaftor therapy in cystic fibrosis. Front Pharmacol. 2021;12:577263.
17. Schneider E, Hanafin P, Rao G. A retrospective observational study: bidirectional pharmacokinetic interactions between ivacaftor-lumacaftor in cystic fibrosis. Eur Respir J. 2020;56:362
18. Masson A, Schneider-Futschik EK, Baatallah N, Nguyen-Khoa T, Girodon E, Hatton A, et al. Predictive factors for lumacaftor/ivacaftor clinical response. J Cystic Fibrosis. 2019;18(3):368–74.
19. Lim A, Balouch F, Cheney J, Lewindon P, Roberts J, Schneider-Futschik E, et al. Orkambi in patients with cystic fibrosis and severe liver disease. Annual Scientific Meeting, Transplantation Society of Australia and New Zealand, Melbourne, Victoria, Australia, Abstract No. TP 092, 2020.
20. Kuzyk MA, Parker CE, Domanski D, Borchers CH. Development of MRM-based assays for the absolute quantitation of plasma proteins. Methods Mol Biol. 2013;1023:53–82.
21. Hammad LA, Saleh MM, Novotny MV, Mechref Y. Multiple-reaction monitoring liquid chromatography mass spectrometry for monosaccharide compositional analysis of glycoproteins. J Am Soc Mass Spectrom. 2009;20(6):1224–34.
22. Quon BS, Dai DL, Hollander Z, Ng RT, Tebbutt SJ, Man SF, et al. Discovery of novel plasma protein biomarkers to predict imminent cystic fibrosis pulmonary exacerbations using multiple reaction monitoring mass spectrometry. Thorax. 2016;71(3):216–22.
23. Roberts JM, Dai DLY, Hollander Z, Ng RT, Tebbutt SJ, Wilcox PG, et al. Multiple reaction monitoring mass spectrometry to identify novel plasma protein biomarkers of treatment response in cystic fibrosis pulmonary exacerbations. J Cyst Fibros. 2018;17(3):333–40.
24. Guidance for Industry. Bioanalytical method validation center for drug evaluation and research. Silver Spring, MD: U.S. Department of Health and Human Services, Food and Drug Administration, 2001.
25. Su Q, Li J, Ji X, Li J, Zhou T, Lu W, et al. An LC-MS/MS method for the quantitation of cabozantinib in rat plasma: application to a pharmacokinetic study. J Chromatogr B Analyt Technol Biomed Life Sci. 2015;985:119–23.
26. Singh N, Bansal P, Maithani M, Chauhan Y. Development and validation of a novel stability-indicating RP-HPLC method for simultaneous determination of tezacaftor and ivacaftor in fixed dose combination. J Chromatogr Sci. 2020;58(4):346–54.