INTRODUCTION
Starch is a complex carbohydrate that is abundant in nature and is a staple food for many cultures. It is composed of long chains of glucose molecules that are linked together through alpha (α) glycosidic bonds. The structure of starch is highly dependent on its source and the processing method used to extract it. Common sources of starch include corn, wheat, potatoes, rice, and tapioca [1].
Starch is widely used in the pharmaceutical industry due to its many beneficial properties. It is commonly used as a binder, filler, and disintegrant in the manufacturing of tablets and capsules. Starch is also used as a coating agent to protect the active ingredient from environmental factors and to control the release of the drug in the body. In addition, starch is used in the production of intravenous solutions, creams, and ointments. The use of natural starches in the pharmaceutical industry has a long history and continues to play a vital role in the production of safe and effective drugs. Furthermore, natural starches offer a cost-effective and reliable option for pharmaceutical manufacturers [2–4].
Native starches are widely used in the pharmaceutical industry as excipients due to their availability, low cost, and nontoxicity [5]. However, they have several limitations that can impact their efficacy and safety in pharmaceutical formulations. Native starches have several limitations in the development of pharmaceutical formulations, including poor solubility, limited functionality, retrogradation, and poor compatibility with other excipients and active ingredients [6].
The modification of native starches has gained increasing attention in recent years due to the many advantages that modifiedstarches offer over native starches in various applications.
Modified starches offer several advantages over native starches, including improved solubility [7], enhanced functionality [8], improved stability [9], and improved compatibility [10,11] with other excipients and active ingredients.
Furthermore, modified starches can be tailored to specific applications, making them highly versatile and customizable. Modified starches can be used as binders, disintegrants, fillers, thickeners, stabilizers, and emulsifiers in various formulations. Moreover, the development of new and innovative modification techniques has made it possible to produce modified starches with improved properties while maintaining their natural origin. These techniques include physical, chemical, enzymatic, and genetic modifications, allowing for a wide range of modifications to be made to native starches to enhance their properties [12]. With ongoing research and innovation, modified starches are likely to continue to play a crucial role in the development of safe and effective pharmaceutical products for the benefit of patients worldwide.
Bananas are one of the world’s most widely consumed fruits and are a rich source of starch . There are over a thousand domesticated Musa cultivars characterized by significant genetic diversity, with challenges to banana production from virulent diseases, abiotic stresses, and demands for sustainability, quality, transport, and yield [13]. However, native banana starch (NBS) has limited functionality due to its poor solubility and stability, making it less suitable for use in various industrial applications [14]. By modifying banana starch, it may be possible to enhance its properties and expand its potential uses. One potential advantage of developing modified starch from bananas is its sustainability. Bananas are widely cultivated in many parts of the world, and banana starch production could be a sustainable and environmentally friendly alternative to other starch sources, such as corn or wheat. With the potential benefits of starch modification in mind, an attempt was made to develop modified banana starch using the hydroxypropylation method. The current investigation involved the preparation and physicochemical characterization of native starch (Musa paradisiaca) and also involves modification of prepared starch by hydropropylation method and its evaluation of the physicochemical and toxicity properties.
The importance of our study on hydroxyl propyl M. paradisiaca starch lies in its distinctive blend of being naturally derived, offering improved functionality, and perhaps being more cost effective. Although there are other inexpensive starches available, the combination of the widespread cultivation of bananas and the environmentally sustainable and regenerative characteristics of this starch make it unique. The hydroxyl propylation method enhances its functional characteristics, rendering it an appealing choice for medicinal applications. This study presents an innovative and economical option that meets the requirements of the industry for varied and sustainable sources of excipients, while also harmonizing with the changing preferences of the pharmaceutical sector.
MATERIALS AND METHODS
Materials
All the reagents and solvents used for the investigation were of synthetic grade procured from SD Fine Chem Ltd, Bangalore, India. Fresh banana fruits were collected from the local market.
Preparation of NBS
Banana starch was prepared by using a modification of the method reported by Bello-Pérez et al. [14]. The M. paradisiaca was cleaned, weighed, and chopped into small pieces with a knife before being homogenized with distilled water containing sodium metabisulphite (0.3%) at a ratio of distilled water: M. paradisiaca of 2:1 (w/v). The final homogenate was pressed through an annealed filter cloth until dry, and then collected into a container. After storing the filtrate or the resultant suspension for 24 hours, complete starch sediment was produced. The starch was obtained by decantation, and it was then dried for 24 hours in an oven (40°C–60°C). The starch was dried until the moisture content was within the specified range. A 24-mesh sieve was used to screen the dried starch [15].
Hydroxypropylation of NBS
A 500 ml solution of sodium sulfate (0.3%) was mixed with 100 g of starch. 0.5 ml of a 0.5% (w/w) propylene oxide solution was dropwise added into the agitated slurry after the pH had been adjusted to 9.5 with 0.1 M NaOH. The process was halted by lowering the pH to 5.5 with 0.5 N HCl after continuing for 15 minutes at 40°C [16].
Characterization of NBS and hydroxypropyl banana starch (HPBS)
Identification test: iodine test
The formation of a bluish-violet color after the addition of iodine indicates the starch presence [17].
pH
With 25 ml of CO2-free distilled water, 5 g of starch was mixed for 1 minute, and left for 15 minutes. The pH value was then determined using a pH meter.
Moisture content
In the oven for 3 hours at 105°C 3 g of banana starch was heated and weighed. The ratio of the final weight to the initial weight was articulated in terms of percentage.
Determination of loss on drying
One gram of starch was weighed, placed in a preheated bottle with a cap that had been heated to 105°C for 30 minutes, kept in the oven at 105°C, and dried until a constant weight was attained.
Determination of ash content
In a silica crucible, 2 g of starch powder was placed and incinerated. Using the following equation, the ash content was determined. By measuring the residue left behind after full combustion in a muffle furnace at 550°C, the ash value was determined.
Determination of the angle of repose (θ)
It was assessed by letting powder freely flow through a funnel. Ash content should be <1%. The addition of powder was halted as soon as the pile reached the tip of the funnel. Without disturbing the pile, a circle was drawn around it. The resultant cone’s height and diameter were measured. To determine the angle of repose, the following equation was used.
θ = tan−1 h/r
Determine density, Carr’s index, and Hausner ratio
After weighing an empty measuring cylinder (100 ml), the sample was added to it to make a volume of 100 ml (V0), and the combined weight was calculated (W2). The sample-filled measuring cylinder was set on a motorized tapping device. The measuring cylinder was tapped 50 times with the start button engaged. Following that, the sample’s volume was determined before (V1) and after (V2) tapping. The Hausner ratio, Carr’s index, tapped density, and bulk density were assessed using the formulas below.
Determination of amylose content
The Avaro et al. [18]method was slightly modified to determine the amylose content of M. paradisiaca starch.
Determination of λmax
In a test tube containing 9 ml of 1 N sodium hydroxide and 1 ml of 95% ethanol, pure amylose (100 mg) was added. A gel was produced in the test tube after it had been heated in boiling water for 10 minutes; it was then cooled. A 1 ml of 1 N acetic acid was added to a 5 ml aliquot of the solution to adjust the pH before being transferred to a 100 ml volumetric flask. Then, to produce exactly 100 ml, 2 ml of a 0.2% iodine solution and distilled water were added. The resultant mixture was incubated for 30 minutes before being homogenized. The absorption maxima (λmax) of the samples were determined using calorimetry within the wavelength range of 400–800 nm on a UV-VIS spectrophotometer [18].
Calibration curve of amylose
A calibration curve was generated for pure amylose over a spectrum of standard concentrations (40, 80, 120, 160, 200, 240, 280 μg/ml) in accordance with the methodology proposed by Avaro et al. [18], with minor adaptations. The quantification was conducted employing a UV-VIS spectrophotometer configured to a maximum wavelength of 620 nm to gauge the intensity of the resultant blue chromophore. Subsequently, a linear calibration curve was established, correlating amylose concentrations with corresponding absorbance measurements.
Determination of hydroxypropyl group percentage (HPG%) and degree of substitution (DS)
To obtain a transparent solution, 0.1 g of starch from the volumetric flask was combined with 25 ml of 1 N H2SO4 and boiled in a water bath. The volume was made up to 100 ml with distilled water after cooling to room temperature (RT). Eight milliliters of concentrated H2SO4 were added to 1 ml of this solution in a chilled conical flask. The flask was next heated for 20 minutes in a boiling water bath, cooled to RT, and then transferred to an ice bath. After that, 3% ninhydrin reagent (0.6 ml) prepared with 5% sodium metabisulphite was added, carefully mixed, and allowed to stand at RT for an additional hour. To measure absorbance at 590 nm in a UV spectrophotometer, volume was made up to 25 ml using concentrated H2SO4. Native starch was used as a standard. Aliquots of propylene glycol-containing standard aqueous solutions were used for constructing the calibration curve. DS values and HPG% were determined [19].
Swelling power and soluble starch content
One percent of the starch slurry was prepared, heated in a water bath that was kept at 90°C for 30 minutes while being constantly stirred, and then cooled. The suspension was centrifuged at 3,200 rpm for 10 minutes, and the supernatant was collected in an aluminum dish that had been preweighed and dried using an evaporator. For the purpose of determining soluble starch content, the dried aluminum dishes were weighed. To determine the swelling power, the weight of the wet sediment in the centrifuge tube was observed [20].
Determination of viscosity
Torque applied to a rotating spindle at a fixed speed and temperature is used to evaluate the viscosity of starch solutions produced by indirect heating. The viscosity was measured using a Brookfield Viscometer. The native and hydroxyl propyl starches were combined with distilled water to prepare the starch solution (1%, 2%, 3%, and 4%). After 20 minutes of boiling, the starch solution was cooled to RT. At spindle no. 2, at 100 revolutions per minute, the time was recorded [20].
Determination of Fourier transform infrared (FTIR) spectra
NBS and HPBS samples’ FTIR spectra were acquired at RT using the KBr disc method using an FTIR spectrophotometer (PerkinElmer, Spectrum Two DTGS, UK). Wave numbers between 4,000 and 400 cm−1 and a resolution of 4 cm−1 were used to obtain FTIR spectra [21].
Determination of gelatinization temperature by differential scanning calorimetry (DSC) studies
In the study of the gelatinization transitions in NBS and HPBS, DSC was used. The mass of each sample was 10 mg ± 0.1 with 75% (w/w) of deionized water. For the DSC analysis, a Q100 TA Instruments calorimeter was used. The samples were placed in aluminum hermetic sealed pans and were stabilized at RT for 15 minutes, then samples were heated in a ramp at 10°C/minute using an empty pan as a reference and a nitrogen environment [22].
1H NMR study
NBS and HPBS samples were prepared and nuclear magnetic resonance spectroscopy (NMR) spectra were measured as described previously [23]. d1-TFA was added directly to the medium just before the NMR measurement, and the whole mixture was transferred to a 5 mm NMR tube using a Pasteur glass pipet. The tube was sealed and wrapped with Parafilm before an NMR spectrum was recorded. The spectra were recorded on Bruker DRX 400.
Surface morphology analysis
The surface morphology of NBS and HPBS was examined by scanning electron microscopy (SEM) “(Zeiss EVO LS10, Cambridge, UK)” by using the gold-sputter method. The sample was fixed in a stub and coated with gold and imaging was performed [24].
X-ray diffraction (XRD)
The XRD patterns were acquired using the Panalytical X-Per Pro equipment, employing CuKα radiation (λ = 0.15405 nm). The 2θ detector was set to vary between 4 and 60, with a step size of 0.02 per measurement. To analyze the XRD patterns, Gaussian functions were fitted, and the total crystalline areas under the peaks were calculated using the Peakfit software [24].
In vivo toxicity evaluation of native and HPBS
Animals
Healthy female Wistar rats were used to conduct acute toxicity studies. Healthy female and male Wistar rats were employed for the assessment of subacute toxicity. The rats were 6–8 weeks old, and they were stabilized for 1 week to get used to the laboratory environment. They were housed in standard cages and maintained under standard conditions at a temperature of 22°C ± 3°C with a 12-hour cycle of light and darkness. A standard diet and unlimited access to tap water were made available to them. The study protocol was approved by the Institutional Animal Ethics Committee before the commencement of experimental studies (1567/PO/Re/S/11/ CPCSEA).
Acute toxicity evaluation
With an initial dosage of 2,000 mg/kg of HPBS, the acute oral toxicity test was conducted in accordance with the experimental methodology outlined in Organization for Economic Co-Operation and Development (OECD) Guideline 423. The number of animals employed in this evaluation was in accordance with OECD recommendations from 2011 and the reduction principle, i.e., employing the minimum number of animals necessary to achieve statistical significance. The animals were divided into three groups (n = 3). One group was given a single oral dosage of HPBS (2000 mg/kg) dissolved in water. Whereas group receives water (the control group) [25].
Subacute toxicity assessment
The approach suggested in guide 407 of the OECD guidelines was employed to determine the subacute toxicity of HPBS. The animals were divided randomly as follows: group 1 served as the control, group 2 served the high dose, group 3 served the middle dose, and group 4 served as the low dose group. Animals in groups 3 and 4 were necropsied at the end of the 28-day treatment period. For up to 14 days, the animals in groups 1 and 2 were left untreated. They had necropsies at the end of the recovery period. Before necropsy, all animals were starved for the whole night, and they were all put to death by carbon dioxide inhalation. Biochemical and hematological profiles were determined. Groups 1–4 were given target dosages of 0, 1,000, 500, and 250 mg starch/kg bw/day, respectively [26,27].
Body weight and clinical observation
Each rat was weighed before the test, once a week throughout the experiment, and on the day of sacrifice. Every day, the general state of health and mortality of every animal were monitored.
Hematological analysis
On a medonic M-series hematology analyzer, the following hematological parameters were analyzed: red blood cell counts (RBCs) white blood cell counts (WBCs), hemoglobin, packed cell volume, neutrophils, eosinophils, basophils, monocytes, lymphocytes, and hematocrit.
Biochemical analysis
A cardiac puncture was used to obtain blood samples, which were subsequently centrifuged for 5 minutes at 10,000 rpm in a nonheparinized tube. On a Photometer 5010 V5+ based on an enzymatic colorimetric test, serum was separated and examined for biochemical parameters such as electrolytes (sodium, chloride, calcium, and magnesium), as well as blood creatinine, blood urea, uric acid, total cholesterol, total bilirubin, aspartate aminotransferase (AST), and alanine aminotransferase (ALT). The cholesterol oxidase/P-aminophenazone technique was used to estimate the total cholesterol. According to the International Federation of Clinical Chemistry’s recommendations, ALT and AST were measured using the kinetic approach to determine their respective activities. Based on a colorimetric test for the kinetic detection of creatinine at 25°C and 37°C without deproteinization, creatinine was measured using the Jaffe reaction. The Berthelot technique was used to determine blood urea and uric acid levels.
Histopathology study
The kidney, lung, heart, liver, ovaries, spleen, and testis were carefully removed from the body and fixed in a fixation mixture containing 10% buffered formalin for histological analysis. Hematoxylin and eosin-stained paraffin sections of the organ were prepared and made ready for viewing on a light microscope equipped with an Optilab viewer.
RESULTS AND DISCUSSION
Characterization of NBS and HPBS
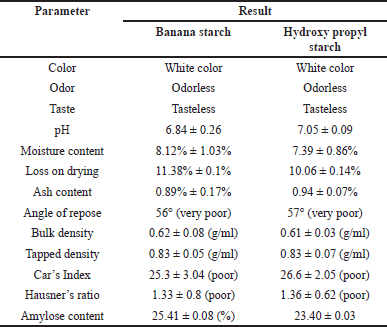
A qualitative test was used to identify NBS, which was shown by the appearance of a bluish-violet tint with the addition of an iodine solution. The color appeared as a result of interactions that amylopectin and amylose developed after iodine was added. Table 1 displays the characteristics of M. paradisiaca starch and hydroxyl propyl starch. The synthesized NBS and HPBS were white in color, with no characteristic taste or odor. Based on the sensory evaluation, NBs and HPBS powder met the required specifications with respect to their color, taste, and odor.
The pH of the NBS and HPBS was determined using a pH meter, and it was found to be 6.84 ± 0.26 and 7.05 ± 0.09, respectively. The pH value was within the acceptable range. A starch solution in water generally has a pH between 4 and 7.
The stability and quality of starch powder might rely on its moisture content. In comparison to starch powder with low moisture content, one with high moisture content is more prone to microbial growth. Starch should have a moisture content of <20%. It was found that NBS and HPBS powders had moisture contents of 8.12% ± 1.03% and 7.39% ± 0.86%, respectively.
 | Table 1. Characteristics of NBS and hydroxy propyl starch. [Click here to view] |
The loss on drying test is used to determine the amount of water lost during the heating process. The outcome shows that the loss on drying of NBS and HPBS was 11.38% ± 0.1% and 10.06% ± 0.14%, respectively; these values met the necessary requirements. The loss on drying of the starch was, in general, <15%.
The external and internal mineral contents, commencing from the initial process until the formation of starch, were measured using the ash content. Mineral content may result in a faster combustion process that produces ash residue. This may reduce the purity and quality of the resultant starch. The ash content of NBS and HPBs was found to be 0.89% ± 0.17% and 0.94% ± 0.07%, respectively. In general, the ash content should be <1%. The findings met the standards limit.
The bulk densities of the NBS and HPBS were observed to be 0.62 ± 0.08 (g/ml) and 0.61 ± 0.03 (g/ml), respectively. A starch sample’s degree of coarseness and packing index are both stated in terms of bulk density. The tapped densities of the NBS and HPBS were noticed to be 0.83 ± 0.05 (g/ml) and 0.83 ± 0.07 (g/ml), respectively. There is no significant difference in the tapped density and bulk density of the NBS and HPBs.
Testing the flow characteristics of the prepared starch powder was part of evaluating its physical quality. The Hausner ratio, Carr’s index, and angle of repose were used to demonstrate flow characteristics. Measuring the slope of the cone after the flowability of starch powder yields the angle of repose. Carr’s index describes a powder’s capacity to squeeze or constrict with the application of compression force, hence reducing its volume. It is well known that Carr’s index and Hausner ratio have a substantial impact on powder flowability. The greater the powder’s flowability, the lower its Carr’s index and Hausner ratio. It was determined that NBS and HPBS powders had poor flowability based on the aforementioned three factors. Starch generally has poor flow characteristics.
In general, there are two major D-glucopyranose polymer component types that makeup starch: a chain polymer (amylopectin) and a linear polymer (amylose). Amylose has a very excellent capacity for swelling and can quickly absorb water. When amylopectin is suspended in hot water, it becomes gooier and has the propensity to form a gel. As a result, amylopectin is frequently utilized as a reliable binding agent. The amylose concentration of starch is often lower than that of amylopectin. Amylose is a key component of the gelatinization process and greatly influences the features of the starch paste form. Because there are more linear chains in the granules of starch with a high amylose concentration, there is a stronger hydrogen bonding and more energy is needed for gelatinization. Amylopectin, on the other hand, has a long branch chain and a propensity to form a gel. The amylose content of NBS was 25.41% ± 0.08%, as described in Table 1. The standard curve for the estimation of amylose percentage in banana starch is shown in Figure 1. Table 2 represents the % of amylase in banana starch at different concentrations.
HPG% and DS
The amount of hydroxyl groups in the repeating unit that may be chemically altered is known as the DS. As a result, the maximum DS varies depending on the polysaccharide’s structure and is constrained by the total amount of hydroxyl groups that may be found inside the repeating unit. The DS and HPG percentage was found to be 0.028 and 2.894 were within the acceptable limits proposed by the Food and Drug Administration (FDA), i.e., 0.2% and 7%, respectively (Table 3). The standard calibration curve of propylene glycol was depicted in Figure 2.
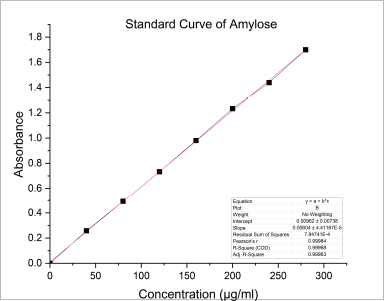 | Figure 1. Standard curve for estimation of amylose percentage in banana starch. [Click here to view] |
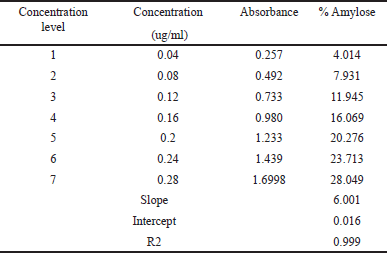 | Table 2. The amylose content of M. paradisiaca starch. [Click here to view] |
FTIR spectroscopic studies
The FTIR spectra of the NBs and HPBS are presented in the following (Figs. 3 and 4). The infra red radiation (IR) band at 1,347 cm−1 exhibited C–H stretching of the propyl group, and the band at 1,415 cm−1 has been assigned to the bending vibration of CH2. The IR band at 1,635 cm−1 depicts the bending vibration of H–O–H. The band at 2,927 cm−1 was due to symmetrical stretching of H–C–H. IR band at 2,885 cm−1 was attributed to symmetric and asymmetric stretching of the methyl group formed by hydroxypropylation. The broad IR band at 3,324 cm−1 represents the hydroxy group of the native starch structure, and a medium-sharp peak at 3,530 cm−1 also represents the hydroxy group of the propyl starch. The strong peak at 1,068 cm−1 represents the ether bond (C–O) stretching.
Determination of gelatinization temperature by DSC
Gelatinization is a process in which starch granules absorb water and swell, leading to the disruption of the granular structure. During this process, the starch undergoes a phase transition from a crystalline state to an amorphous state. The gelatinization temperature is the point at which this transition occurs. Figure 5 shows DSC thermograms for samples NBS and HPBS with 75% water. The endothermic peak indicates the gelatinization transition of both starches. Gelatinization temperatures are 75.4°C for NBS and 73.10°C for HPBS. The area under the thermogram (ΔHp) represents starch in the amorphous phase. HPBS exhibits lower gelatinization temperature than NBS. This temperature difference suggests that the modification of NBS resulted in changes in its gelatinization behavior.
1HNMR study
The 1H NMR spectra provide valuable information about the chemical environments of the protons in both NBS (Table 4, Fig. 6) and hydroxypropyl starch (HPBS) (Fig. 7). Comparing the two spectra, it is evident that some changes occurred in the chemical shifts after the hydroxyl propylation process. Notable differences between NBS and HPBS include: The appearance of new peaks in the HPBS spectrum at δ 5.04 (dq, 2H) and δ 4.24 (dd, 2H). These additional signals indicate the presence of modified hydroxypropyl groups in HPBS, suggesting the successful introduction of hydroxypropyl substituents to the starch structure. Changes in the chemical shifts of certain peaks, such as δ 3.94 (d, 2H) and δ 3.83 (dddd, 1H) in HPBS, suggest alterations in the local chemical environment due to the modification. The peak at δ 1.16 (d, 6H) in HPBS indicates the presence of methylene groups, likely arising from the hydroxypropyl substituents.
 | Table 3. Standard calibration curve values of propylene glycol and sample absorbance values of HPBS. [Click here to view] |
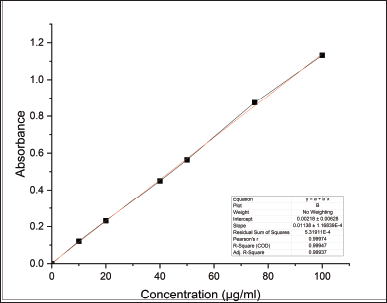 | Figure 2. Standard calibration curve of propylene glycol. [Click here to view] |
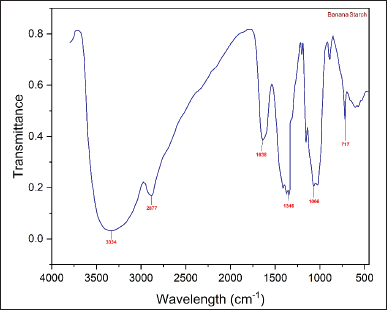 | Figure 3. FT-IR spectra of NBS. [Click here to view] |
Surface morphology analysis
Sizes of native starch granules ranged from 2 to 5 μm, and granules were polygonal in shape. The particle shape appeared to be irregular to spherical in both NBS and hydroxypropyl starch (Fig. 8a and b).
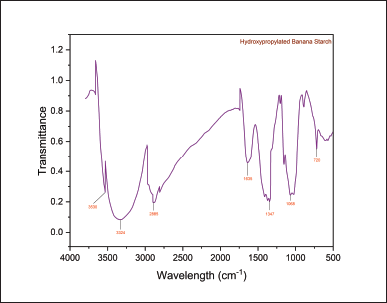 | Figure 4. FT-IR spectra of HPBS. [Click here to view] |
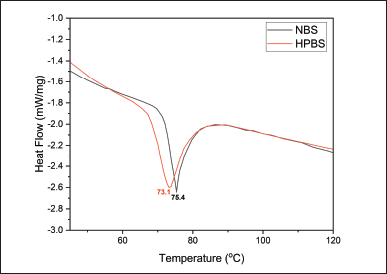 | Figure 5. DSC Thermogram of NBS and HPBS. [Click here to view] |
Swelling power and soluble starch content
The swelling power and soluble starch content of the NBS and HPBS are depicted in Table 5. Swelling power measures, a starch’s ability to retain water and has often been used to compare different types of starches. The percentage of starch that is leached into the supernatant during the estimation of swelling volume is known as solubility. Results of swelling power analysis of native starch and hydroxypropyl starch of bananas display that the native starch possesses superior swelling power (26.68 ± 1.06) compared to propyl starch swelling power (15.66 ± 0.61). In terms of soluble starch content (%), modified starch displayed a higher solubility percentage (69.21 ± 2.04) compared to the native starch (17.01 ± 1.06). Cooked cereal starches’ swelling power was largely influenced by amylopectin, whereas amylose is the swelling inhibitor and diluent. Due to its water absorption capacity, or maybe because it contains less amylose, HPBS has the highest solubility.
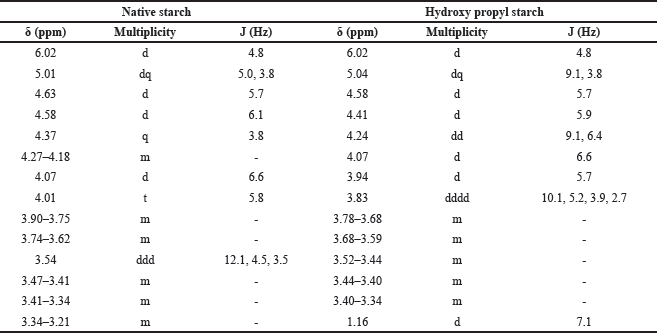 | Table 4. HNMR data of native and HPBS. [Click here to view] |
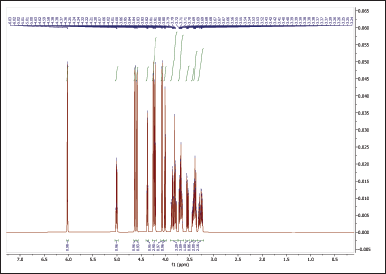 | Figure 6. 1HNMR spectrum of NBS. [Click here to view] |
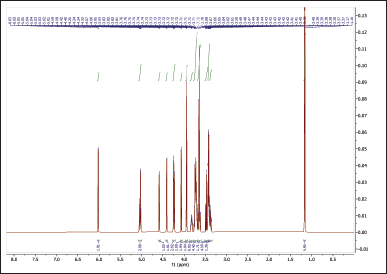 | Figure 7. 1HNMR spectrum of HPBS. [Click here to view] |
 | Figure 8. (a) SEM image of banana starch. (b) SEM image of HPBS. [Click here to view] |
Determination of viscosity
Results showed that the hydroxypropyl starch yielded a high viscosity relative to the native starch in all the concentrations of starch solutions (Table 6). This increased viscosity of the hydroxypropyl starch may be due to the increased soluble content of the starch offered by the hydroxypropylation (Fig. 9).
X-ray diffraction
The XRD patterns for native and modified starches reveal that both starches have semicrystalline structures.
The crystalline nature of the original starch is identified by the presence of well-defined diffraction peaks at 14.9, 19.3, and 22.8, as well as a doublet ranging from 16.8 to 17.8. The observed patterns can be ascribed to the crystal polymorph structure of type A.
After being subjected to modification, the XRD pattern of the starch exhibits a substantial resemblance to its original state, as evidenced by the persistence of the doublet at 16.8–17.8 and the peaks at 14.7 and 22.6. Nevertheless, the presence of the peak at 19.3 is no longer observed, suggesting a decrease in the crystalline region of the modified sample in comparison to the extracted native sample (Fig. 10).
 | Table 5. Swelling power and soluble starch content of native starch and hydroxy propyl starch. [Click here to view] |
 | Table 6. Viscosity of native starch and hydroxyl propyl starch. [Click here to view] |
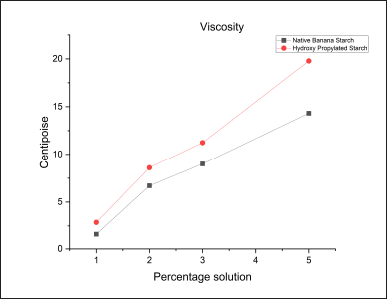 | Figure 9. Viscosity of native starch and hydroxyl propyl starch. [Click here to view] |
Acute toxicity study
After receiving a single oral dosage of the testing solution (HPBS) containing 2,000 mg/kg body weight, none of the female rats showed any indicators of toxicity or mortality over the 14-day acute toxicity investigation period. The rate of weight gain was normal, and the rise in body weight was modest. All test animals had a gross necropsy after 14 days of therapy, and no aberrant organs were found upon microscopic examination. This finding implies that, following an acute exposure, the HPBS was not toxic. The findings show that, in accordance with the OECD’s recommendations for acute systemic toxicity labeling and classification, the HPBS was assigned a Class 5 status, indicating that there was a reasonably low risk of acute toxicity with an oral LD50 in the 2,000–5,000 mg/kg range.
Subacute toxicity study
None of the groups, including the one that received the highest test dosage, i.e., 1,000 mg/kg bw, displayed any fatalities or clinical symptoms of toxicity in the rats, and all the animals survived during the study period. The percentage of weight gain was normal, and the rise in body weight was modest (Table 7). The results indicate the safety profile of HPBS.
Hematological analysis
After administering HPBS for 28 days, the hematological profiles of male and female rats are shown in Table 8. Most hematological parameters were unaltered by the oral administration of the HPBS suspensions. For all parameters, the results demonstrate that none of the groups deviated substantially from the control group.
It is crucial to analyze hematological parameters to determine the pathological and physiological status of the body, as well as the toxic effects of test compounds. This is because changes in these parameters could be a sign of the toxicity of the test substances as well as infections, inflammation, leukemia, and anemia. Indicating that the HPBS had no impact on the circulating blood cells of the tested animals, there was no significant difference in WBC, hemoglobin, RBC counts, packed cell volume, neutrophils, eosinophils, basophils, monocytes, lymphocytes, and hematocrit between the treated groups and the control group.
Biochemical analysis
Following 28 days of administration of HPBS, the biochemical profiles of female and male rats are shown in Table 9. The oral administration of the HPBS altered certain metabolic markers. AST, total albumin, and ALT levels were considerably lower in female and male rats than in the control group. Blood urea and creatinine levels were slightly lower in the treatment groups than in the control group. While there was no significant change in the uric acid levels between the control and treatment groups. Total protein and albumin levels were significantly elevated in the treatment groups. Total cholesterol levels were elevated in treatment groups, especially in male rats. The levels of sodium and chloride were elevated in the treatment groups, compared to the control group. The levels of calcium and magnesium were suppressed in treatment groups, especially in male rats, in contrast to the control group.
 | Table 7. Body weights of rats treated with hydroxypropyl starch. [Click here to view] |
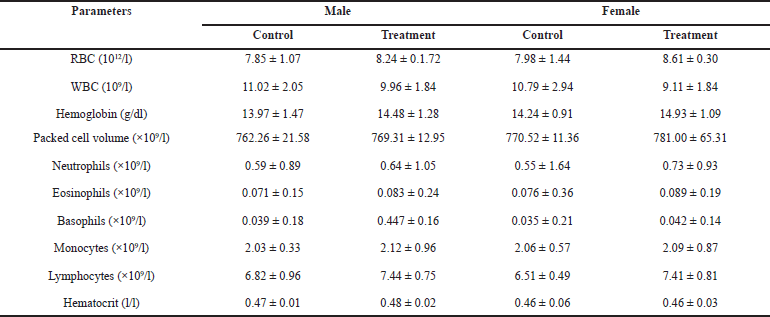 | Table 8. Hematological profile of rats treated with different concentrations of the HPBS for 28 days. [Click here to view] |
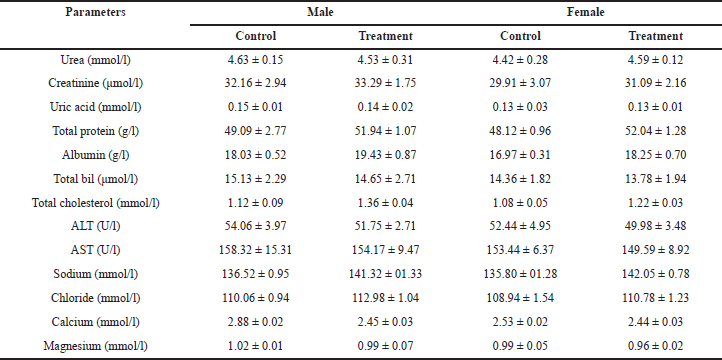 | Table 9. Biochemical profile of rats treated with different concentrations of the HPBS for 28 days. [Click here to view] |
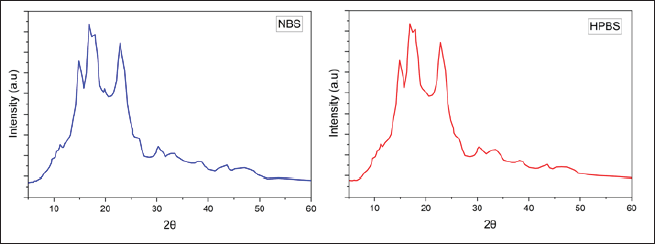 | Figure 10. X-Ray diffraction of NBS and HPBS. [Click here to view] |
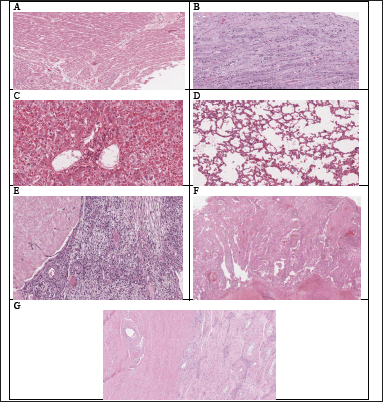 | Figure 11. Histopathological examination of various organs of rats treated with HPBS in a subacute oral toxicity study: (A–G) the heart, kidney, liver, lung, ovaries, spleen and testis respectively. [Click here to view] |
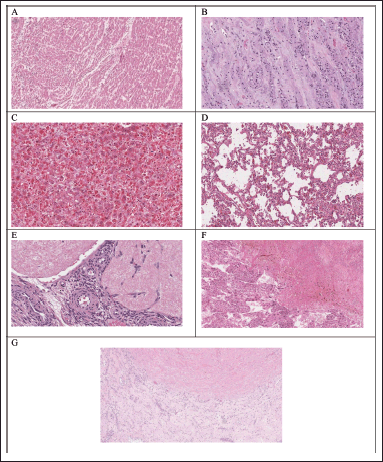 | Figure 12. Histopathological examination of various organs of control rats in subacute oral toxicity study: (A–G) the heart, kidney, liver, lung, ovaries, spleen, and testis, respectively. [Click here to view] |
Histopathology study
Hematological and biochemical analyses are supported by histopathological investigations. When compared to the control groups (Fig. 12E–G), the histological analysis carried out in the current study revealed that animals treated with HPBS did not exhibit changes in the texture, size, shape, and color of the kidney, liver, heart, spleen, ovaries, testis, and lung. These results are consistent with the measured hematological and biochemical parameters and indicate that HPBS has no detrimental impacts on vital organs, even when repeated dosages are used.
The myocardium in the heart was depicted by cardiac striated muscle cells, which had single or double nuclei that were positioned in the center and showed transverse striations. The endocardium covered cavities and heart valves with endothelium, which was supported by a thin basal membrane. The mesothelial pavement cells that cover the epicardium were completely intact (Fig. 11A).
The lobular morphology of the kidneys was maintained, and medullary pyramids were covered with cortical tissue. The cortex displayed fine Bowman capsules and glomeruli that were distributed evenly. As with the Henle loops and collecting ducts of the medullary pyramid, the proximal and distal contorted tubules and the section of the collecting duct showed no histological peculiarities. There was no fibrosis or inflammatory response found in the interstice (Fig. 11B).
The hepatic parenchyma, which consists of the lobular center vein surrounding hepatocyte cords and sinusoid capillaries, was seen to be evenly distributed and to still have its original architecture in the liver. The hepatocyte had a polygonal form, a spherical nucleus, and a totally intact center region (Fig. 11C).
Lung tissue sections from mice in all test groups that underwent histopathological investigation revealed a normal morphological structure without any pathological alterations (Fig. 11D). The histopathological analysis of the ovaries, spleen, and testis also displayed normal architecture (Fig. 11E–G).
CONCLUSION
The NBS was modified using a propylene oxide solution. Both the starches were characterized for flow properties, amylose content, swelling index, soluble starch content hydroxypropyl percentage, DS, viscosity, and where as toxicity studies were performed for HPBS. The physicochemical properties met the required specifications. The modified starch showed increased soluble starch content and viscosity. The acute and subacute toxicity studies of NBS and HPBS showed that both single-dose and repeated doses did not lead to mortality or signs of toxicity in rats. As a result, the LD50 of the samples for rats in the acute test is greater than 2,000 mg/kg, and in the subacute test, it is greater than 1,000 mg/kg, indicating a possibility for safe usage. Histopathological analysis of HPBS on vital organs showed normal architecture. This study’s characterization results indicates that HPBS is safe for use as pharmaceutical excipients, as their physicochemical parameters fall within the limits approved by the FDA and are nontoxic.
AUTHOR CONTRIBUTIONS
All authors made substantial contributions to the conception and design, acquisition of data, or analysis and interpretation of data; took part in drafting the article or revising it critically for important intellectual content; agreed to submit to the current journal; gave final approval of the version to be published; and agree to be accountable for all aspects of the work. All the authors are eligible to be an author as per the International Committee of Medical Journal Editors (ICMJE) requirements/guidelines.
FINANCIAL SUPPORT
There is no funding to report.
CONFLICTS OF INTEREST
The authors report no financial or any other conflicts of interest in this work.
ETHICAL APPROVALS
Toxicity studies of HPBS performed on animals were approved by the Institutional Animal Ethical Committee, Marri Laxman Reddy Institute of pharmacy, Hyderabad Approval No: 1567/PO/Re/S/11/CPCSEA).
DATA AVAILABILITY
All data generated and analyzed are included in this research article.
PUBLISHER’S NOTE
This journal remains neutral with regard to jurisdictional claims in published institutional affiliation.
REFERENCES
1. Wang X, Huang L, Zhang C, Deng Y, Xie P, Liu L, et al. Research advances in chemical modifications of starch for hydrophobicity and its applications: a review. Carbohydr Polym. 2020;240:116292. CrossRef
2. Builders PF, Arhewoh MI. Pharmaceutical applications of native starch in conventional drug delivery. Starch. 2016;68:864–73. CrossRef
3. Lawal MV. Modified starches as direct compression excipients— effect of physical and chemical modifications on tablet properties: a review. Starch. 2018;71:1800040. CrossRef
4. Masina N, Choonara YE, Kumar P, du Toit LC, Govender M, Indermun S, et al. A review of the chemical modification techniques of starch. Carbohydr Polym. 2017;157:1226–36. CrossRef
5. Lemos PVF, Marcelino HR, Cardoso LG, de Souza CO, Druzian JI. Starch chemical modifications applied to drug delivery systems: from fundamentals to FDA-approved raw materials. Int J Biol Macromol. 2021;184:218–34. CrossRef
6. Kunle OO. Review: pharmaceutical grade starch and some of its potential sources in Nigeria. J Phytomed Ther. 2002;7(1 & 2):1–17.
7. Benyerbah N, Ispas-Szabo P, Sakeer K, Chapdelaine D, Mateescu MA. Ampholytic and polyelectrolytic starch as matrices for controlled drug delivery. Pharmaceutics. 2019;11:253. CrossRef
8. Lemos PVF, Opretzka LCF, Almeida LS, Cardoso LG, da Silva JBA, de Souza CO, et al. Preparation and characterization of C-phycocyanin coated with STMP/STPP cross-linked starches from different botanical sources. Int J Biol Macromol. 2020;159:739–50. CrossRef
9. Mora CP, Martinez-Alejo JM, Roman L, Martinez MM, Carvajal T, Pinal R, et al. Molecular and physical characterization of octenyl succinic anhydride-modified starches with potential applications in pharmaceutics. Int J Pharm. 2020;579:119163. CrossRef
10. Bertoft E. Understanding starch structure: recent progress. Agronomy. 2017;7(3):56–67. CrossRef
11. Quadrado RFN, Fajardo AR. Microparticles based on carboxymethyl starch/chitosan polyelectrolyte complex as vehicles for drug delivery systems. Arab J Chem. 2020;13(1):2183–94. CrossRef
12. Bhatt P, Kumar V, Goel R, Sharma SK, Kaushik S, Sharma S, et al. Structural modifications and strategies for native starch for applications in advanced drug delivery. Biomed Res Int. 2022;2022:1–14. CrossRef
13. Heslop-Harrison JS, Schwarzacher T. Domestication, genomics and the future for banana. Ann Bot. 2007;100(5):1073–84. CrossRef
14. Jyothi AN, Sajeev MS, Sreekumar JN. Hydrothermal modifications of tropical tuber starches. 1. Effect of heat-moisture treatment on the physicochemical, rheological and gelatinization characteristics. Starch Stärke. 2010;62:28–40. CrossRef
15. Bello-Pérez LA, Romero-Manilla R, Paredes-López O. Preparation and properties of physically modified banana starch prepared by alcoholic-alkaline treatment. Starch Stärke. 2000;52(5):154–9. CrossRef
16. Hadisoewignyo L, Foe K, Tjandrawinata RR. Isolation and characterization of Agung Musa paradisiaca starch from East Java Indonesia. Int Food Res J. 2017;24(3):1324–30.
17. Puri AV, Khandagale PD, Tiwari AU, Chaudhary RH, Kartan SB. Synthesis and physicochemical characterization of banana starch tartrate and its application as disintegrant in Telmisartan tablets. J Drug Deliv Ther. 2020;10(3):65–72. CrossRef
18. Avaro MR, Pan Z, Yoshida T, Wada Y. Two alternative methods to predict amylose content of rice grain by using tristimulus CIE lab values and developing a specific color board of starch-iodine complex solution. Plant Prod Sci. 2011;14(2):164–8. CrossRef
19. Dolas K, Ranveer R, Tapre A, Nandane A, Sahoo A. Effect of starch modification on physico-chemical, functional and structural characterization of cassava starch (Manihot esculenta Crantz). Food Res. 2020;4(4):1265–71. CrossRef
20. Brhane Y, Gebre-Mariam T, Belete A. Synthesis, characterization, and in vivo safety evaluation of propyl Dioscorea abyssinica starch. PLoS One. 2022;17(11):1–15. CrossRef
21. Awolu O, Odoro JW, Adeloye JB, Lawal OM. Physicochemical evaluation and Fourier transform infrared spectroscopy characterization of quality protein maize starch subjected to different modifications. J Food Sci. 2020;85(10):3052–60. CrossRef
22. Biliaderis CG, Maurice TJ, Vose JR. Starch gelatinization phenomena studied by differential scanning calorimetry. J Food Sci. 1980;45(6):1669–74. CrossRef
23. Schmitz S, Dona AC, Castignolles P, Gilbert RG, Gaborieau M. Quantification of the extent of starch dissolution in dimethylsulfoxide by 1 H NMR spectroscopy. Macromol Biosci. 2009;9:506–14.
24. Kaur M, Oberoi DP, Sogi DS, Gill BS. Physicochemical, morphological and pasting properties of acid treated starches from different botanical sources. J Food Sci Technol. 2010;48(4):460–5. CrossRef
25. Lipnick RL, Cotruvo JA, Hill RN, Bruce RD, Stitzel KA, Walker AP, et al. Comparison of the up-and down, conventional LD50, and fixed dose acute toxicity procedures. Food Chem Toxicol. 1995;33:223–31.
26. Sutrisni N, Soewandhi S, Adnyana I, Sasongko L. Acute and subchronic (28-day) oral toxicity studies on the film formulation of K-Carrageenan and konjac glucomannan for soft capsule application. Sci Pharm. 2019;87(2):1–9. CrossRef
27. Brígido HP, Varela EL, Gomes AR, Bastos ML, De Oliveira Feitosa A, Do RosárioMarinho AM, et al. Evaluation of acute and subacute toxicity of ethanolic extract and fraction of alkaloids from bark of Aspido spermanitidum in mice. Sci Rep. 2021;11(1):97637–41. CrossRef