INTRODUCTION
Fish is the best source of fatty acids (FAs), especially polyunsaturated FAs (PUFAs) (eicosapentaenoic acid, EPA, and docosahexaenoic acid, DHA). These FAs are key nutrients whose beneficial role in human health such as the prevention of mammary tumors [1], cardioprotective effects [2], antidiabetic effect [3,4], and anti-inflammatory [5]. Fish oil is widely accepted as healthy food; therefore, providing nutritional value information especially PUFAs contents is important [6].
FA composition of fish oil has been published by several researchers such us 34 marine water fish from the Mediterranean sea [7], 20 species of marine fish, and 4 species of shellfish from Malacca straits [8], microalga oil and fish oil from Ocean Nutrition Canada Ltd. [9]. Each species of fish even in white and dark muscle has a different FA composition. This difference is affected by several factors such as type and abundance of food, habitat, salinity, temperature, size, life stage, and age [7].
Some methods have been reported for the identification and determination of FA in fish oils, including gas chromatography (GC)-mass spectrometry for the identification and determination of EPA and DHA in fish oil capsules [10]. Raman combined partial least squares regression (PLSR) for analyzing omega-3 in an intact fish oil capsule [11], Fourier transform infrared (FTIR), near-infrared (NIR), and Raman spectroscopic combined chemometrics, namely PLSR for prediction of EPA, DHA, and total omega-3 FAs in fish oil supplement [12–14]. In addition, an esterified omega-3 supplement commercial was identified using FTIR-attenuated total reflectance (ATR) spectra, while 1H NMR spectra were used to determine the relative concentration of DHA and EPA [15]. Viswanathan et al. [16] have reported using reverse phase high-performance liquid chromatography coupled with mass spectrometry for the quantification of ethyl ester of EPA and DHA. Meanwhile, GC with flame ionization detection (GC-FID) has often been used to quantify and profile the FAs in fish [17,18]. However, GC generating a massive amount of data and retrieving complex biochemical information demands powerful statistical tools, namely chemometrics [19]. In addition, Xiao et al. [18] have stated that chemometrics technique was proposed as s powerful tool for the determination of dynamic multiparametric of living systems. Thus, this study aimed to quantify and classify FAs in marine fish oil from Southeast Sulawesi using GC and chemometrics.
MATERIALS AND METHODS
Materials
Twenty species of marine fish were collected from different locations around the Southeast Sulawesi coast, Indonesia (Fig. 1). Each location consists of 5 kg/species with a weight range of 300–500 g to minimize variation possibilities and preserve the homogeneity of fish samples. All samples were collected fresh and caught within a period of 0–24 hours. The fish samples were eviscerated, filleted, packed flake ice in a cooling box, and sent to the Farmacy Laboratory of Halu Oleo University. The filleted fish samples were dried at a temperature of 80°C–90°C (2 × 24 hours) using an oven (Stuart Scientific) according to the methods described by Alinafiah et al. [17] with slight modification, powdered (Philips blender), and then stored at 4°C for future analysis. n-Hexane, heptane, ethanol, and all reagents used for analysis were of analytical grade and were supplied by E. Merk Darmstadt, Germany.
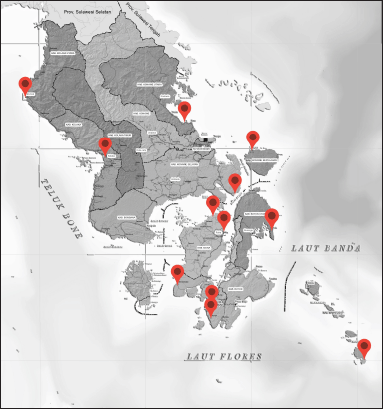 | Figure 1. Location of sample collection. [Click here to view] |
Fish oils extraction
Marine fish oils were extracted using Soxhlet methods according to the methods described by Rincón-Cervera et al. [6] with slight modifications. Powdered fish (50 g) were placed in a Soxhlet apparatus and extracted with 750 ml n-hexane for 2 hours at a temperature of 80°C. After extraction was complete, n-hexane was evaporated at 50°C using a rotary evaporator (Stuart). The oils were collected, weighed, and stored at 4°C.
Oils purification
Crude fish oils were purified using bentonite at a ratio of 1% (w/w) of oils weight, centrifuged (Boeco Germany) for 5 minutes, filtered, and stored in a dark bottle in a freezer for subsequent analysis [20].
FAs analysis
The FA analysis of marine fish oils was carried out according to Irnawati et al. [21]. FAs were derived from FAs methyl esters (FAMEs). FAMEs of each oil sample (0.4 g) were prepared using an alkali catalyzed (1.5 ml of methanolic potassium hydroxide) and in a crew-capped glass test tube. The mixtures were heated at 60°C for 10 minutes, cooled at room temperature, and then added 2 ml of boron trifluoride-methanol. The sample mixtures were heated again under the same conditions; when cooled, 1 ml of heptane was added with 1 ml of sodium chloride and shacked. Finally, the upper heptane layer was collected for FA analysis using an Agilent GC (7890B) equipped flame ionization detector and an HP-88 capillary column (100 m × 0.3 mm × 0.2 μm). The temperature program was 5 minutes at 100°C, heating until 240°C at a rate of 4°C/minute, holt time at 15 minutes. The temperature of the injector was 260°C with a split ratio of 10:1, and injection volume was 1 μl. The detector temperature was 260°C. Helium was used as carrier gas (1.8 ml/minute). Peak identification was carried out by comparing the retention time from CRM47885 FAME Mix standards (Supelco) (Fig. 2).
 | Figure 2. Chromatogram of FAMEs mix standards (CRM47885) using a GC (Agilent, 7890B) with flame ionization detector. [Click here to view] |
Classification of marine fish oil
Pattern recognition analysis unsupervised techniques, namely principal component analysis (PCA) and supervised techniques, namely partial least-square-discriminant analysis (PLS-DA), sparse variant PLS-DA (sPLS-DA), and orthogonal PLS-DA (OPLS-DA) were used in this study. The concentration of FA compositions was used as a variable during the classification of marine fish oil from different origins.
RESULT AND DISCUSSION
FAs analysis of marine fish oil
In this study, FAs from marine fish oils extracted from Epinephelus sp. and Lutjanus sp. were measured using GC-FID. The sampling of marine fish was done from several locations in South East Sulawesi province as illustrated in Figure 1. Different locations affected the compositions of FAs in each type of fish oil due to the difference in environment which is associated with the difference in nutrition sources. Table 1 shows the result of FAs analysis using the GC-FID technique from Epinephelus sp. and Table 2 from Lutjanus sp. fish oils. Total saturated FAs (SFA), monounsaturated (MUFA), and polyunsaturated (PUFA) percentages for both ranged from 45.59% to 61.42%, 20.32% to 39.30%, and 12.97% to 24.56%, respectively. The important FAs identified in most samples were myristic/C14:0 (1.89%–8.49%), palmitate/C16:0 (24.30%–33.68%), heptadecanoic/C17:0 (1.49%–2.87%), stearate/C18:0 (5.90%–13.38%), tricosanoate/C23:0 (0.12%–8.66%), lignocerate/C24:0 (1.80%–4.99%), palmitoleic/C16:1 (4.05%–8.11%), oleate/C18:1c (9.76%–22.58%), nervonate/C24:1 (0.13%–5.77%), linolelaidate/C18:2t (0.11%–5.67%), linoleate/C18:2c (0.19%–5.36%), and cis-4,7,10,13,16,19-docosahexaenoate, DHA/C22:6 (4.31%–21.84%).
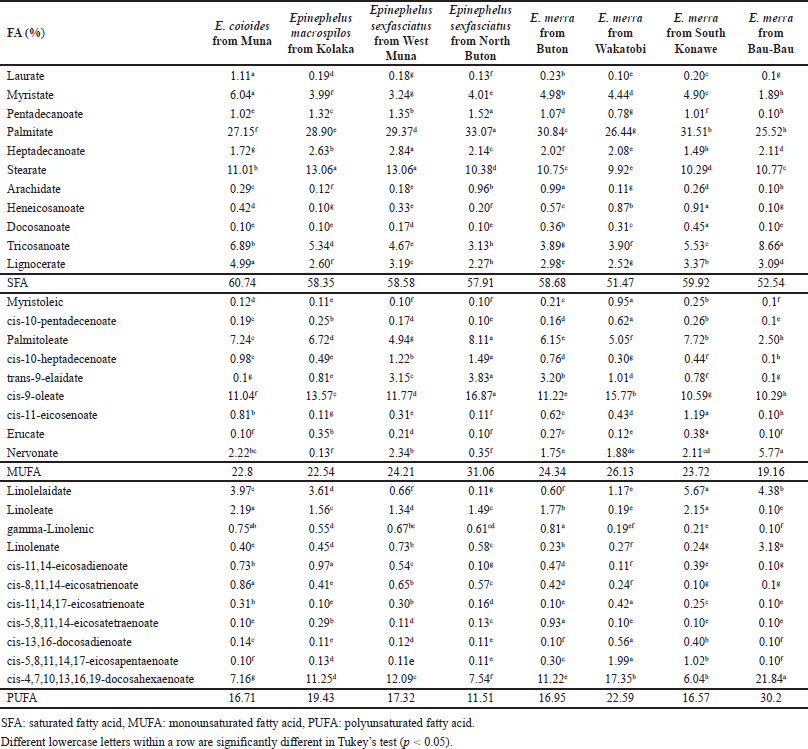 | Table 1. FA composition measured using a GC-FID from Epinephelus sp. fish oils. [Click here to view] |
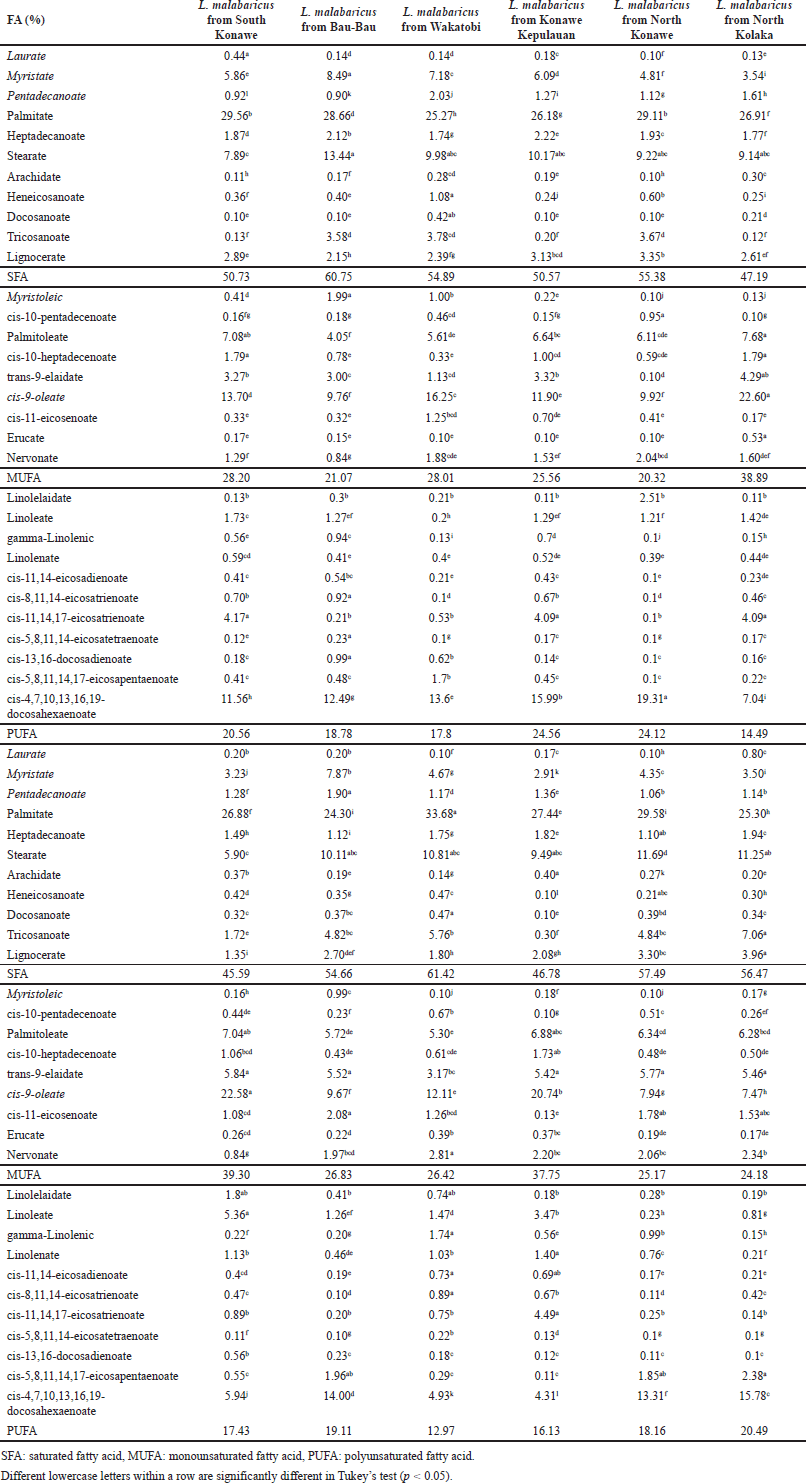 | Table 2. FA composition measured using a GC-FID from Lutjanus sp. fish oils. [Click here to view] |
Palmitic acid (C16:0) and stearic acid (C18:0) were the dominant SFA, contributing 44.46%–54.60% and 12.94%–23.11% of the total SFA of lipids for all samples, respectively. Palmitoleic acid (C16:1) and oleic acid (C18:1c) were found to be dominant in MUFA, accounting for 19.22%–26.11% and 46.32%–57.41% of total MUFA of lipids, respectively. Similarly, several researchers reported that palmitic acid (C16:0) is a dominant SFA and palmitoleic acid (C16:1) and oleic acid (C18:1c) are major MUFA [7,22]. While the most represented PUFA were linolelaidate (C18:2t), linoleate (C18:2c), and 4,7,10,13,16,19-docosahexaenoate, DHA (C22:6), accounting for 0.96%–34.22%, 0.84%–30.75%, and 26.72%–72.32% of total PUFA of lipids, respectively.
Classification of marine fish oil
PCA using variables of FA composition was performed to differentiate fish oils from Epinephelus sp. and Lutjanus sp. Figure 3 indicates the score plot between two fish oils of Epinephelus sp. and Lutjanus sp. with principal component 1 (PC1) of 50.1% and PC2 of 19.8%. The samples were almost overlapped each other showing a high similarity of their variables (FA composition) between the two groups observed through PCA. The reduction of original variables into several PCs was done in PCA to reduce the variables to be more effective for sample differentiation [23]. However, because PCA is an unsupervised technique that is usually used for initial sample grouping, it is required to apply supervised pattern recognition techniques such as PLS-DA to obtain better discrimination between two groups of fish oil samples. Supervised pattern recognition techniques such as PLS-DA are often used to evaluate the PCA result due to their capability for better classification between samples. Figure 4A shows that Epinephelus sp. fish oil could be better discriminated from Lutjanus sp. fish oil using PLS-DA compared to the PCA result using FA composition as the variables with PC1 of 31.8% and PC2 of 30.5%. It indicated that the latent variables used in creating the PLS-DA model could maximize the variation to obtain better discrimination between two fish oils. Epinephelus sp. fish oil samples from different locations appeared in a tight cluster compared to Lutjanus sp. fish oil samples. It showed more variability of FA compositions within Lutjanus sp. fish oils. Using PLS-DA, only several samples of Lutjanus sp. fish oils overlapped with samples from Epinephelus sp. fish oils, indicating the good performance of PLS-DA to discriminate between group samples. Through variable importance in projection (VIP) analysis in the PLS-DA model, variables of FAs that have a high contribution in discriminating fish oils from Epinephelus sp. and Lutjanus sp. could be identified as shown in Figure 4B. The FAs of tricosanoate (C23:0), trans-9-elaidate (C18:1t), linolelaidate (C18:2t), cis-11,14,17-eicosatrienoate (C20:3c), palmitate (C16:0), stearate (C18:0), cis-9-oleate (C18:1c), and myristate (C14:0) had important roles in discriminating Epinephelus sp. fish oils and Lutjanus sp. fish oils because they had VIP value larger than 1.0 [24,25]. FAs of tricosanoate (C23:0), linolelaidate (C18:2t), palmitate (C16:0), and stearate (C18:0), were significantly high in Epinephelus sp. fish oils whereas FAs of trans-9-elaidate (C18:1t), cis-11,14,17-eicosatrienoate (C20:3c), cis-9-oleate (C18:1c), and myristate (C14:0) were found to be in high levels in Lujtanus sp. fish oils.
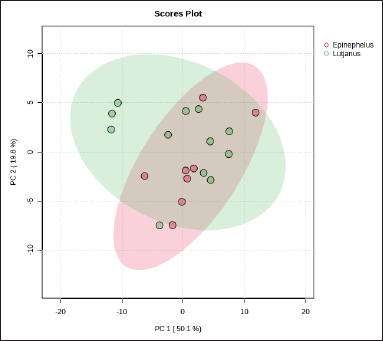 | Figure 3. Score plot of PCA. [Click here to view] |
The extension of PLS-DA analysis such as sPLS-DA and OPLS-DA was tried to classify Epinephelus sp. fish oils and Lutjanus sp. fish oils. Both sPLS-DA (Fig. 5A) and OPLS-DA (Fig. 5B) demonstrated better results for discriminating Epinephelus sp. fish oils and Lutjanus sp. fish oils. Better cluster separation were observed both in sPLS-DA and OPLS-DA between two groups of fish oils indicating better discrimination between the two groups. In sPLS-DA, the step of variable selection and classification was performed in one step simultaneously, meanwhile in OPLS-DA the variables were subjected to an orthogonal process. As a consequence, they often resulted in clearer discrimination and classification [26]. The variables which significantly contributed to sample discrimination in sPLS-DA were investigated through the first loading of sPLS-DA (Fig. 5C). The FAs of trans-9-elaidate (C18:1t), cis-11,14,17-eicosatrienoate (C20:3c), cis-11-eicosenoate (C20:1c), pentadecanoate (C15:0), and myristate (C14:0) were found to be high in Lutjanus sp. fish oils. Meanwhile, FAs of linolelaidate (C18:2t), tricosanoate (C23:0), heptadecanoate (C17:0), stearate (C18:0), and lignocerate (C24:0) were high in Epinephelus sp. fish oils.
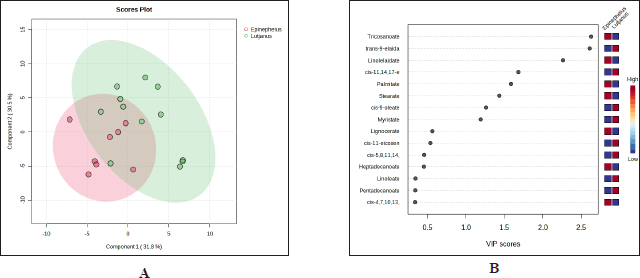 | Figure 4. Score plot of (A) PLSDA and (B) analysis of VIPs value. [Click here to view] |
 | Figure 5. Score plot of (A) sPLSDA, (B) score plot of OPLS-DA, and (C) identification of important variables in sPLS-DA through loadings 1. [Click here to view] |
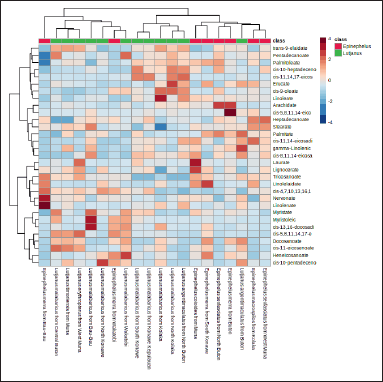 | Figure 6. Heatmap analysis. [Click here to view] |
Heatmap analysis (Fig. 6) for fish oil samples using all variables used could be used to observe the distribution of FAs in all fish oil samples extracted from various Epinephelus sp. and Lutjanus sp. A high amount of nervonate (C24:1c) and linolenate (C18:3c) was found only in Epinephelus merra from Bau-Bau. cis-5,8,11,14-eicosatetraenoate (C20:4c) was extremely high in E. merra from Buton. Meanwhile, laurate (C12:0), myristoleic (C14:1c), and linoleate (C18:2c) were significantly high only in Epinephelus coioides from Muna, Lutjanus malabaricus from Bau-Bau, and L. malabaricus from Kolaka, respectively. Heatmap analysis is very useful to identify the distribution pattern of compounds in certain samples which also could be used to monitor selected compounds that become targets for such authentication and quality control purposes.
CONCLUSION
GC-FID combined with supervised pattern recognition namely sPLS-DA and OPLS-DA offered a simple and convenient tool for quantification and discrimination of Epinephelus sp. and Lutjanus sp. The proportion of SFAs including tricosanoate, heptadecanoate, and stearate was greater in Epinephelus sp., meanwhile Lutjanus sp. showed the highest content of unsaturated FAs such as trans-9-elaidate, cis-11, 14, 17-eicosatrienoate, and cis-11-eicosanoate. Thus, it is used the main differences between Epinephelus sp. and Lutjanus sp.
ACKNOWLEDGMENT
The authors thank Kemendikbudristekdikti for financial support during this study through Hibah Penelitian Dasar Unggulan Perguruan Tinggi 2023 with contract number 41/UN29.20/PG/2023.
AUTHOR CONTRIBUTIONS
Irnawati concepted and designed research, prepared the manuscript, and made critical thinking on the manuscript, Anjar Windarsih prepared the manuscript and made critical thinking on the manuscript, Wa Ode Fasrida performed research activities, data acquisition, La Ode Muhamad Hazairin Nadia performed the statistical analysis and data interpretation, Abdul Rohman critically analyzed the manuscript. All authors read and agree on the published version of the manuscript.
CONFLICTS OF INTEREST
The authors stated there is no conflicts of interest.
ETHICAL APPROVALS
In this study, the fish samples were obtained from local fishermen (caught within 0-24 hours), the fishes were not alive, thus, ethical approval is not required.
DATA AVAILABILITY
All data generated and analyzed are included in this research article.
PUBLISHER’S NOTE
This journal remains neutral with regard to jurisdictional claims in published institutional affiliation.
REFERENCES
1. Liu J, Abdelmagid SA, Pinelli CJ, Monk JM, Liddle DM, Hillyer LM, et al. Marine fish oil is more potent than plant-based n-3 polyunsaturated fatty acids in the prevention of mammary tumors. J Nutr Biochem. 2018;55:41–52. CrossRef
2. Adkins Y, Kelley DS. Mechanisms underlying the cardioprotective effects of omega-3 polyunsaturated fatty acids. J Nutr Biochem. 2010;21:781–92. CrossRef
3. Mone P, Varzideh F, Kansakar U, Infante C, Lombardi A, de Donato A, et al. Omega-3 fatty acids coordinate glucose and lipid metabolism in diabetic patients. Lipids Health Dis. 2022;21:1–4. CrossRef
4. Liu H, Wang F, Liu X, Xie Y, Xia H, Wang S, et al. Effects of marine-derived and plant-derived omega-3 polyunsaturated fatty acids on erythrocyte fatty acid composition in type 2 diabetic patients. Lipids Health Dis. 2022;21:1–14. CrossRef
5. Sigaux J, Mathieu S, Nguyen Y, Sanchez P, Letarouilly JG, Soubrier M, et al. Impact of type and dose of oral polyunsaturated fatty acid supplementation on disease activity in inflammatory rheumatic diseases: a systematic literature review and meta-analysis. Arthritis Res Ther. 2022;24:100. CrossRef
6. Rincón-Cervera MÁ, Villarreal-Rubio MB, Valenzuela R, Valenzuela A. Comparison of fatty acid profiles of dried and raw by-products from cultured and wild fishes. Euro J Lipid Sci Technol. 2017;119:1600516. CrossRef
7. Özogul Y, Özogul F, Çiçek E, Polat A, Kuley E. Fat content and fatty acid compositions of 34 marine water fish species from the Mediterranean sea. Int J Food Sci Nutr. 2009;60:464–75. CrossRef
8. Abd Aziz N, Azlan A, Ismail A, Mohd Alinafiah S, Razman MR. Quantitative determination of fatty acids in marine fish and shellfish from warm water of straits of Malacca for nutraceutical purposes. Biomed Res Int. 2013;2013:284329. CrossRef
9. Vongsvivut J, Miller MR, McNaughton D, Heraud P, Barrow CJ. Rapid discrimination and determination of polyunsaturated fatty acid composition in marine oils by FTIR spectroscopy and multivariate data analysis. Food Bioproc Tech. 2014;7:2410–22. CrossRef
10. Yi T, Li SM, Fan JY, Fan LL, Zhang ZF, Luo P, et al. Comparative analysis of EPA and DHA in fish oil nutritional capsules by GC-MS. Lipids Health Dis. 2014;13:1–6. CrossRef
11. Killeen DP, Card A, Gordon KC, Perry NB. First use of handheld raman spectroscopy to analyze omega-3 fatty acids in intact fish oil capsules. Appl Spectrosc. 2020;74:365–71. CrossRef
12. Bekhit MY, Grung B, Mjøs SA. Determination of omega-3 fatty acids in fish oil supplements using vibrational spectroscopy and chemometric methods. Appl Spectrosc. 2014;68:1190–200. CrossRef
13. Karunathilaka SR, Mossoba MM, Chung JK, Haile EA, Srigley CT. Rapid prediction of fatty acid content in marine oil omega-3 dietary supplements using a portable Fourier transform infrared (FTIR) device & partial least-squares regression (PLSR) analysis. J Agric Food Chem. 2017;65:224–233. CrossRef
14. Killeen DP, Marshall SN, Burgess EJ, Gordon KC, Perry NB. Raman spectroscopy of fish oil capsules: polyunsaturated fatty acid quantitation plus detection of ethyl esters and oxidation. J Agric Food Chem. 2017;65:3551–8. CrossRef
15. Lopes TIB, Pereira ES, Freitas DdS, Oliveira SL, Alcantara GB. Spectral profiles of commercial omega-3 supplements: an exploratory analysis by ATR-FTIR and 1H NMR. J Food Sci Technol. 2020;57:1251–7. CrossRef
16. Viswanathan S, Verma PRP, Ganesan M, Manivannan J. A novel liquid chromatography/tandem mass spectrometry (LC–MS/MS) based bioanalytical method for quantification of ethyl esters of eicosapentaenoic acid (EPA) and docosahexaenoic acid (DHA) and its application in pharmacokinetic study. J Pharm Biomed Anal. 2017;141:250–61. CrossRef
17. Alinafiah SM, Azlan A, Ismail A, Rashid NKMA. Method development and validation for omega-3 fatty acids (DHA and EPA) in fish using gas chromatography with flame ionization detection (GC-FID). Molecules. 2021;26:6592. CrossRef
18. Xiao M, Qian K, Wang Y, Bao F. GC-MS metabolomics reveals metabolic differences of the farmed Mandarin fish Siniperca chuatsi in recirculating ponds aquaculture system and pond. Sci Rep. 2020;10:1–8. CrossRef
19. Pollo BJ, Teixeira CA, Belinato JR, Furlan MF, de Matos Cunha IC, Vaz CR, et al. Chemometrics, comprehensive two-dimensional gas chromatography and “omics” sciences: basic tools and recent applications. TrAC Trends Anal Chem. 2021;134:116111. CrossRef
20. Quero-Jiménez PC, Felipe LAA, Prieto García JO, Rodríguez MEJ, De La Torre López JB, Montenegro ON, et al. Local Cuban bentonite clay as potential low-cost adsorbent for shark liver oil pool purification. J Pharm Pharmacogn Res. 2021;9:525–36. CrossRef
21. Irnawati I, Riyanto S, Martono S, Windarsih A, Rohman A. Physicochemical properties and antioxidant activities of pumpkin seed oil as affected by different origins and extraction methods. J Appl Pharm Sci. 2022;12:115–22. CrossRef
22. Durmus, M. Fish oil for human health: omega-3 fatty acid profiles of marine seafood species. Food Sci Technol. 2019;39:454–61. CrossRef
23. Paul A, De P, Harrington B. Chemometric applications in metabolomic studies using chromatography-mass spectrometry. TrAC Trends Anal Chem. 2021;135:116165. CrossRef
24. Mabuchi R, Ishimaru A, Tanaka M, Kawaguchi O, Tanimoto S. Metabolic profiling of fish meat by GC-MS analysis, and correlations with taste attributes obtained using an electronic tongue. Metabolites. 2019;9:1–11. CrossRef
25. Jahani R, Yazdanpanah H, van Ruth SM, Kobarfard F, Alewijn M, Mahboubi A, et al. Novel application of near-infrared spectroscopy and chemometrics approach for detection of lime juice adulteration. Iran J Pharm Res. 2020;19:34.
26. Jiménez-Carvelo AM, Martín-Torres S, Ortega-Gavilán F, Camacho J. PLS-DA vs sparse PLS-DA in food traceability. A case study: authentication of avocado samples. Talanta. 2021;224:121904. CrossRef