
INTRODUCTION
Proteases are an important class of enzymes, also known as peptidyl–peptide hydrolyses (EC 3.4), which have particular significance in physiological and cellular processes in microorganisms [1]. Nearly 75% of the industrial enzyme market consists of hydrolytic enzymes such as proteases, amylases, and lipases [2]. Proteases are grouped into two categories: exo-proteases and endo-proteases. Exo-proteases act at the ends of the polypeptide chain, whereas endo-proteases act on the internal bonds of the polypeptide chain [3]. Proteases are generally obtained from microorganisms, plants, and even animals. However, microorganisms from different habitats are the most widely and abundantly used protease sources. Microbial sources proliferate in specific environments and can be genetically altered for the production of novel enzymes [4]. Recently, proteases from halophilic microorganisms have gained significant importance due to their stability at high salt concentrations, temperatures, and pH conditions. These enzymes resist denaturation and demonstrate catalytic ability in aqueous and nonaqueous conditions [5]. Extremophiles that occur in extreme ecosystems can remain active in extreme physicochemical conditions and are considered to be significant and reliable sources of many extremozymes [6].
A conventional one factor at a time (OFAT) method of process optimization by changing OFAT while keeping others at a constant level is routinely used for the optimization of media and process variables to achieve optimum cell density and a higher amount of product formation. However, this approach is laborious, time-consuming, costly, and unable to detect interactions and optimal conditions in a multivariable bioprocess system [7]. Also, there is indeed no single universal medium for alkaline protease production because each microbial strain has its own optimum growth and production conditions for maximum enzyme production [8]. Due to all these limitations, statistical experimental designs have been recognized as ideal ways for bioprocess optimization studies [9].
Optimization studies for media components help increase product yield [10]. Statistical optimization is rapid and reliable in finalizing different concentrations leading to a lesser number of total experiments compared to traditional approaches. Plackett–Burman (PB) design (PBD) is a factorial design used to screen the factors initially. This design is a preliminary study whose primary objective is to find the significant factors/parameters for further optimization. This two-level fractional factorial design uses (n + 1) test blends to estimate the main effects of “n” factors provided the interaction effects are negligible [11]. Response surface methodology (RSM) is a statistical approach that models and analyses screened parameters using mathematical equations based on fit empirical models to the obtained data using relevant experimental trials. RSM has eliminated the setbacks of the classical method and full fractional design and is widely used to optimize response obtained from PB design. One of the significant advantages of this design is that the interaction effects are also considered during the study. Central composite design (CCD) is a second-order statistical tool used to find out the yield of significant factors using a small number of experimental runs. Studying the interaction between the variables and the efficiency with the minimum number of runs makes CCD one of the unique and widely used models in optimization studies. There are four major stages involved in CCD: (1) execution of designed experimental runs; (2) accurate prediction of a mathematical model based on the data obtained and focus on statistics obtained from variance analysis [analysis of variance (ANOVA)]; (3) efficiency of the model using diagnostic plots; and (4) estimation of response using the mathematical model.
The biosynthesis of enzymes from microbial sources is affected by physicochemical parameters such as source of carbon, source of nitrogen, and process parameters [1,12]. Industries that process fishery generate huge amounts of by-products. Disposing of this waste is challenging as it poses many ecological and health problems. However, these cheap fish by-products will be excellent nutrient sources for cultivating microorganisms. As reported in previous studies, fish waste (heads, viscera, chitinous material, and wastewater) was used for the production of various microbial enzymes such as chitinolytic enzymes, ligninolytic enzymes, lipases, and proteases [13]. Diverse value-added products could be obtained from this fish waste, including glue. Fish glue is a natural by-product obtained by cooking fish skin and then performing evaporation [14]. Collagen is the main component of fish glue. Fish glue contains approximately 22%–28% protein and the least carbohydrate. Soybean flour has a huge potential to augment foods to provide satisfactory nutrients for individuals not fulfilling their daily needs. Soybean flour contains approximately 37%–41% protein content and 26%–29% carbohydrates [15]. The concentration and purification of enzymes increase their precise activities, improving their properties for various applications [16]. Precipitation and chromatographic methods are important procedures for enzyme purification [17].
A unique application of protease is its usage in mammalian cell culture [18]. Rous and Jones [19] for the first time reported the use of trypsin for cell removal from blood clots. This method recommended using proteases for preparing isolated cells for primary cell culture. Since then, trypsin has continued a famous agent for dissociating cells from tissues and dislodging cells from monolayer cell lines for routine passaging. Trypsin has limitations in working with broad pH ranges; in this regard, enzymes such as collagenase, pronase, dispase, and TrypLETM (a recombinant fungal trypsin-like protease) are the enzymes from microbial sources that are used as alternatives to trypsin [20]. In this study, we reported the optimization of media components using the halophilic isolate Salinicola tamaricis BGN2 by PB design and RSM. Here, fish glue and soybean flour were used as economical sources of nutrients. The enzyme was subjected to purification by acetone precipitation and gel-filtration chromatographic methods. Furthermore, the purified protease was used in cell culture application, one of the less reported applications for protease from halophilic microorganisms.
MATERIALS AND METHODS
Isolation and molecular characterization of S. tamaricis BGN2 by 16S rDNA sequencing and phylogenetic analysis
Sea sediment and water samples were composed from the seashore of Honnavar and Kumata towns of Uttara Kannada District of Karnataka State, India. Different bacterial isolates were obtained from seawater and sediment samples. 10 ml of water sample/10 g of sediment samples were mixed with 90 ml of saline solution separately. The sample was serially diluted from a 10−1 to 10−7 ratio with normal saline, and 0.1 ml of each diluted sample was inoculated on modified Horikoshi–I alkaline medium containing (% w/v): Glucose 1%; peptone 0.5%; casein 0.75%; yeast extract 0.2%; KH2PO4 0.3%; Na2CO3 0.5%; and NaCl 5.0%. The plates were incubated at 37°C for 72 hours. Pure cultures of the isolates were grown at 37°C for 72 hours onto the skim milk agar containing (%w/v) skim milk 2%; NaCl 5%; glucose 1%; yeast extract 0.5%; and agar 1.8% for the screening of proteolytic activity. The clear zone of casein hydrolysis around the colony confirmed the protease production. The isolates BGN1, BGN2, BGN3 (halophiles), and BGN4 (halotolerant) showed a zone of hydrolysis on the skim milk agar plate indicating protease production.
Organism able to produce higher enzyme was selected and identified based on morphological, and biochemical characteristics and 16S rRNA gene sequence [21]. Genomic DNA from the bacterial strain was isolated and purified using a spin column kit (HiMedia, India). Forward primer: 16F 27 (5′-AGAGTTTGATCCTGGCTCAG-3′), and reverse primer: 16R 1525 (5′-AAGGAGGTGATCCAGCCGCA-3′) were used for gene amplification. The amplification process was performed using polymerase chain reaction (PCR) in a reaction volume of 50 μl. The PCR reaction mixture contains 2 × 25 μl GoTaq® Green Master Mix, 1 μl forward primer, 1 μl reverse primer (10 μM each), 5 μl DNA template (100 ng), and 18 μl nuclease-free water. The polymerization reaction was carried out for 30 cycles with the following amplification conditions: Early denaturation at 95°C for 5 minutes, cycle denaturation at 95°C for 1 minute, annealing at 52°C for 1 minute, and DNA synthesis extension at 72°C for 1.5 minutes. The final amplification was performed by final extension for 10 minutes at 72°C [6]. Purified PCR products were then nucleotide sequenced by Sanger’s di-deoxy method ABI 3500 × l genetic analyzer. Furthermore, the ribosomal DNA sequences (.abl files) were filtered using CHROMASLITE (version 1.5) and later computed with the Basic Local Alignment Search Tool. Ribosomal sequences with maximum similarities were obtained from the NCBI database, which finds specific regions with local similarities between different sequences. Multiple alignment sequences and phylogenetic analysis are adopted for precise and accurate species identification and evolutionary relationships. Ribosomal DNA sequences of the cultures were deposited into the NCBI database and the accession numbers were obtained.
Protease production by submerged fermentation
Protease production was done using the production media containing (%w/v) glucose 1; peptone 0.5; casein 0.75; yeast extract 0.2; KH2PO4 0.3; NaCl 5; Na2CO3 0.5; and pH 9.2–9.4 while shaking at 120 rpm. Old cultures were grown in a 250 ml flask containing 100 ml modified halo bacterium medium. The cultures were grown at 37°C on a rotary shaker at 120 rpm for 24 hours, which were used as inoculum for protease production. 2% of the inoculum was taken and inoculated from the grown cultures into a fresh 100 ml production medium. The flasks were incubated for 96 hours at 37°C in a rotary shaker at 120 rpm. At the end of incubation, the culture medium was centrifuged at 8,000 rpm for 10 minutes, and the supernatant obtained was further used as the crude enzyme [6].
Determination of protease activity
Protease enzyme activity was evaluated using casein as a substrate. A 0.5 ml aliquot of the culture supernatant (crude enzyme) was added with 3 ml of 200 mM glycine-NaOH buffer (pH 10) containing 1% (w/v) casein and kept for 10 minutes at 50°C. The reaction process was stopped by adding 3.2 ml of trichloroacetic acid (20% w/v). The mixture was allowed to stand at room temperature for 30 minutes to remove the precipitate. A blank was prepared similarly, except 0.5 ml of buffer was added instead of crude enzyme. The absorbance of the sample was measured at 280 nm using a UV-Vis spectrophotometer. A tyrosine standard curve was plotted using 0–100 μg/ml tyrosine standards. One unit of protease activity was defined as the total enzyme required to liberate 1 μg of tyrosine per minute under standard conditions [22].
(1)
Profiling studies for growth and protease production
Effect of incubation period on growth and protease production
To assess the optimum bacterial growth and protease production kinetics by S. tamaricis BGN2, the culture was inoculated and grown in defined production media for 24, 48, 72, 96, 120, 144, and 168 hours at pH 10 and 35°C at 120 rpm. After each incubation interval, the samples were centrifuged at 8,000 rpm at 4°C in a centrifuge. The cell pellets obtained were further washed using Tris buffer (pH 8) and suspended again in 1 ml of buffer. The growth of the bacterial culture was measured by taking absorbance of the sample at 660 nm. Furthermore, the supernatant was subjected to filtration (0.45 μm membrane filter) and the protease activity was calculated as described above. Experiments were performed in triplicate, and the mean results were used to calculate the growth and enzyme activity [6].
Effect of NaCl on growth and protease production
To determine the optimum concentration of NaCl for optimum growth and protease production by S. tamaricis BGN2 was grown in a protease production medium added with varied concentrations of NaCl (1–25%). The temperature and pH of the culture medium were adjusted to 35°C and 10.0 with 1 N NaOH and incubated for 96 hours in an orbital shaker at 120 rpm. Three sets of experiments were performed and the mean of results was used to calculate the effect of the optimal percentage of NaCl on growth and protease production [23].
Experimental design and statistical optimization for protease production
One factor at a time
Initial experiments were conducted in line with the previous literature, such as the OFAT approach to identify the range of significant factors on growth such as pH, temperature, incubation period, and sodium chloride on growth and enzyme production. Appropriate carbon and nitrogen sources for enzyme production were also screened. For this, a production medium consists of (%w/v) glucose 1; peptone 0.5; casein 0.75; yeast extract 0.2; KH2PO4 0.3; NaCl 5; Na2CO3 0.5; and pH 9.2–9.4, while shaking at 120 rpm was supplemented with 1% (w/v) fructose, sucrose, maltose, lactose, xylose, galactose, and starch, as a sole source of carbon and (0.5%, w/v) organic nitrogen sources included tryptone, yeast extract, skim milk powder, and gelatin; while inorganic nitrogen sources used were sodium nitrate, ammonium nitrate, and urea as sole nitrogen source. Growth of the organism was measured and enzyme activity was calculated after 96 hours of incubation at 45°C in an orbital shaker with 120 rpm. Experiments were performed in triplicate, and the mean results were used to calculate the effect of different carbon and nitrogen sources on growth and enzyme production [6].
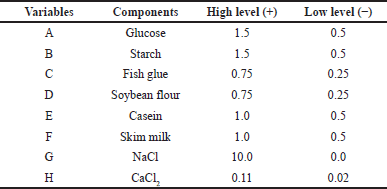
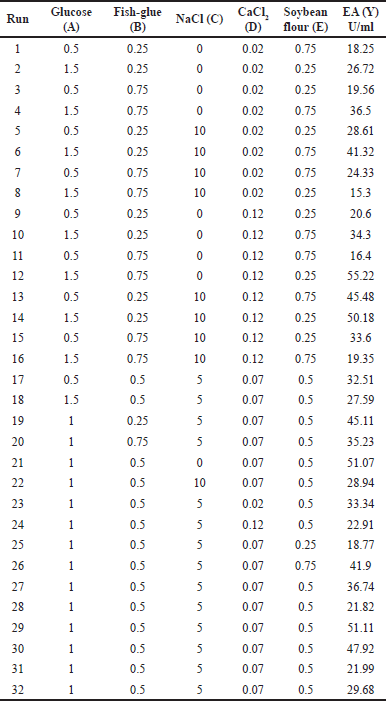
The study used two carbon sources: glucose and starch, two nitrogen sources: fish glue and soybean flour, and two substrates: casein and skim milk, along with NaCl and CaCl2. Table 1 represents the coded high levels and low levels taken into consideration depending on the production media used earlier. Protease production can also be influenced by different agro-based waste materials such as wheat bran and green gram husk [24]. The by-products of the fish are extensively utilized for microbial growth media. The protein hydrolysates attained by acid or alkali treatment of defatted by-products are a nitrogen source for further enzyme production [13].
Furthermore, to appraise the optimum conditions for enhanced bacterial growth and protease production, a software-aided (MATLAB 20.0) statistical tool was used. The PBD was engaged to primarily screen variables. The screened and potentially significant variables were further optimized by RSM using CCD to determine the optimum values of individual variables.
Screening of significant variables by PBD
The PBD is an operative and reliable approach to identifying significant factors required to improve protease production. It evaluates the variables at two levels −1 for low level and +1 for high level. The first stage was PB design based on screening different media variables. The second stage was CCD to optimize the essential factors that impact enzyme production. The first stage in the optimization process is PB design, which is based on screening different variables. The second stage is CCD to optimize the essential variables impacting protease production. The PB method is a reliable approach to selecting the parameters that influence protease production. The assessments of the variables at high and low levels are given in Table 2 [25,26].
 | Table 1. Medium ingredients used for PBD. [Click here to view] |
In the existing study, a fractional factorial design was used to define whether eight variables, namely glucose, starch, fish glue, soybean flour, casein, skim milk, NaCl, and CaCl2, have any significant linear effect on extracellular protease production. Based on a two-level full factorial design, each variable is examined at two levels (−1 and +1).
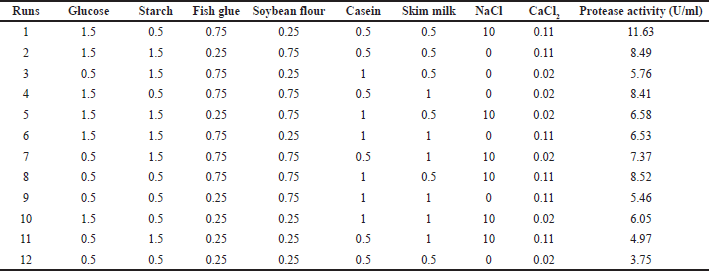
This approach tested the level (low and high) of eight factors, viz. glucose (0.5, 1.5%); starch (0.5, 1.5%); fish glue (0.25, 0.75%); soybean flour (0.25, 0.75%); casein (0.5, 1.0%); skim milk (0.5, 1.0%); NaCl (0.0, 10.0%); and CaCl2 (0.11, 0.20%). Table 3 shows twelve experimental set-ups to evaluate responses (growth and protease activity). The two responses were analyzed for regression equalities [27]. A polynomial equation was used to represent the linear correlation shown by these independent variables:
Y = βo+Σβi Xi (2)
where Y is the response (enzyme activity), βo is the model intercept, and βi is the linear coefficient for the variable Xi.
Optimization of significant variables by RSM using CCD
Based on the responses observed in the PBD experiment for protease production, the influencing variables were selected and included in CCD analysis (glucose, fish glue, NaCl, soybean flour, and CaCl2). Sixteen experiments were designed using the MINITAB, version 21, and all variable’s central values were coded as zero. The minimum and maximum ranges of the variables and the detailed experimental design layout concerning their values in the actual and coded form are presented in Table 5. The three variables, glucose (0.5%–1.5%), fish glue (0.25%–0.75%), and NaCl (0%–10%), exhibited their significant effects on protease production and were subjected to a 2n factorial CCD for optimizing the individual and interaction effects of the selected variables. The results obtained from RSM studies were analyzed for variance (ANOVA) and were fitted with the response surface regression method using the following second-order polynomial equation:
 | Table 2. PBD matrix used for screening of medium ingredients with coded values for protease activity. [Click here to view] |
 | Table 3. Statistical analysis of medium ingredients for protease production by PBD. [Click here to view] |
 | Table 4. Results of model fitting test. [Click here to view] |
Y = βo+ Σβi Xi+ Σβij XiXj+Σβii Xi2 (3)
where Y is the predicted response, βo is the offset term, βi is the linear offset, βii is the squared offset, βij is the interaction effect, and Xi is variable [28]. The statistical analysis of the results was done using Minitab 21.
Protease production yield was documented as a response. The response data were processed and analyzed by the Minitab software, and the 2-D and 3-D response contour plots were generated to estimate the interaction among significant variables. The legitimacy of the chosen quadratic model predicted by the Minitab tool was established with experimentation.
Purification of protease
Partial purification by ammonium sulfate and acetone precipitation
Salinicola tamaricis BGN2 was grown in the optimized medium; the cell (fermented) broth was centrifuged (6,000 rpm, 15 minutes, 4°C). The cell-free culture supernatant was sequentially precipitated with an increasing ammonium sulfate concentration. Solid ammonium sulfate was added to cell-free 500 ml of the fermented broth (70% saturation) with acetone (70%). The sample was subjected to a centrifugation process and precipitation was collected. The concentrated protein precipitate was collected by centrifugation at 10,000 rpm for 15 minutes at 4°C. Later, the protein precipitate was dissolved in 5 ml glycine-NaOH buffer (pH 10.0) and dialyzed for 12–14 hours using glycine-NaOH buffer (pH 10.0). The dialyzed protein samples were further fractionated and purified by using Sephadex-G-75 (Sigma, USA) and diethylaminoethyl cellulose (DEAE-cellulose) (Hi-Media, Mumbai, India) as reported earlier [29]. All purification steps were performed at 4°C.
 | Table 5. Central composite design. [Click here to view] |
Purification by ion exchange and gel filtration chromatography
Next, the partially purified enzyme was subjected to further purification by DEAE-cellulose column chromatography with a column height of 15 cm and a diameter of 2.5 cm. The column was eluted with the salt solutions of a different concentration gradient of 0.1–1.0 M NaCl, and the purified protein fractions of 5 ml were collected at the flow rate of 0.5 ml per minute. All fractions were monitored for protein content by calculating absorbance at 280 nm [30]. The total protein content was calculated by the Lowry method with bovine serum albumin as the reference material [31].
The gel chromatography matrix (Sephadex G-75) was soaked in sterile distilled water for 10–12 hours. The swollen gel matrix beads were removed from the gel slurry and filled into a glass column (100 × 2.5 cm) and with sintered filter was placed at the bottom. Care was taken to make the column free from air bubbles while preparing the gel pack into the column. The packed gel matrix column was saturated and equilibrated with 50 mM Tris-HCl buffer of pH 10.0. The dialyzed and ion exchange column purified protein preparation was loaded onto the Sephadex G-75 column and eluted with 50 mM Tris-HCl buffer of pH 10.0 at a flow rate of 3.0 ml per 5 minutes. The partially purified enzyme from the earlier step was then subjected to gel filtration chromatography on a Sephadex G-75 column (100 × 2.5 cm) equilibrated with 50 mM Tris-HCl buffer of pH 10.0 containing 0.5% Triton X-100. Sample fractions (5 ml) were collected using 50 mM Tris-HCl buffer of pH 10 with a flow rate of 12 ml/hour. Furthermore, the fractions were analyzed for enzyme (protease) activity. The fraction (11–20) showing protease activities were pooled and further analyzed for total protein content and enzyme activity. As explained above, the eluted samples’ protein concentration and protease activity were determined. Active protease fractions were pooled together and concentrated by lyophilization for enzyme characterization studies [4].
Molecular weight determination by Sodium dodecyl sulfate–polyacrylamide gel electrophoresis (SDS-PAGE) and Casein zymography
The SDS-PAGE (denaturing) was performed (12%) to assess the molecular masses of the protease. The protein markers have a broad range from 10 to 250 kDa. The purified enzyme preparations were mixed in the ratio of 1:5 (v/v) using double distilled water containing 10 mM Tris-HCl (pH 8.0), 2.5% SDS, 5% β-mercaptoethanol, and 0.002% bromophenol blue. The temperature of the samples was increased to 100°C for 5 minutes and loaded. Following electrophoresis, the gel was stained with Coomassie brilliant blue, and the gel image was documented [26].
For zymography studies toward protease activity, the samples obtained from purification by the gel chromatography step were loaded onto the polyacrylamide gel without denaturation of the protein samples. The gel was removed from electrophoresis and put into 0.05 M Tris-HCl buffer (pH 10.0) containing 2.5% Triton X-100 for 30 minutes, the preparation is constantly stirred for the removal of SDS. The gel extracted with Triton X-100 was then incubated with 0.1% (w/v) casein in 0.05 M Tris-HCl buffer at pH 10.0 for 20 minutes at 50°C. The gel was then stained with Coomassie Brilliant Blue R-250. The development of clear zones in the blue background of the gel indicated the confirmation of protease activity and its molecular weight [32].
Application of protease in dissociation of MCF7 monolayer cell line
The MCF7 cancer cell line was used to evaluate the dislodging ability of protease enzyme compared to routine trypsin as described by earlier studies [25] in cell culture. In the present study, the volume of protease enzyme and incubation period was considered a parameter, and the same analyses were performed by taking trypsin for comparison. For experimentation, the cell was maintained on high-glucose Dulbecco’s modified Eagle’s medium augmented with 10% fetal calf serum (FCS). Experiments were conducted in 6-well cell-culture plates with uniform cell density in all wells. After 24 hours of incubation, cells were observed for the desired confluence of ≥80%. Further removing the growth medium, cells were washed with 2 ml 1× phosphate-buffered saline (PBS). The PBS was removed, and 1× PBS containing protease and parallelly 0.5 ml trypsin ethylenediaminetetraacetic acid (EDTA) solution was added and incubated at 37°C in a CO2 chamber. The cells were then added with fresh complete media containing FCS and flushed out into clean tubes. Further cell suspensions were centrifuged at 2,000 g for 5 minutes and re-suspended in 2 ml fresh growth medium. Cell counting was done using a hemocytometer to assess protease’s dislodging capacity compared to trypsin enzyme. Cell detachment was observed with a microscope using PBS alone for control experiments.
RESULTS AND DISCUSSION
Isolation and molecular characterization of S. tamaricis BGN2 by 16S rRNA gene sequencing and phylogenetic analysis
The spread plate technique was used to obtain protease-producing bacteria from the sea sediment and water samples using a modified halobacterium medium. The medium composition (%w/v): NaCl-5.0 g, MgSO4-1.0 g, KCl-0.5 g, Tryptone-0.25 g, Yeast extract-1.0 g, and CaCl2.2H2O-0.02 g (pH 8.0). After incubation, morphologically distinct pure colonies were streaked on skim milk agar plates for screening protease production. The screening process resulted in isolating protease-producing bacterial isolates showing clear zones around their colonies. The isolates reported to produce protease were further grown in a production medium and an enzyme assay was performed. Among all the isolates BGN2 strain showing the highest protease enzyme activity (12.4 U/ml) was chosen for further study. Based on the phenotypic and biochemical characterization referring to Bergey’s Manual of Systematic Bacteriology, the strain was identified as Salinicola sp. [33].
The organism was then characterized by 16S rRNA gene analysis for a nucleotide length of 1,487 bp. The 16 rRNA gene sequence of the isolated halophilic bacteria exhibited (1487/1487) 100% similarity with S. tamaricis strain F01 and 97% (1449/1487) similarity with other species of Salinicola genera such as Salinicola salarius strain M27, Salinicola peritrichatus strain DY22, and Salinicola socius strain SMB35, and showed closest homology with Salinicola sp. The phylogenetic tree (Fig. 1), based on 16S rRNA gene sequences homology, showed that strain BGN2 was most closely related to S. tamaricis [34]. Similarly, the the16S rRNA gene sequence shows ≥72% similarity with many Chromohalobacter spp. and Halomonas spp. The rRNA gene sequence was deposited in the NCBI GenBank 16S rRNA database with accession number OR485958, and the isolate was named S. tamaricis strain BGN2 as it matches 100% similarity with S. tamaricis strain F01.
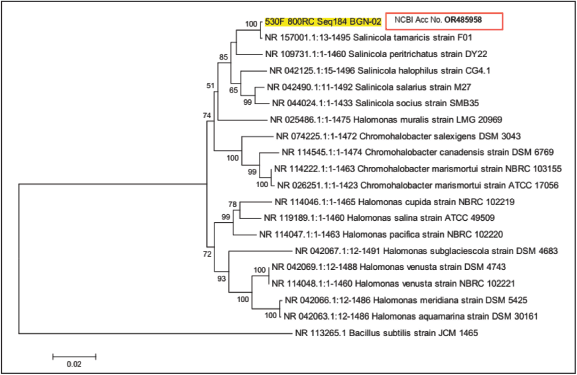 | Figure 1. Phylogenetic analysis of S. tamaricis BGN2. [Click here to view] |
Growth kinetics and protease production
Effect of incubation period on growth and protease production
The protease production by isolates of S. tamaricis BGN2 was studied during 168 hours (7 days) of cultivation under the optimized medium and physicochemical conditions. As shown in Figure 2, after 36 hours of lag phase, the growth was exponential till 96 hours followed by the stationary phase. At 96 hours, maximum growth and enzyme activity at 96 hours (11 U/ml) were observed and this was retained till 120 hours in the stationary phase. After 120 hours, both cell biomass and protease activity decreased exponentially. The induction protease enzyme production after 72 hours indicates the inducing and sole carbon source role for casein at the later log phase (Fig. 2). The incubation period is one of the initial and significant parameters that influence the enzyme production ability significantly in bacteria; it generally varies from 36 to 120 hours depending upon the bacteria and the role of the enzyme in the cell’s metabolism. The protease enzyme secretion pattern is similar to haloalkaliphilic Bacillus sp. Po2 and alkaliphilic Bacillus sp. B001 [6], where maximal protease production was detected at the stationary phase. The protease section by B. pumilus MCAS8 was found to be at a late stationary phase (48 hours) [33]. The production of protease enzymes from the late logarithmic phase to the stationary phase indicates the important role of extracellular proteolytic enzymes in the metabolism and ecological sustainment of organisms.
Effect of NaCl on growth and protease production
The results are presented in Figure 3 which shows the influence of NaCl concentration on bacterial cell growth and protease production by S. tamaricis BGN2. Further study revealed that organisms can grow over a wide range of NaCl concentrations from 0% to 25%. Salinicola tamaricis BGN2 grows optimally at 10%–15% of NaCl in the media, and no or very little growth was observed in the absence of sodium chloride, confirming the halophilic nature of the isolate. Between 10% and 15% of NaCl, there is maximum growth and protease production (14 U/ml) showing the physiological effect of sodium chloride on bacterial growth and enzyme production. Earlier studies on the effect of salinity on the growth of halotolerant bacteria have shown that a polar lipid composition changes at cell membranes, resulting in a decrease in growth and enzyme production [35]. Increased growth and enzyme production were observed for production media containing 0%–5% of NaCl and increased salt concentration to 7.5% resulted in both growth and protease production by a halotolerant strain Bacillus sp. NPST-AK15 [6]. Similarly, in another report, it was reported that an increase in sodium chloride (1%–9% NaCl) has led to increased protease production with a higher amount of protease production observed between 4% and 5% sodium chloride concentration for Bacillus luteus H11 [36]. These results indicate the halophilic nature of the protease enzyme where salt seems to be a prerequisite for protease production.
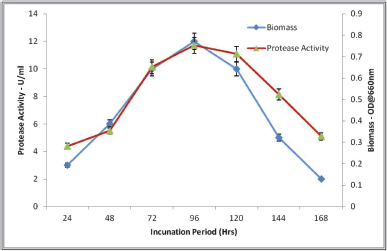 | Figure 2. Effect of incubation period on growth and protease activity. [Click here to view] |
Experimental design and statistical optimization for protease production
Effect of carbon and nitrogen sources on growth and protease production
The different carbon and nitrogen sources influencing the bacterial growth and halophilic protease production from S. tamaricis BGN2 were screened through a preliminary nonstatistical methodology (OFAT experiments). The OFAT strategy was adopted to screen the best carbon/nitrogen source among the 08 different carbon and 08 different nitrogen sources. 1% (w/v) xylose, fructose, maltose, galactose, sucrose, lactose, and starch were included in the media in place of glucose (modified Horikoshi-1). The results confirmed that all the carbon sources were able to support for the protease production. Different carbon sources have different effects on growth and protease production in different ways (Fig. 4). Glucose (13 U/ml) and starch (11 U/ml) were found to be effective in significant induction of both growth and enzyme production (Fig. 4) whereas, lactose and xylose were reported less effective for enzyme production. Glucose at lower concentrations (up to 1%) supports the increase in cell biomass and protease production in many microbial fermentation processes. At higher concentrations (more than 1%) glucose has also been shown to repress the protease production and activity by catabolite repression mechanism [16]. The protease-inducing effect of glucose and starch on protease production was similar to that observed for Bacillus sp. AR-009, Bacillus licheniformis ATCC 21415, and Bacillus cereus strain 146 [37,38]. The observed results support the previous studies, where the protease production by halotolerant Halomonas sp. PV1 starch was a better carbon source [39]. The enhanced growth and enzyme activity by both glucose and starch concludes their simpler nature and were used initially to increase the biomass and later period, casein induced the enhancement of protease activity.
Nitrogen sources in the production media are essential for the growth of halophilic/halotolerant heterotrophic microbes [40]. To check the effects of nitrogen sources on enzyme production, 0.5% (w/v) yeast extract, gelatin, skim milk powder, ammonium nitrate, sodium nitrate, urea, and tryptophan were included in the media to replace peptone from the production medium (modified Horikoshi-1). The organic nitrogen sources positively influenced bacterial growth and protease production by S. tamaricis BGN2. Protease production was maximum (13 U/ml) for skim milk powder, followed by tryptone, yeast extract, and gelatin (Fig. 5). In the present study, peptone is a nitrogen source during initial biomass production, whereas, in a later stage, the casein from skim milk powder acts as both sources of carbon and nitrogen, evidenced by the increased protease at 96 hours. Protease production was significantly inhibited by inorganic nitrogen sources, viz., sodium nitrate and ammonium nitrate. The nitrogen sources should be used in optimum concentration otherwise an excessive amount of nitrogen sources in the media can lead to feedback repression of protease production. The nitrogen sources have feedback repression on protease production if they have been added in excess or even if the free amino acids are supplemented. Compared to organic nitrogen sources, the inorganic nitrogen sources have not been able to induce protease production as observed in the earlier studies [6]. Earlier studies showed that decreased protease activity was due to an increased concentration of ammonium ions (1%) or inhibition by both sulfate and ammonium ions [38]. The induced growth and enzyme activity by both nitrogen sources, peptone and skim milk indicates the physiological synergism in inducing maximum growth and protease production.
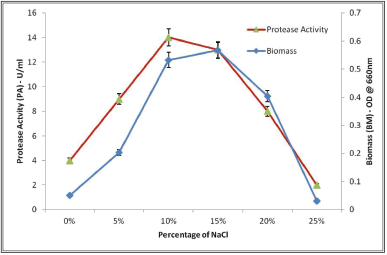 | Figure 3. Effect of percentage of sodium chloride (NaCl) on growth and protease activity. [Click here to view] |
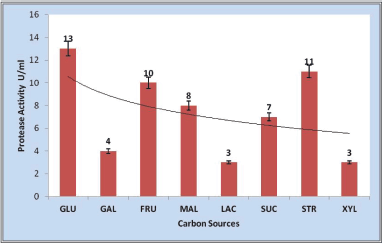 | Figure 4. Effect of carbon sources (GLU-Glucose, GAL-Galactose, FRU-Fructose, MAL-Maltose, LAC-Lactose, SUC-Sucrose, STR-Starch, and XYL-Xylose) on protease production. [Click here to view] |
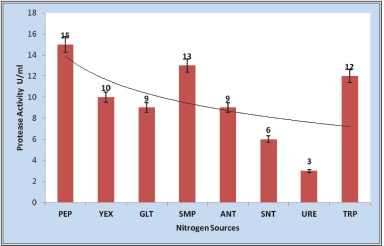 | Figure 5. Effect of nitrogen sources (PEP-Peptone, YEX-Yeast extract, GLT-Gelatin, SMP-Skim milk powder, ANT-Ammonium nitrate, SNT-Sodium nitrate, URE-Urea, and TRP-Tryptone) on protease production. [Click here to view] |
Screening of media components using PBD
The suitability of any bacterial strain producing protease for industrial applications depends on the yield of enzyme production. In microbial fermentation, metabolite production and growth are influenced by both media ingredients and process parameters. In the present study, eight media ingredients (glucose, starch, fish glue, soybean flour, casein, skim milk powder, NaCl, and CaCl2) were selected for primary selection by the PBD approach. Among eight media ingredients, glucose, starch, skim milk, and casein were taken based on OFAT studies, and fish glue and soybean flour were taken as an inducer of protease production based on a literature review [14,15]. NaCl and CaCl2 have been taken based on initial growth profiling studies and the positive effect of CaCl2 on protease production and protease activity [36,41]. All the experimental sets were incubated for 96 hours, yielding the highest enzyme. Table 1 summarizes the experimental outcomes of PB design in terms of response (protease activity).
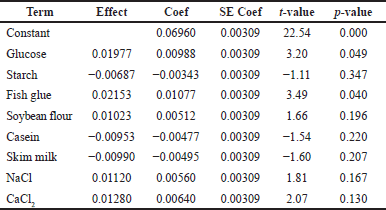
The PB designs for 12 trials with 2 concentration levels for 8 variables were carried out according to the experimental matrix in Table 2. The response was measured in terms of protease activity. The main effects of the variables on protease production were calculated and drawn as a Pareto chart (Fig. 6). The significance of each media parameter was determined using Student’s t-test. Table 3 represents the result of PB trials concerning effects, standard error (SE), t-value, and p-value (significance level) of each component which describes the results of regression analysis using the regression coefficients for protease production.
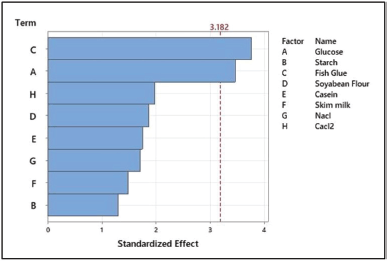 | Figure 6. Pareto chart showing the significant media components for protease activity. [Click here to view] |
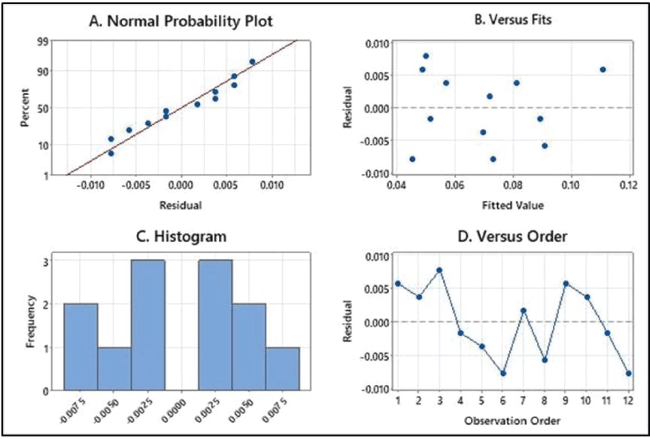 | Figure 7. Residual plots that examine the goodness-of-fit in regression. (A) Normal probability plot for residual value, (B) residual plots against fitted values, (C) histogram of residual value, and (D) residual plot against observation order. [Click here to view] |
 | Table 6. ANOVA for the quadratic model obtained as a result of CCD for the protease production by S. tamaricis BGN2. [Click here to view] |
 | Table 7. Model fitting results for CCD. [Click here to view] |
The first-order linear equation for protease production can be given as follows:
Y (Response) = 0.0390 + 0.02073 Glucose − 0.00783 Starch + 0.0450 Fish glue + 0.0224 Soybean Flour − 0.0210 Casein − 0.0179 Skim milk + 0.001023 NaCl + 0.1315 CaCl2. (4)
The medium components were screened at a confidence level of 95%. Factors having a p-value less than 0.05 are considered significant. The t-value and p-value are essential for determining the factors’ significance. Higher coefficients will be obtained at higher t-values and smaller p-values. Depending on the p-value, the confidence levels of fish glue (0.040) and glucose (0.049) were significant. Components such as starch, skim milk, and casein have a negative t-value, because of their least preference in comparison to glucose and fish glue. Salinicola tamaricis BGN2 is a halophilic bacterium requiring NaCl for good growth and enzyme production; hence, NaCl was included throughout the study. Furthermore, the other components such as soybean flour and CaCl2 were also included in the interaction studies in CCD in RSM due to their positive t-values [4].
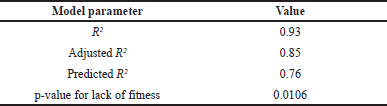
In the model, if the R value (multiple correlation coefficients) is nearer to 1 considered to be a better correlation and the R2 value (determination coefficient) indicates the model has fitted and justifies the value of 0.99 variability. The high R2 value (93%) indicated that the experimental results and predicted theoretical values by the model agreed very well [42]. The predicted and measured values are given in Table 4. According to this, the predicted R2 value is 0.76 and the adjusted R2 value is 0.85, which also supports the significance of the model. The residual plots (Fig. 7) further justify the goodness of fit in a regression model. The normality of the experimental data can be obtained from the normal probability plots of residual. The residual explains the difference between the predicted and experimental values of regression. Figure 7a shows the experimental points are aligned on the standard probability plot indicating the data is not skewed anywhere and is in compliance with the normality of the data, Figure 7b shows a plot of residuals versus fitted values. From the above results, it is evident that the residuals are randomly distributed near the zero line, indicating lesser bias in the variance. Figure 7c shows histograms with symmetrical observation supporting the normality of the plot. Finally, the residuals are randomly distributed for the observed order confirming nonbiased data (Fig. 7d). Based on the values of the regression coefficient of responses; glucose; fish glue; soybean flour; CaCl2; and NaCl; further factors were selected for the CCD of the response surface method [43].
Optimization of screened components using RSM
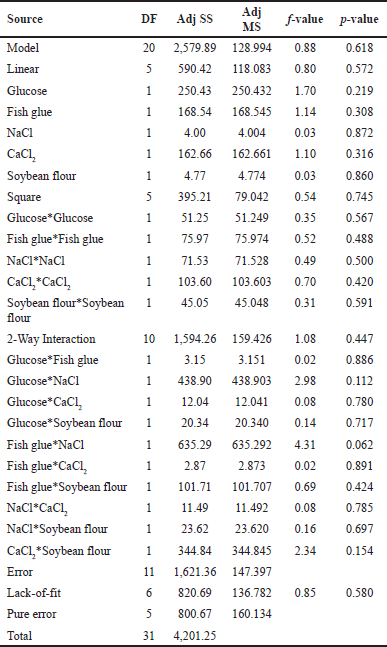
The experiments were formulated using the Minitab software (Version 20). In the CCD design, the other media components having p-value > 0.05 (in PB design) were kept at lower concentrations. Table 5 shows the selection of five significant media ingredients at three levers (−1, 0, and +1) for their interaction studies among the significant variables. The CCD design shows a total of 32 experimental trials. A quadratic model for protease production was generated. Protease production (Y), expressed in terms of glucose (A), fish glue (B), NaCl (C), CaCl2 (D), and Soybean flour (E), is presented in the second-order polynomial equation (Equation 5):
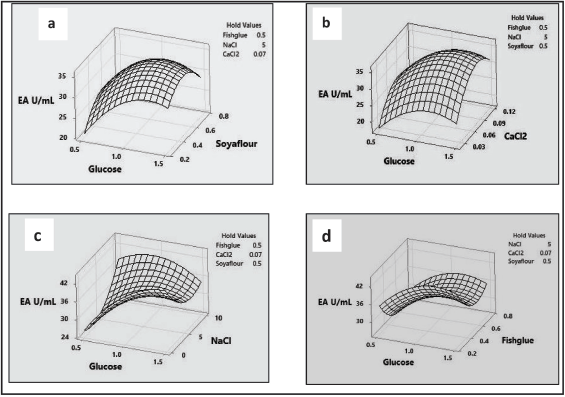 | Figure 8. Response surface plots for protease production demonstrating the interactive effects for (a) enzymatic activity as a function of glucose and soy flour, (b) enzymatic activity as a function of glucose and CaCl2, (c) enzymatic activity as a function of glucose and NaCl, and (d) enzymatic activity as a function of glucose and fish glue. [Click here to view] |
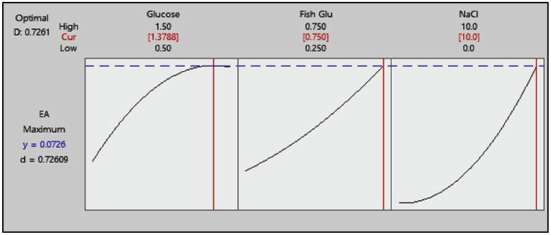 | Figure 9. Response optimizer plot. [Click here to view] |
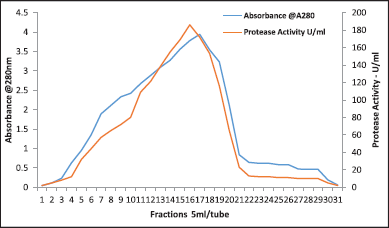 | Figure 10. Purification profile of protease by gel filtration chromatography. [Click here to view] |
Y (Protease activity) U/ml = −40.4 + 58.3 Glucose − 50 Fish-glue + 1.83 NaCl + 574 CaCl2 + 121 Soya-flour − 18.3 Glucose * Glucose + 89 Fish-glue * Fish-glue + 0.216 NaCl * NaCl − 2595 CaCl2 * CaCl2 − 68 Soya-flour * Soya-flour − 3.6 Glucose * Fish-glue − 2.09 Glucose * NaCl + 35 Glucose * CaCl2 − 9.0 Glucose * Soya-flour − 5.04 Fish-glue * NaCl − 34 Fish-glue * CaCl2 − 40.3 Fish-glue * Soya-flour + 3.4 NaCl * CaCl2 + 0.97 NaCl * Soya-flour − 371 CaCl2 * Soya-flour. (5)
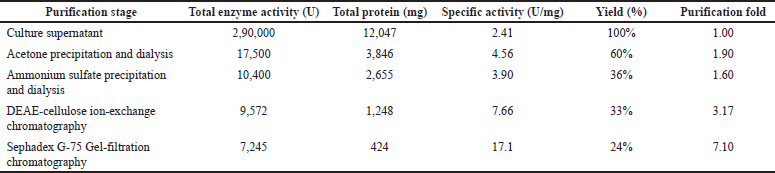 | Table 8. Acetone/ammonium sulfate precipitation and chromatographic purification of protease. [Click here to view] |
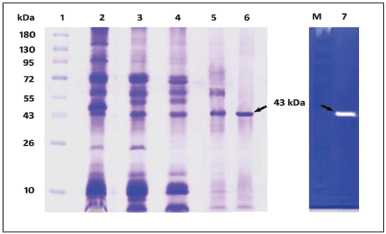 | Figure 11. SDS-PAGE and casein zymography of protease produced from S. tamaricis BGN2. Lane 1: molecular weight markers; Lane 2: crude protease from culture supernatant; Lane 3: acetone precipitation and dialysis of protease; Lane 4: ammonium sulphate precipitation and dialysis of protease; Lane 5: DEAE-cellulose ion exchange chromatography; and Lane 6: Sephadex G 75 column chromatography; Lane 7: Casein-Zymography. [Click here to view] |
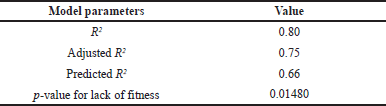
The influence of each variable was tested using ANOVA at α = 0.05 and mathematical correlation using the least square method, which is conducted by fitting the values of enzyme activity obtained at set levels of media ingredients. In the analysis, the t-value is used to determine the significance of the regression coefficients of the parameters. The p-value represents the significance of rejecting the null hypothesis. From the ANOVA test tabulated in Table 6, high t-values for both glucose and fish glue concentration show that both of these parameters have a more significant effect on protease activity when compared to other parameters. From the quadratic interactions between the selected media parameters and protease activity, the results from Table 6 show that fish glue and NaCl have the most potent quadratic effect with the highest t-value compared to other interactions. Model fitting analysis was measured to ensure the model’s dependency on the enhancement of product formation. Values of R2 and the lack-of-fit will determine the accuracy of the model. The high value of R2 (0.80) shows the model fits the experimental data well. The nonsignificant value of lack-of-fit (p > 0.05) represents that the model agrees with the experimental data (Table 7).
The interactions were recorded as the extent of enzyme activity and were analyzed allowing two factors simultaneously and keeping one factor constant. The resulting protease activity between the variables is depicted in the 3-D response surface plots, which describe the interaction between these factors [20,12]. The 3-D plot generated is a convex plot that designates the precision of some medium elements necessary for protease production. Figure 8a shows that increasing glucose and soybean flour concentration leads to increasing protease production. At constant NaCl, CaCl2, and fish glue levels, the glucose till 1% and soybean flour till 0.6% will induce increased protease production after that there is a decrease in protease activity indicating the catabolite repressive activity of both the variables. Soybean flour is rich in proteins and induces protease production at lower or optimal concentrations [44]. Figure 8b shows, that at constant NaCl, soybean flour, and fish glue levels, glucose, and CaCl2 interact positively till 1% and 0.9%, respectively, and induce the increased protease production. Like glucose, CaCl2 can also induce both protease production and protease enzyme activity by induction and affecting the stability of the enzyme. The interaction of glucose with NaCl and fish glue showed that in both cases NaCl and fish glue were able to induce protease production in optimal concentrations of 5% and 0.4%, respectively (Fig. 8c and d) [45]. In all the interactions, the glucose supported protease production to 1% but higher glucose levels negatively influence enzyme production. Similar inhibition for enzyme production was reported by many of the previous investigators [46,16]. Both fish glue and soybean flour influenced protease production in different ways because of their complex biochemical nature and animal and plant origin, respectively. Furthermore, both fish glue and soybean flour were found to be effective low-cost substrates for large-scale protease production. The significance of each medium ingredient was evaluated using ANOVA, resulting in a high t-value of glucose and fish glue, indicating the null hypothesis can be accepted. The model accuracy was verified using the coefficient of determination R2, which was 0.80, showing that the null hypothesis can be obtained. Overall the statistical medium optimization by CCD and RSM has resulted in five-fold (55.2 U/ml) enzyme production under optimized media conditions.
Purification of protease
Enzyme purification helps enzyme characterization, functional abilities, and potential applications. Excess salt in the metabolite production media poses a challenge to purifying proteins produced by halophilic microorganisms. Also, salts are necessary for maintaining the structural integrity and functional attributes of most halophilic proteins throughout the purification process [3]. The ideal purification technique is usually unavailable for any halophilic enzyme purification, as there is no standard literature and methodology to purify the halophilic enzymes/proteins. In the case of halophilic enzyme purification, the traditional ammonium sulfate precipitation method may result in a precipitate with a significant loss of protease activity. The extracellular protease produced by S. tamaricis BGN2 was successfully purified using a combination of two approaches. The acetone precipitation and anion exchange and gel filtration permeation chromatography were used here. In the initial stage, the precipitation of the enzyme was carried out with 70% acetone saturation. This stage resulted in 60% enzyme recovery and 1.9-fold purification compared to 36% recovery and 1.6-fold purification with ammonium sulfate precipitation. Then, the dialyzed concentrated acetone concentrated sample was exposed to anion exchange chromatography using a DEAE-cellulose and Sephadex G-75 column. The dynamic fractions were eluted using 0.4 M NaCl during the purification process. Active fractions showing protease activity were collected, concentrated, and subjected to gel permeation chromatography using a Sephadex G-75 column [47].
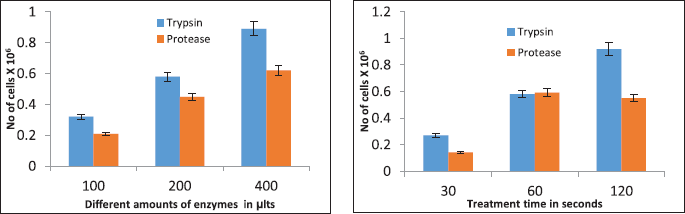
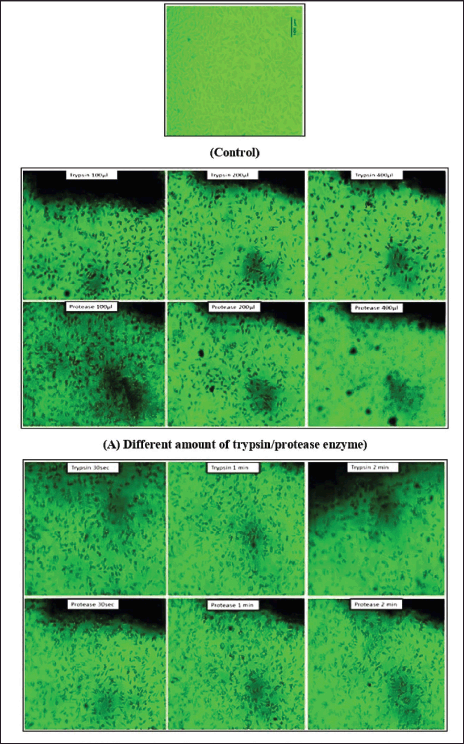 | Figure 12. The trypsin-like activity of protease in sub-culture of MCF7 cell-line. Control-untreated cells (A) effects of trypsin and protease at different doses (100, 200, and 400 μl) and (B) effects of trypsin and protease at time intervals (30 seconds, 1 minute, and 2 minutes). [Click here to view] |
 | Figure 13. Effectiveness of trypsin and protease enzymes in dislodging the MCF7 cell line in culture. (a) Effects of different amounts of trypsin and protease (Control-Untreated, 100, 200, and 400 μl) and (b) effects of trypsin and protease at different time intervals (Control-Untreated, 30 seconds, 1 minute, and 2 minutes). [Click here to view] |
The pattern for elution showed a prominent protein peak having protease activity (Fig. 10). For S. tamaricis BGN2, 70% acetone was effective and demonstrated a specific activity of 4.56 U/mg against 3.90 U/mg by ammonium sulfate precipitation. After the final purification step, the protease was found to be purified by 7.10 fold, with a recovery of 24% with a specific activity of 17.1 U/mg (Table 8). The extent of S. tamaricis BGN2 protease purification at each stage is shown in Table 8, and the final gel filtration chromatography using Sephadex G-75 column (Fig. 10) to yield 7.10 fold-purified protease having 7,245 U of total enzyme activity and 17.1 U/mg of specific activity. Details of the purification stages, elution pattern, protein content, and enzyme activity of the enzyme indicated that the enzyme was purified up to 7.1-fold, with a recovery yield of 24%. In one of the earlier studies, protease produced from Bacillus sp. APP07 was purified by acetone precipitation and gel filtration chromatography resulting in three-fold protease enzyme purification [48].
Furthermore, the homogenous nature of the purified enzyme was evaluated and confirmed by denaturing SDS-PAGE and native casein zymography, which reveals a single band of 43 kDa with a clear zone of casein substrate hydrolysis in the gel after Coomassie blue staining (Fig. 11). As per the earlier studies, the molecular weight of microbial alkaline proteases is 20–45 kDa [4]. Further molecular weights of many of the salt-stable proteases obtained from halophilic/halotolerant microbes have molecular weights that range from 20 to 71 kDa [37]. However, high molecular weight halophilic proteases with 100 kDa have also been reported from Halobacillus thailandensis sp. Nov [49].
Application of protease in dissociation of MCF7 monolayer cell line
Here, we studied the ability of enzymes to dissociate monolayer cells grown on the surface of a culture plate. Protease demonstrated a significant dissociation of adhered cells during passaging of the MCF-7 monolayer cell line, as reported in the earlier study [18,26]. Cell monolayer before treatment with the enzyme and then flooded with PBS containing purified enzyme and trypsin in different volumes (100, 200, and 400 µl) and incubated for 2 minutes and visualized under a microscope (Fig. 12). Further cellular monolayer before treatment with the protease and then flooded with PBS containing purified protease and trypsin (200 µl) incubated at different intervals of time (30 seconds, 1 minute, and 2 minutes) and observed under microscope (Fig. 12). This shows that the adhered cells were freed from the surface after adding the enzyme, and the cells were found to float freely after adding the fresh medium. In both parameter studies, it was observed that protease was showing similar results as trypsin. A negative control experiment was carried out without trypsin as well as protease.
The dissociation activity of protease was observed in both a time-dependent and dose-dependent manner. The dissociation activity of protease was optimal without having a visible damaging effect from 100 to 200 µl. Still, the 300 µl dose showed slight distortions in cell morphologies (Fig. 13) compared to untreated cells (control). Similarly, in the time-dependent studies, it was observed that even after 2 minutes treatment with a protease, the MCF7 cell line does not show any cellular distortions suggesting its suitability in successful dissociation of cell lines before subculture. Furthermore, we believe that the protease may belong to the serine protease class which the trypsin belongs as many of the halophilic proteases are predominantly serine protease type [18]. In routine passaging of mammalian cell lines, cells are usually treated with EDTA to remove Ca2+ as it inhibits the dissociation activity of trypsin. The enzyme characterization studies found that Ca2+ increased protease activity; hence, treatment with EDTA was not required when protease was used for cell dissociation.
CONCLUSION
The present work reports the isolation, optimized production, purification, and cell culture applications for halophilic protease produced by S. tamaricis BGN2. The protease was concentrated by acetone precipitation and purified by DEAE-cellulose ion exchange and Sephadex G-75 gel filtration chromatography. SDS-PAGE and zymography analysis confirmed a molecular weight of 43 kDa for the purified protease belonging to the serine-protease. The significant medium components (glucose, fish glue, soybean flour, CaCl2, and NaCl) were optimized by RSM using CCD. A fivefold increase in protease production was achieved, i.e., from 11.2 to 55.2 U/ml under optimized conditions. Purified protease demonstrated unique trypsin-like activity and excellent cell dislodging properties in the sub-culture MCF7 cell line. Purified protease demonstrated significant cell dislodging activity even without EDTA treatment providing an alternative to trypsin/pepsin for cell culture application. Further studies need to be conducted with different media components and cell lines to prove the suitability of protease in cell culture applications.
ACKNOWLEDGMENTS
The present study was supported by KLE Technological University’s in-house research support from the Technical Education Quality Improvement Program of the World Bank Group.
AUTHOR CONTRIBUTIONS
The authors GBT, BSH, and AMJ together developed the concept and design. Material preparation, data collection, and analysis were performed by GBT and BSH. The first draft of the manuscript was prepared by GBT and AMJ helped in finalizing the figures and tables. All the authors commented on previous drafts of the manuscript, and the suggested revisions were incorporated into the draft by GBT and AMJ. The final editing and value addition for the manuscript were done by BSH. All authors read and approved the final manuscript.
FINANCIAL SUPPORT
There is no funding to report.
CONFLICTS OF INTEREST
The authors declared that there is no conflicts of interest.
ETHICAL APPROVALS
This study does not involve experiments on animals or human subjects.
DATA AVAILABILITY
All the data generated and analyzed are included in this research article.
PUBLISHER’S NOTE
This journal remains neutral concerning jurisdictional claims in published institutional affiliations.
REFERENCES
1. Suberu Y, Akande I, Samuel T, Lawal A, Olaniran A. Cloning, expression, purification and characterization of serine alkaline protease from Bacillus subtilis RD7. Biocatal Agric Biotechnol. 2019;20(101264):101264. CrossRef
2. Razzaq A, Shamsi S, Ali A, Ali Q, Sajjad M, Malik A, et al. Microbial proteases applications. Front Bioeng Biotechnol. 2019;7(110):1–20. CrossRef
3. Mokashe N, Chaudhari B, Patil U. Operative utility of salt-stable proteases of halophilic and halotolerant bacteria in the biotechnology sector. Int J Biol Macromol. 2018;117:493–522. CrossRef
4. Lakshmi BKM, Muni Kumar D, Hemalatha KPJ. Purification and characterization of alkaline protease with novel properties from Bacillus cereus strain S8. J Genet Eng Biotechnol. 2018;16(2):295–304. CrossRef
5. Zhang Y, Hu J, Zhang Q, Cai D, Chen S, Wang Y. Enhancement of alkaline protease production in recombinant Bacillus licheniformis by response surface methodology. Bioresour Bioprocess. 2023;10(27):1–11. CrossRef
6. Ibrahim ASS, Al-Salamah AA, El-Badawi YB, El-Tayeb MA, Antranikian G. Detergent, solvent and salt-compatible thermoactive alkaline serine protease from halotolerant alkaliphilic Bacillus sp. NPST-AK15: purification and characterization. Extremophiles. 2015;19(5):961–71. CrossRef
7. Reddy LVA, Wee YJ, Yun JS, Ryu HW. Optimization of alkaline protease production by batch culture of Bacillus sp. RKY3 through Plackett–Burman and response surface methodological approaches. Bioresour Technol. 2008;99(7):2242–9. CrossRef
8. Adinarayana K, Ellaiah P, Prasad DS. Purification and partial characterization of thermostable serine alkaline protease from a newly isolated Bacillus subtilis PE-11. AAPS PharmSciTech. 2003;4(4):440–8. CrossRef
9. Eswari JS, Anand M, Venkateswarlu C. Optimum culture medium composition for rhamnolipid production by Pseudomonas aeruginosa AT10 using a novel multi-objective optimization method. J Chem Technol Biotechnol. 2013;88(2):271–9. CrossRef
10. Montgomery DC. Design and analysis of experiments. 5th ed. New York, NY: John Wiley & Sons; 2017.
11. Saxena R, Singh R. Statistical optimization of conditions for protease production from Bacillus sp. Acta Biol Szegediensis. 2010;54(2):135–41. CrossRef
12. Tennalli GB, Garawadmath S, Sequeira L, Murudi S, Patil V, Divate MN, et al. Media optimization for the production of alkaline protease by Bacillus cereus PW3A using response surface methodology. J Appl Biol Biotechnol. 2022;10(4):17–26. CrossRef
13. Ben Rebah F, Miled N. Fish processing wastes for microbial enzyme production: a review. 3 Biotech. 2013;3(4):255–65. CrossRef
14. Akter S, Rahman MA, Naher J, Majumder MWR, Alam A. Fish glue from Tilapia scale and skin and its physical and chemical characters. Int J Fish Aquat Sci. 2017;5(2):255–7.
15. Jadhav SB, Nirval MM. Evaluation of proximate composition of soyflour samples prepared from different methods. Pharma Innov. 2021;10(8):1574–6.
16. Sharma KM, Kumar R, Panwar S, Kumar A. Microbial alkaline proteases: optimization of production parameters and their properties. J Genet Eng Biotechnol. 2017;15(1):115–26. CrossRef
17. Asker MMS, Mahmoud MG, El Shebwy K, Abd el Aziz MS. Purification and characterization of two thermostable protease fractions from Bacillus megaterium. J Genet Eng Biotechnol. 2013;11(2):103–9. CrossRef
18. Manjusha K, Jayesh P, Jose D, Sreelakshmi B, Priyaja P, Gopinath P, et al. Alkaline protease from a non-toxigenic mangrove isolate of Vibrio sp. V26 with potential application in animal cell culture. Cytotechnology. 2013;65(2):199–212. CrossRef
19. Rous P, Jones FS. A method for obtaining suspensions of living cells from the fixed tissues, and for the plating out of individual cells. J Exp Med. 1916;23(4):549–55. CrossRef
20. Nestler L, Evege E, Mclaughlin J, Munroe D, Tan T, Wagner K, et al. TrypLE TM express: a temperature stable replacement for animal trypsin in cell dissociation applications. Quest. 2004;1:1–6. Available from: https://www.researchgate.net/publication/268293142_TrypLE_Express_A_Temperature_Stable_Replacement_for_Animal_Trypsin_in_Cell_Dissociation_Applications
21. Sundararajan S, Kannan CN, Chittibabu S. Alkaline protease from Bacillus cereus VITSN04: potential application as a dehairing agent. J Biosci Bioeng. 2011;111(2):128–33. CrossRef
22. Kunitz M. Isolation of a crystalline protein compound of trypsin and of soybean trypsin-inhibitor. J Gen Physiol. 1947;30(4):311–20. CrossRef
23. Fahmy NM, El-Deeb B. Optimization, partial purification, and characterization of a novel high molecular weight alkaline protease produced by Halobacillus sp. HAL1 using fish wastes as a substrate. J Genet Eng Biotechnol. 2023;21(48):1–16. CrossRef
24. Kandasamy S, Muthusamy G, Balakrishnan S, Duraisamy S, Thangasamy S, Seralathan K-K, et al. Optimization of protease production from surface-modified coffee pulp waste and corncobs using Bacillus sp. by SSF. 3 Biotech. 2016;6(167):1–11. CrossRef
25. Hegde S, Bhadri G, Narsapur K, Koppal S, Oswal P, Turmuri N, et al. Statistical optimization of medium components by response surface methodology for enhanced production of bacterial cellulose by Glucanacetobacter persimmonis. J Bioprocess Biotech. 2013;4:1–5. CrossRef
26. Suryia Prabha M, Divakar K, Deepa Arul Priya J, Panneer Selvam G, Balasubramanian N, Gautam P. Statistical analysis of production of protease and esterase by a newly isolated Lysinibacillus fusiformis AU01: purification and application of protease in sub-culturing cell lines. Ann Microbiol. 2015;65(1):33–46. CrossRef
27. Alam AA, Goda DA, Soliman NA, Abdel-Meguid DI, El-Sharouny EE, Sabry SA. Production and statistical optimization of cholesterol-oxidase generated by Streptomyces sp. AN strain. J Genet Eng Biotechnol. 2022;20(156):1–15. CrossRef
28. Akolkar A, Bharambe N, Trivedi S, Desai A. Statistical optimization of medium components for extracellular protease production by an extreme haloarchaeon, Halobacteriumsp. SP1(1). Lett Appl Microbiol. 2009;48(1):77–83. CrossRef
29. Rajkumar R, Jayappriyan KR, Rengasamy R. Purification and characterization of a protease produced by Bacillus megaterium RRM2: application in detergent and dehairing industries. J Basic Microbiol. 2011;51(6):614–24. CrossRef
30. Sathishkumar R, Ananthan G, Arun J. Production, purification and characterization of alkaline protease by ascidian associated Bacillus subtilis GA CAS8 using agricultural wastes. Biocatal Agric Biotechnol. 2015;4(2):214–20. CrossRef
31. Bradford MM. A rapid and sensitive method for the quantitation of microgram quantities of protein utilizing the principle of protein-dye binding. Anal Biochem. 1976;72:248–54. CrossRef
32. Diaz M, Moyano FJ, Garcia-Carreno FL, Alarcon FJ, Sarasquete MC. Substrate-SDS-PAGE determination of protease activity through larval development in sea bream. Aquac Int. 1997;5(5):461–71. CrossRef
33. Jayakumar R, Jayashree S, Annapurna B, Seshadri S. Characterization of thermostable serine alkaline protease from an alkaliphilic strain Bacillus pumilus MCAS8 and its applications. Appl Biochem Biotechnol. 2012;168(7):1849–66. CrossRef
34. de la Haba RR, Sánchez-Porro C, Márquez MC, Ventosa A. Taxonomic study of the genus Salinicola: transfer of Halomonas salaria and Chromohalobacter salarius to the genus Salinicola as Salinicola salarius comb. nov. and Salinicola halophilus nom. nov., respectively. Int J Syst Evol Microbiol. 2010;60(4):963–71. CrossRef
35. Sandhya C, Nampoothiri KM, Pandey A. Microbial proteases. In: Barredo JL, editor. Microbial enzymes and biotransformations. New Jersey, NJ: Humana Press; 2005. pp 165–79.
36. Kalwasinska A, Jankiewicz U, Felföldi T, Burkowska-But A, Brzezinska MS. Alkaline and halophilic protease production by Bacillus luteus H11 and its potential industrial applications. Food Technol Biotechnol. 2018;56(4):553–61. CrossRef
37. Jain D, Pancha I, Mishra SK, Shrivastav A, Mishra S. Purification and characterization of haloalkaline thermoactive, solvent stable and SDS-induced protease from Bacillus sp.: a potential additive for laundry detergents. Bioresour Technol. 2012;115:228–36. CrossRef
38. Anithajothi R, Nagarani N, Umagowsalya G, Duraikannu K, Ramakritinan CM. Screening, isolation and characterization of protease producing moderately halophilic microorganism Halomonas meridian associated with coral mucus. Toxicol Environ Chem. 2014;96(2):296–306. CrossRef
39. Vijayaraghavan P, Jebamalar TRJ, Vincent SGP. Biosynthesis, optimization and purification of a solvent stable alkaline serine protease from Halobacterium sp. Ann Microbiol. 2012;62(1):403–10. CrossRef
40. Mokashe N, Chaudhari A, Patil U. Optimal production and characterization of alkaline protease from newly isolated halotolerant Jeotgalicoccus sp. Biocatal Agric Biotechnol. 2015;4(2):235–43. CrossRef
41. Mothe T, Sultanpuram VR. Production, purification and characterization of a thermotolerant alkaline serine protease from a novel species Bacillus caseinilyticus. 3 Biotech. 2016;6(53):1–10. CrossRef
42. Haider MA, Pakshirajan K. Screening and optimization of media constituents for enhancing lipolytic activity by a soil microorganism using statistically designed experiments. Appl Biochem Biotechnol. 2007;141(2–3):377–90. CrossRef
43. Patel AR, Mokashe NU, Chaudhari DS, Jadhav AG, Patil UK. Production, optimization and characterization of extracellular protease secreted by newly isolated Bacillus subtilis AU-2 strain obtained from Tribolium castaneum gut. Biocatal Agric Biotechnol. 2019;19(101122):101122. CrossRef
44. Xing Q, de Wit M, Kyriakopoulou K, Boom RM, Schutyser MAI. Protein enrichment of defatted soybean flour by fine milling and electrostatic separation. Innov Food Sci Emerg Technol. 2018;50:42–9. CrossRef
45. Patil U, Chaudhari A. Production of alkaline protease by solvent-tolerant alkaliphilic Bacillus circulans MTCC 7942 isolated from hydrocarbon contaminated habitat: process parameters optimization. ISRN Biochem. 2013;2013:1–10. CrossRef
46. Singh SK, Singh SK, Tripathi VR, Khare SK, Garg SK. Comparative one-factor-at-a-time, response surface (statistical) and bench-scale bioreactor level optimization of thermoalkaline protease production from a psychrotrophic Pseudomonas putida SKG-1 isolate. Microb Cell Fact. 2011;10(114):1–13. CrossRef
47. Ibrahim ASS, Elbadawi YB, El-Tayeb MA, Al-Maary KS, Maany DAF, Ibrahim SSS, et al. Alkaline serine protease from the new halotolerant alkaliphilic Salipaludibacillus agaradhaerens strain AK-R: purification and properties. 3 Biotech. 2019;9(391):1–11. CrossRef
48. Shaikh IK, Dixit PP, Shaikh TM. Purification and characterization of alkaline soda-bleach stable protease from Bacillus sp. APP-07 isolated from laundromat soil. J Genet Eng Biotechnol. 2018;16(2):273–9. CrossRef
49. Chaiyanan S, Chaiyanan S, Maugel T, Huq A, Robb FT, Colwell RR. Polyphasic taxonomy of a novel Halobacillus, Halobacillus thailandensis sp. nov. isolated from fish sauce. Syst Appl Microbiol. 1999;22(3):360–55. CrossRef