INTRODUCTION
Rizatriptan benzoate is a new class of 5-hydroxytryptamine 1B/1D receptor and its International Union of Pure and Applied Chemistry name is N, N-dimethyl-5-(1H-1,2,4-triazol-1-yl-methyl)-1H-indole-3-ethanamine mono benzoate and its structure shown in Figure 1. This drug is efficiently useful for the treatment of brain-related chronic syndromes like severe headaches and migraines. The biochemical reaction of the drug is bonded with serotonium in the brain results in relief from the pain [1,2]. Plentiful pharmaceutical industries have been manufacturing this drug product either in combination or individually with other drug substances of different strengths.
The literature study found that an author [3] finds the synthetic route of Rizatriptan benzoate includes the evidence of impurity 2-(5-((1H-1,2,4-triazol-1-yl)methyl)-2-((3-(2-(dimethylamino)ethyl)-1H-indol-5-yl)methyl)-1H-indol-3-yl)-N,N dimethylethan-1-amine and developed a preparative chromatography method for isolation and removal.
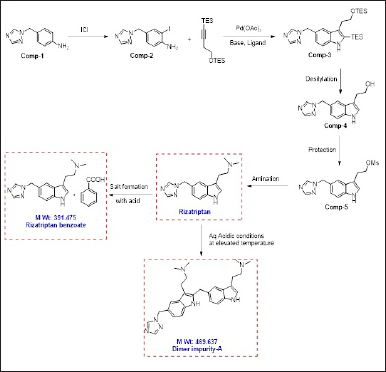 | Figure 1. Root of synthesis for Rizatriptan benzoate. [Click here to view] |
So far there is no analytical method for quantification and validation of this impurity in Rizatriptan drug substance by using ultra performance liquid chromatographic (UPLC) technique. The chemical structure of this impurity shows the presence of the hydrazine (-N-N-) group which shows genotoxic alerts [4]. So many organic molecules containing the hydrazine group and these chemicals show toxicological concerns like genotoxic, carcinogenic, and mutagenic characteristics. A genotoxic impurity (GI) might be evident in a drug substance through the synthetic process through reagents, by-products, starting material, intermediate, or upon the stability of the drug substance as a degradent. As per the interpretation of the International Conference on Hormonization (ICH) procedures for unknown peak as GI , the threshold of toxicological concern (TTC) based on an acceptable intake of 1.5 μg/g was considered and it might be an insignificant risk. Generally acceptable limit is adapted as intake with a default of pharmaceuticals. According to a maximum daily dosage of Rizatriptan is 30 mg and claimed GI is targeted to control at 50 μg/g. Therefore, to assess this quantity required a specific and sensitive analytical method to regulate GI below the TTC level of 50 μg/g in Rizatriptan benzoate.
The literature study found that few authors developed several methods for quantification and identification of Rizatriptan benzoate and its related substances by using high-performance liquid chromatography (HPLC) [5–11] Spectrophotometric methods [12–14] UPLC [15] and liquid chromatography–mass spectrometry [16]. However, there is no analytical method for identification and validation of GI in Rizatriptan benzoate lower than TTC acceptable level. The proposed method is useful for monitoring the strengths of impurity during the process. The impacts of GI the authors developed a UPLC analytical method for the quantification and validation of GI in Rizatriptan benzoate.
MATERIALS AND METHODS
Instrumentation and software
For determination of Rizatriptan assay and related substances are analysed on Agilent manufactured UPLC system equipped with sample manager, quaternary solvent manager, column heating compartment and variable wavelength detector (VWD) assembled with Empower control software.
The chromatographic requirements are Waters Acquity BEH C18 HPLC column with dimensions 100 × 3.0 mm × 1.8 μm was used. The preparation of standard solutions by Sartorius semi-micro analytical balance was used for all weights of samples. Bandelin sonicator was used for dissolving the standard sample and maintain physiological pH by Thermo pH meter. Hermle centrifuge machine was used for centrifuging of turbidity components.
Chemicals and reagents
Standard dimer impurity-A and Rizatriptan benzoate were purchased from Toronto research chemicals, India. Acetonitrile (ACN) (HPLC grade, Purity-99.9%) and orthophosphoric acid (GR grade, Purity-85.0%) were procured from Merck Limited, Mumbai, India. All quantitative dilutions were performed with triple distilled water in the class-A glass volumetric flasks.
Mobile phase preparations
Preparation of buffer
The standard buffer solution was prepared by dissolving 1 ml of ortho phosphoric acid in 1,000 ml Milli-Q-Water and mixed well.
Preparation of mobile phase-A
Mobile phase solution-A was prepared by thoroughly mixing 20:80% (v/v) compositions of ACN and buffer solutions respectively.
Mobile phase-B
ACN.
Preparation of diluent
All solutions have been prepared by ACN as a diluent.
Standard stock solutions preparation
Weighed and transferred approximately 3.8 mg of dimmer impurity-A into a 100 ml volumetric flask and it consists of 50 ml of diluent by mixing well through sonication and it is further saturated to get 0.38 μg/ml of dimer impurity-A standard concentration.
Preparation of working standard solution
Accurately prepare 0.38 μg/ml of working standard solution via taking 1 ml of the stock fed in to 100 ml of glass volumetric flask of class-A then it was further diluted with diluents.
Sample solution preparation
400 mg (weigh to an accuracy of 0.1 mg) of Rizatriptan benzoate sample was accurately weighed by using butter paper and transferred into 20 μl class-A volumetric flask and added 10 μl of diluent and dissolved the sample matrix for 10 minutes by sonication. Later, this solution makeup with diluent up to mark.
Spiked sample solution preparation
400 mg (weigh to the accuracy of 0.1 mg) of Rizatriptan benzoate sample was precisely weighed and transmitted into a class-A volumetric flask of 20 μl and added 10 ml of diluent was. Further dissolved the components for 10 minutes by sonication. Later, added 0.2 ml of stock standard solution and the remaining volume makeup up to the mark with diluent.
Method development
The dimer impurity-A in the Rizatriptan benzoate drug substance is determined by a newly developed reverse phase UPLC instrument. This analytical UPLC method was optimized based on the following parameters diluent, flow rate, injection volume, oven temperature, UPLC column, and wavelength selection.
Wavelength selection for dimer impurity-A
Dimer impurity-A standard solution was prepared by using diluent and the obtained solution concentration was ~0.38 μg/ml. This solution was analyzed by UPLC instrument with a VWD. The absorption maxima of dimer impurity-A were observed at 280.7 nm. Hence, we quantified this impurity at 280 nm in the Rizatriptan benzoate drug substance. The obtained chromatogram spectrum of dimer impurity-A is presented in Figure 2.
Column selection
Based on the packing material, internal diameter, length, and particle size of the column, various experimental trails were made for column selection. Finally, good peak separation was attained on the UPLC column of Waters Acquity BEH C18.
Selection of mobile phase
Initially, we tried with different proportions of water and methanol as a mobile phase in the different ratios, in all trails the dimer impurity-A peak was not identified. The organic modifier was modified in various ratios with ACN. It was observed that the impurity-A peak has more tailing factor and is broad. For ideal peak shape and tailing was observed by replacing water with phosphate buffer. The organic modifier of ACN and buffer composition was finalized after a number of trails. The mobile phase solution-A contains the organic solvent of ACN with ratios of 80:20% v/v of ACN and mobile phase solution-B.
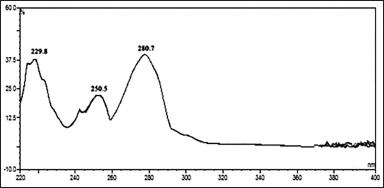 | Figure 2. PDA spectrum of dimer imp-A. [Click here to view] |
Column oven temperature selection
Different column oven temperatures have been tested between the 25ºC and 45ºC temperatures and we found that the 40ºC column temperature was best for the well-separated and reproducible results.
Selection of flow rate
For the good resolution of the chromatogram, optimized the instrument flow rate from 0.3 to 0.6 ml/minute. Finally, 0.5 ml/minute was given separation of the chromatogram.
Selection of injection volume
The optimized injection volume was from 2 to 10 μl but the ideal chromatogram separation was observed at 5 μl.
Selection of diluent
The Rizatriptan drug substance and dimer impurity-A solubility were checked in methanol, water, buffer solution, ACN, and the mixture of ACN: water, methanol: water, and ACN: buffer solution in different ratios. Good solubility was observed in the organic solvent of ACN. Therefore, ACN is used for further quantitative dilutions of standard and sample solutions. The developed analytical chromatographic conditions for the quantification of dimer impurity-A in Rizatriptan benzoate substance by UPLC and the optimized chromatogram specifications were placed in Table 1.
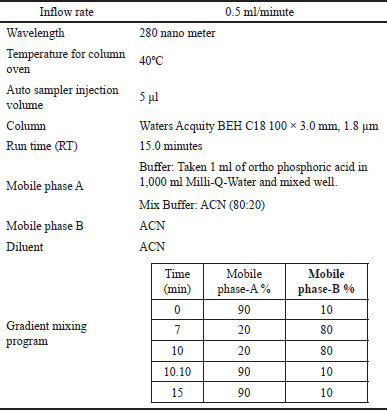 | Table 1. Optimized chromatogram specifications. [Click here to view] |
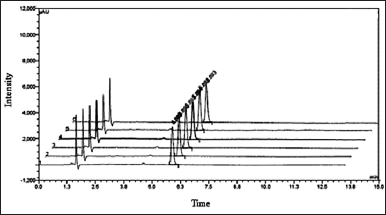 | Figure 3. Overlay chromatogram six replicate standard solution injections. [Click here to view] |
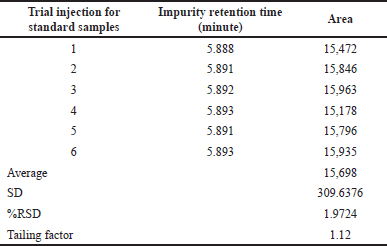 | Table 2. Chromatogram results of six replicate standard injections. [Click here to view] |
 | Table 3. Results of specificity parameter. [Click here to view] |
 | Table 4. Results of LOD and LOQ. [Click here to view] |
Validation of analytical method
The developed and optimized UPLC approach for the identification and validation of dimer impurity-A in Rizatriptan benzoate sample based on ICH [17] and USP [18] guidelines. The individual validation parameters were evaluated experimentally by injected sample solution and standard solution.
System suitability
A 0.38 μg/ml concentration of the dimer Impurity-A standard solution was prepared. Six replicates of 5μl of this solution were inoculated into the UPLC system. Statically calculated the relative SD, and SD and checked the tailing factor and theoretical plate counts for the six replicated areas. The chromatograms obtained during the study are presented in Figure 3 and their calculated results are in Table 2.
Specificity
The developed method specificity was established by injecting dimer impurity-A standard solution, drug substances of Rizatriptan benzoate, and blank and dimer impurity-A spiking solution. The observations are summarized in Table 3. Experimentally generated analytical chromatograms are represented in Figure 4.
Limit of detection and limit of quantification (LOD and LOQ)
The dimer impurity-A LOD and LOQ were performed by S/N ratio approach and preparing various concentrations of dimer impurity-A solution and evaluated through UPLC equipment. The LOD concentration of the impurity was determined by observing that the S/N ratio was 3:1. The LOQ concentration of the impurity was determined by observing an S/N ratio of approximately 10:1. The results and their chromatograms are shown in Table 4 and Figures 5 and 6 of LOD and LOQ, respectively.
Precision at the limit of quantitation level
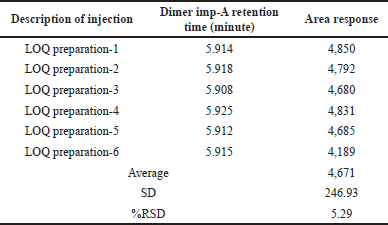
Prepared dimer impurity-A solution at LOQ concentration level for determination impurity precision at LOQ level and six replicates were injected into developed method conditions. Calculated the % RSD for the area of six injections and results are placed in Table 5.
Linearity and range
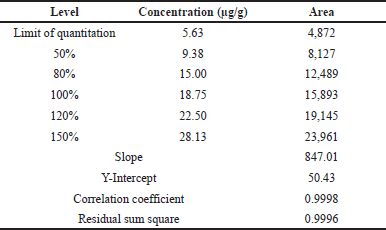
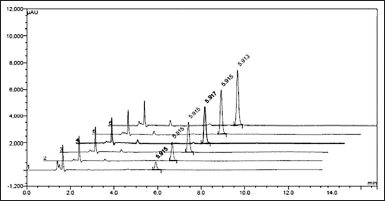
The linearity of the proposed method was assessed by preparing their impurity-A standard stock solutions of the dimer into six concentrations from LOQ to 150%. Analyzed each diluted concentration and have been recorded area responses at 280 nm. Draw the linearity plot between peak versus concentration and their data was used for the analytical parameters like the correlation coefficient of the regression line, slope, intercept, and sum of squares.
The obtained linearity results are tabulated in Table 6 and the linearity curve is represented in Figure 7 for impurity-A and their overlay chromatograms are shown in Figure 8.
Precision
The precision is studied through repeatability and intermediate precision for optimized analytical method and calculated %RSD.
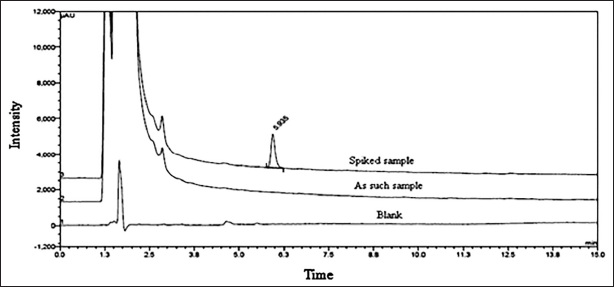 | Figure 4. Super imposed chromatogram. [Click here to view] |
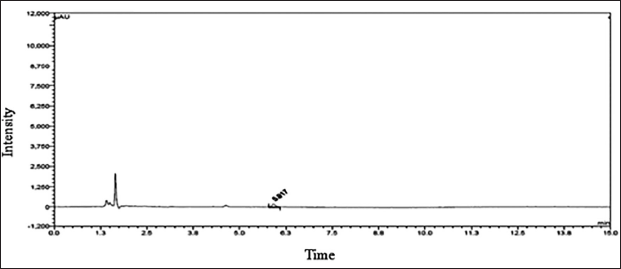 | Figure 5. Detection limit chromatogram. [Click here to view] |
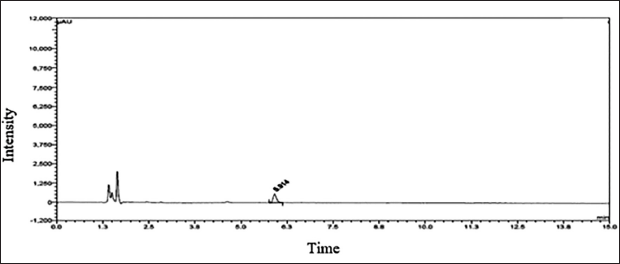 | Figure 6. Quantification limit chromatogram. [Click here to view] |
Repeatability
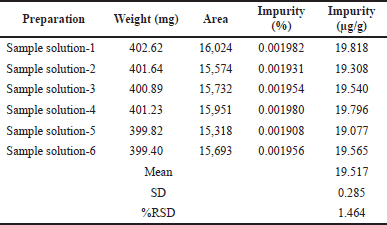
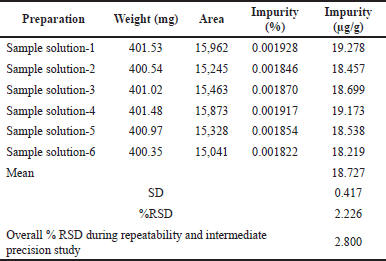
Six solutions were prepared by mixing the dimer impurity-A with the Rizatriptan benzoate sample and analyzed in the proposed method conditions for assessing the correctness of the proposed approach. The content of dimer impurity-A in μg/g was calculated by average, SD, and the %RSD, and which results were found to meet the limits.
Intermediate precision
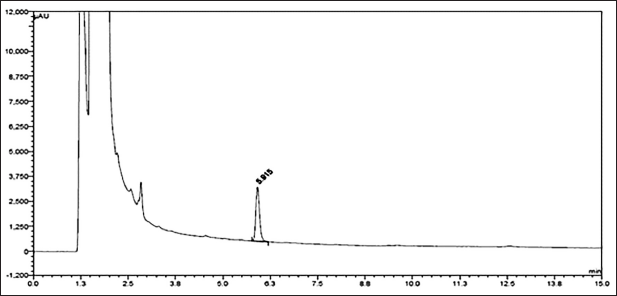
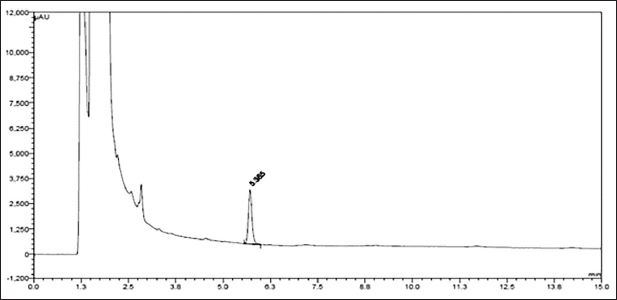
Performing the intermediate precision analysis by two operators on a couple of days by using the UPLC instrument. Statically calculated the mean of dimer impurity-A, SD, and percentage of relative SD and these results are in the acceptable limits. Tables 7 and 8 represent the repeatability and intermediate precision data. The representative chromatograms are shown in Figures 9 and 10.
 | Table 5. Precision reports at the limit of quantitation concentration. [Click here to view] |
 | Table 6. Results of linearity. [Click here to view] |
 | Figure 7. Linearity plot of impurity-A. [Click here to view] |
Accuracy
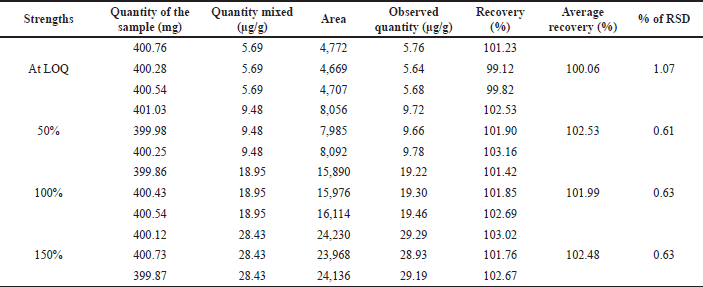
By spiking the dimer impurity-A into the drug sample at 50% upper and lower levels of target concentration and analyzed in instrument conditions. The spiked and recovered amount of dimer impurity-A was calculated the percentage of recovery was presented in Table 9 and chromatograms were presented in Figure 11. The obtained recovery values are between 99% and 103% which provides the recovery nature of the method.
 | Figure 8. Overlay chromatogram of linearity. [Click here to view] |
 | Table 7. Results of repeatability. [Click here to view] |
 | Table 8. Results of intermediate precision. [Click here to view] |
 | Figure 9. Chromatogram of repeatability. [Click here to view] |
 | Figure 10. Chromatogram of intermediate precision. [Click here to view] |
 | Table 9. Results of recovery. [Click here to view] |
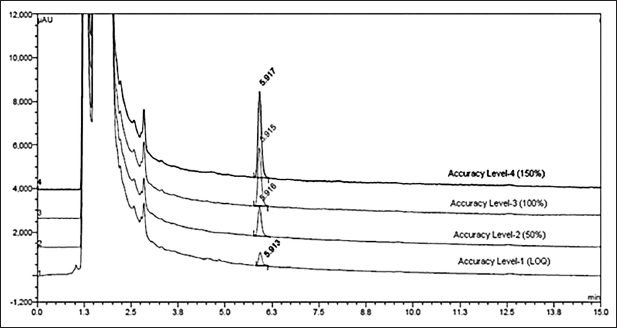 | Figure 11. Accuracy overlay chromatograms at 150%, 100%, 50%, and LOQ level. [Click here to view] |
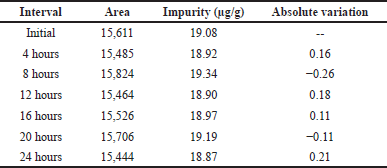 | Table 10. Results of solution stability. [Click here to view] |
Solution stability
Dimer impurity-A stability was established by using the precision sample and it was kept in RT for a period of 24 hours and analyzed in an interval of 4 hours increment up to 4 hours and then analyzed with an interval of 4 hours up to 24 hours. The chromatograms for these intervals were evaluated for the absolute changes of dimer impurity-A at specific concentrations are presented in Table 10.
RESULTS AND DISCUSSIONS
The proposed UPLC method for estimation and validation of potential genotoxic dimer impurity 2-(5-((1H-1,2,4-triazol-1-yl)methyl)-2-((3-(2-(dimethylamino)ethyl)-1H-indol-5-yl)methyl)-1H-indol-3-yl)-N,N dimethylethan-1-amine in Rizatriptan benzoate active pharma ingredient (API) using Waters Acquity BEH C18 column with specific dimensions like 100 × 3.0 mm, 1.8 μm and gradient mobile phase. This approach was validated through fulfill ICH guidelines show various analytical parameters like linearity, accuracy, specificity, precision, stability, robustness, LOD, and LOQ obey the acceptance limits. The specificity of the proposed analytical method was proved by good separation with no interference observed at the region of dimer impurity-A. A linear graphical representation was achieved by drawing the plot between the strengths of impurity-A from LOQ to 150% of the dimer impurity-A. The correlation coefficient of GI-A was found 0.999 is within the accepted criteria of more than 0.990.
The detection limit for this method is 1.86 μg/g and the S/N ratio proved at this concentration level. This S/N ratio is 3.95 against the ICH guidelines of 3:1. The limit of quantitation is 5.63 μg/g and signal to noise ration observed as 14.11. This is well within the acceptance criteria i.e., 10:1. And the %RSD for six replicate injections at the limit of quantitation concentration is 2.29 which is within the ICH criteria of not more than 10.0%. This approach precision was identified through multiple trials and intermediate precision was calibrated based on % RSD of six replicate solutions. These results are 1.464% and 2.226% were found and meet the acceptance criteria of not more than 10.0% for ICH guidelines. Accuracy was evaluated at LOQ, 50%, 100%, and 150% levels of dimer impurity-A and results of recovery were obtained as 99% to 103%. These results are well within the criteria of 80% to 120%. The proposed method is stable for all the sample solutions and has good stability for about 24 hours under at room temperature.
CONCLUSION
The proposed UPLC technique is significant with respect to the accuracy, simple, and sensitive for the determination of potential genotoxic dimer impurity 2-(5-((1H-1,2,4-triazol-1-yl)methyl)-2-((3-(2-(dimethylamino)ethyl)-1H-indol-5-yl)methyl)-1H-indol-3-yl)-N,N dimethylethan-1-amine in Rizatriptan benzoate as per API during its manufacturing. This method is reliable to use for the identification of potential GI in commercially viable drugs and pharmaceutical industries.
ACKNOWLEDGMENTS
The authors are acknowledged to GITAM Central Research Laboratories for proving necessary facilities to perform this research work.
AUTHORS’ CONTRIBUTIONS
All the authors are collectively worked to do this research work at various stages of data collection, design of the work, data analysis, interpretation and drafting the article.
FINANCIAL SUPPORT
There is no funding support by any agency to pursue this research work.
CONFLICT OF INTEREST
The authors report no financial or any other conflicts of interest in this work.
ETHICAL APPROVALS
This study does not involve experiments on animals or human subjects.
DATA AVAILABILITY
All data generated and analyzed are included in this research article.
PUBLISHER’S NOTE
This journal remains neutral with regard to jurisdictional claims in published institutional affiliation.
REFERENCES
1. Montvale NJ. Physicians desk reference. 62nd ed. Montvale, NJ:Thomson Healthcare Inc; 2008.
2. Facts and Comparisons. Drug facts and comparisons. 53rd ed. St. Louis, MO: Lippincott Williams & Wilkins; 1999.
3. Srinivasula Reddy M, Manoj K, Kushal M, Sandeep K, Abijar B, Arvind L, et al. Preparative chromatography technique in the removal of isostructural genotoxic impurity in Rizatriptan: use of physicochemical descriptors of solute and adsorbent. Org Process Res Dev. 2009;13(4):683–9.
4. Lutz M, Robert JM, Christopher MR, Marta MA, David DA, Chris B, et al. A rationale for determining, testing, and controlling specific impurities in pharmaceuticals that possess potential for genotoxicity. Regul Toxicol Pharmacol. 2006;44(3):198–211.
5. Bhagawati ST, Sreenivasa Reddy M, Kiran A, Muddukrishna BS, Swapnil JD, Krishnamurthy B. Development and validation of reversed-phase high-performance liquid chromatography method for estimation of Rizatriptan benzoate in oral strip formulations. J Basic Clin Pharm. 2014;6(1):7–11.
6. Appasaheb BL. Rapid separation and determination of Rizatriptan n-oxide impurity in Rizatriptan benzoate in a bulk drug substance by reverse phase liquid chromatography. Asian J Pharm Clin Res. 2017;10(2):372–6.
7. Sirisha V, Sreedhar C, Sreenivasa Rao T. Analytical method development and validation for quantitative estimation of Rizatriptan benzoate. Open Access Sci Rep. 2013;2(1):1–4.
8. Kannappan N, Madhukar A, Ganesh A, Naveen Kumar CH, Mannavalan R. Analytical method development and validation of Rizatriptan benzoate tablets by RP-HPLC. Int J Pharm Tech Res. 2009;1(4):1704–8.
9. Mallikarjuna Rao B, Sangaraju S, Srinivasu MK, Madhavan P, Lalitha Devi M, Rajendra Kumar P, et al. Development and validation of a specific stability indicating high performance liquid chromatographic method for Rizatriptan benzoate. J Pharm Biomed Anal. 2006;41(4):1146–51.
10. Chandrashekhar KG, Yogendrakumar S, Chandewar AV, Pankaj B, Devendra K. Stability indicating method development and validation of assay method for the estimation of Rizatriptan benzoate in tablet. Arab J Chem. 2017;10(2):2067–72.
11. Jocic´ B, Zec?evic´ M, Z?ivanovic´ LJ, Lic?anski A. A chemometrical approach to optimization and validation of an HPLC assay for Rizatriptan and its impurities in tablets. Anal Lett. 2007;40:2301–16.
12. Vivek R, Amol K, Alpana K, Mohd Hassan GD, Maria S. Spectrophotometric estimation of Rizatriptan benzoate. Asian J Res Chem. 2010;3(1):175–7.
13. Uttam Prasad P, Divya Swetha M. Development and validation of stability indicating spectrophotometric method for the estimation of Rizatriptan benzoate in bulk and pharmaceutical dosage form. Int J Pharm Sci Res. 2013;4(10):4046–50.
14. Effat S, Abbas K, Noushin A, Massoud A. A new extractive spectrophotometric method for determination of Rizatriptan dosage forms using bromocresol green. DARU J Pharm Sci. 2013;21(12):1–6.
15. Koti Reddy Y, Subba Reddy GV, Jaya Veera KN, Kishore Kumar H. UPLC method for the determination of Rizatriptan benzoate and its related impurities. Int J Anal Bioanal Chem. 2012;2(4):228–34.
16. Ji-Fen G, Ai-Jun Z, Ling Z, Xiao-Hong S, Yi-Min Z, Hong-Zhi G, et al. Determination of Rizatriptan in human plasma by liquid chromatographic–eletrospray tandem mass spectrometry: application to a pharmacokinetic study. Biomed Chromatogr. 2006;20(1):61–6.
17. ICH Q2(R2). Validation of analytical procedures. Amsterdam, The Netherlands:ICH Q2(R2); 2023.
18. USP (1225). Validation of compendial procedures. USP (1225); 2022.