INTRODUCTION
Larotrectinib was the initial drug that was produced and approved to treat any type of cancer that had certain mutations, rather than just cancers of certain tissues. Larotrectinib is drug that inhibits a tyrosine kinase for the management of pediatric and adult patients with rigid tumors of either a) have an NTRK (neurotrophic receptor tyrosine kinase) gene merging without a defined mutation that leads to resistance, b) are spread to other parts of the body or where surgery would cause a lot of harm, and c) have no good alternatives. Larotrectinib chemically designated as (3S) -N-{5-[(2R)-2-(2, 5-difluorophenyl) pyrrolidin-1-yl] pyrazolo [1,5-a]pyrimidin-3-yl}-3-hydroxypyrrolidine-1-carboxamide, with chemical formula and weight of C21H22F2N6O2 and 428.44 g/mol (Fig. 1), respectively (Berger et al., 2018; Drilon et al., 2017). Tropomysoin receptor kinases (TRK) like TRK-C, TRK-A, and TRK-B produce actions that regularize the natural growth, difference, and existence of neuron cells when they interrelate with neutrotrophin ligands of endogenous type. TRK-C, TRK-A, and TRK-B are themselves encoded by the NTRK-3, NTRK-1, and NTRK-2 genes, correspondingly (Vaishnavi et al., 2015). Larotrectinib works to stop TRKs, like TRK-A, B, and C, from doing their jobs. Larotrectinib showed anti-tumor activity in both in vitro and in vivo tumor models in cells where TRK proteins were constantly turned on because of gene fusions, deletion of a protein regulatory domain, or overexpression of TRK proteins (Doebele et al., 2015; Fuse et al., 2017).
Few analytical methods were reported (Attwa et al., 2020; Chae et al., 2020; Fatim et al., 2020; Sparidansa et al., 2018) for the estimation of larotrectinib and its kinetic study in healthy rabbits by high performance liquid chromatography and liquid chromatography and tandem mass spectrometry (LC-MS/MS) techniques. There is a need for the development of an LC-MS/MS technique for the larotrectinib drug and validation of the developed procedure. The validated (Gong et al., 2012; Meunier et al., 2015) method should be applied to the pharmacokinetic study in animal rabbits.
MATERIALS AND METHODS
Chemicals and reagents
Mass spectrometric grade (more than 99.2%) pure formic acid was acquired from Merck Chemicals, Banglore, India. LC-grade methanol and acetonitrile (ACN) were obtained from JT Baker, Hyderabad, India. A blood bank in Hyderabad, India called Vivekananda provided samples of human plasma. Milli-Q the in-house Milli-Q® RO system was used to get water for making the movable phase, seal washes, and rinsing solvent. Larotrectinib and lenvatinib [internal standard (IS)] standards were acquired from Octapharma Pvt. Ltd., India. The institutional animal ethics committee gave the rabbit research approval under the following number: 1447/PO/Re/S/11/CPCSEA-58/A.
Instrument
API4000™ SCIEX LC/MS/MS triple quadrupole mass spectrometric system furnished with source as +ve electrospray ionization and liquid chromatographic system of Shimadzu consisting of binary pumps, autosampler (SIL-HTC) and oven for stationary phase was employed in current work. Data integration, acquisition, and quantitation were executed by operating version-1.6.3 Analyst® Software.
Mass and chromatographic system conditions
Liquid chromatography of larotrectinib and lenvatinib was attained on a reverse phase Phenominex (50 mm × 2.10 mm, 1.70 μ) C18 column of reverse phase. Analyte elution was accomplished with an isocratic system of solvents having ACN, methyl alcohol, and 0.1% formic acid in the fraction of 5%:3%:2%. The mobile system was monitored at a flow of 0.60 ml/minute. The mass instrument was run in ionization of +ve electrospray method with a resolution of unit mass in a quadrupole mass analyzer with 300 ms of dwell time and analytes were identified thru multiple reaction monitoring (MRM) modes. Optimized source constraints were set to 30 psi nebulizer N2 gas (gas-I), a voltage of ion spray: 4,500 V, 25 psi curtain gas flow-N2 (CUR), 30 psi auxiliary N2 gas (gas-II), with 400°C temperature of turbo sprayer and 20 psi collision-activated dissociation gas.
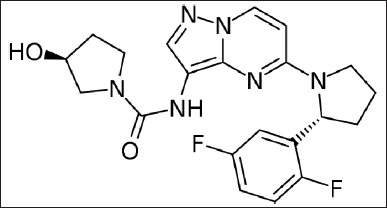 | Figure 1. Chemical structure of larotrectinib. [Click here to view] |
MRM transitions (m/z) designated for larotrectinib was 429.8 → 87.9 and lenvatinib (IS) 427.6→ 371.00. System suitability was executed every day at the beginning earlier to method validation experimentations. System suitability assessments involve six duplicate sample infusions after the extraction process at upper limit of quantification (ULOQ), lower limit of quantification (LLOQ), and blank levels from plasma. % Coefficient of variance (%CV) for peak response fraction (drug/IS) of six duplicate infusions was ≤2.0% (within the limits).
Sample processing
A simple liquid–liquid extraction (LLE) technique was implemented for extracting particular analyte and IS from plasma samples with ACN and methanol in a 50:50 ratio. To 100 μl aliquot of quality control (QC)/calibration standard analyte solutions in pre-labeled centrifuge tubing (volume 1.5 ml), 250 μl of lenvatinib (150.0 ng/ml) was mixed. The resultant sample mixtures were vortexed for 15 minutes, followed by employed for centrifugation at 15,000 rpm in a centrifuge kept at 4°C for 20 minutes. The upper layer of 150 μl was mixed with 150 μl of movable solvent and was processed for LC-MS/MS study by introducing 5.0 μl of analyte solution into LC-MS/MS API4000 system (Ingelse et al., 2014).
Protocol for calibration and QC standards
The analyte and IS stock sample solutions were processed in a movable solvent at the concentration of 1,000 μg/ml. The primary stock was diluted with the mobile phase to process calibration standards over concentration limits utilizing the movable phase. These solutions were then spiked with plasma blank to attain linearity standard solutions between 39 and 1,576.0 ng/ml (Zhang et al., 2000). Likewise, the QC standards were processed by utilizing analyte stock solution to get concentration levels of 110, 788, and 1,182 ng/ml in blank plasma, which represents low (LQC), median (MQC), and high QC (HQC) standards.
The lenvatinib primary stock (1,000 μg/ml) solution was diluted with a movable solvent to process working standards of 150 ng/ml. All the analyte and lenvatinib solutions were stored at 2.0°C–8.0°C (Jemal et al., 2000). The hiked plasma sample (QCs and linearity standards) solutions were warehoused either at −70.0°C and/or −20.0°C till usage.
Validation of the analytical method
For the developed procedure, method validation was processed based on European Medicines Agency (EMA) and Food and Drug Administration (FDA) bioanalytical method validation (Buhrman et al., 1996; Cheng et al., 2001). The acceptance criteria as provided in the guidelines were followed for all experiments.
Selectivity and specificity
Interfering of peaks at retaining times of the drug and lenvatinib were inspected by analyzing six dissimilar lots of plasma blank and single hemolyzed plasma lot (Meunier et al., 2015). The sample solutions were evaluated by LC/MS/MS to estimate the level of plasma endogenous constituents that separate at retaining times of the analyte and IS.
At an LLOQ concentration of 39 ng/ml, the method’s ability to be selective was tested. Samples of plasma were taken from six different lots of interference-free blank plasma that had been spiked at the LLOQ concentration. In these samples, the signal-to-noise ratio was found by comparing the mean baseline noise near the retention time of the analyte to the peak response of LLOQ.
Calibration curve
Analyte linearity in extracted plasma sample was proven utilizing eight non-zero linearity standard solutions in between 39 and 1,576 ng/ml (39, 90, 180, 370, 650, 950, 1,250, and 1,576 ng/ml) (Hughes et al., 2009). The peak response ratio of the linearity standard solutions was plotted against nominal concentration levels and rectilinear graphs were fixed utilizing a regression line with 1/concentration weighting factor.
Carryover
Carryover of the drug was assessed by infusing ULOQ standard extract instantly prior to plasma blank extract (Cheng et al., 2001). Drug/IS carryover was determined as the %peak response at drug/IS retaining time in blank standard to that of drug/IS peak response in LLOQ level.
Accuracy and precision (A&P)
A&P of the technique was estimated by evaluating six duplicates of QC standards for drugs in plasma (three lots include ruggedness) (Buhrman et al., 1996; Meunier et al., 2015). Each A&P lot consists of blank standard, zero standard, linearity curve standard solutions and a total of 24 hiked QC standards (6 replicas of each LLOQ—39 ng/ml, LQC—110 ng/ml, MQC—788 ng/ml and HQC—1,182 ng/ml sample). Intraday and interday A&P were estimated.
Recovery
Recovery of larotrectinib at the LQC (110 ng/ml), MQC (788 ng/ml) and HQC (1,182 ng/ml) levels were assessed by equating the average response of six replica infusions of plasma extract sample solutions with the respective average response from six infusions of neat samples.
Integrity of dilution
The integrity of dilution is checked to make sure that study samples with concentrations above the ULOQ can be diluted without changing the A&P of the concentration. Before analyzing the samples, dilution QC stock (DQC, 6,000 ng/ml) was added to plasma and diluted 10 times with interference-free blank plasma. This made six copies of each DQC sample. The A&P lot was used to look at these DQC samples.
Matrix factor/effect
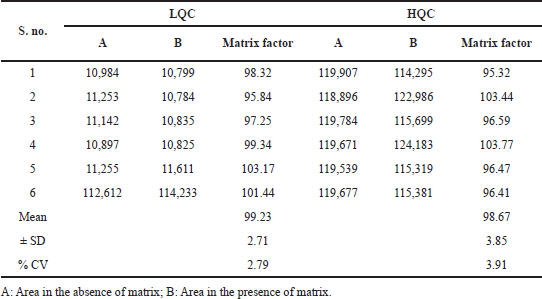
Matrix effect was the improvement or destruction of drug ionization due to matrix constituents in a plasma (Hugheset al., 2009). Matrix effectiveness was assessed at both LQC (110 ng/ml) and HQC (1,182 ng/ml) levels by associating the response fraction of six variable batches of post-blank plasma extract sample solutions against neat LQC and HQC. The %CV of the matrix factor was estimated.
Stability studies
The analyte stabilities (long-term, freeze-thaw, bench-top) in plasma were estimated by treating six replica of QC standards hiked at LQC (110 ng/ml), MQC (788 ng/ml) and HQC (1,182 ng/ml) concentration levels to variable temperature circumstances, freeze and thaw cycling and storage durations (Buhrman et al., 1996; Ingelse et al., 2014). These sample stabilities were evaluated against newly executed linear curve standard solutions and QCs. The findings were equated with nominal concentration, and percentage variations of concentrations were estimated.
Reproducibility of re-injection
To examine the reproducibility of the analysis of executed sample solutions after storing, the sample solutions from accepted A&P (Kulkarni et al., 2016a, 2016b) lot, kept at autosampler condition (10.0°C), were re-assessed after 66 hours.
Pharmacokinetic assessment
Six healthy white rabbits of both sexes weighing 2–3 kg served as the study’s participants. According to animals were kept at RH 45%, 25°C with 12 hours of alternate light and dark cycles, and 100% fresh air exchange. Water and normal food were given to the rabbits. Blood samples (0.6 ml) were taken from the marginal ear vein after oral administration of 12.5 mg of larotrectinib at frequencies of 0, 0.5, 1, 5, 10, 15, 20, 25, and 24 hours (Patel et al., 2011). Blood samples were taken at predetermined intervals until 24.0 hours after delivery and placed in polypropylene tubes with an ethylene diamine tetra acetic acid solution. The plasma was separated from the sample by centrifuging it at 6,000 rpm for 10 minutes and storing it at −20.0°C. About 10 μl of plasma samples were put into an LC-MS/MS system, and Win Nonlin 03.30® software (Pharsights Mountain Views, CA, USA) was used to analyze non-compartmental method data to assess the pharmacokinetic restrictions.
RESULTS AND DISCUSSION
Protocol for sample processing
The LLE technique has opted for sample processing based on the physicochemical parameters of the drug. Nevertheless, to improvise the effectiveness of extracting the drug, sonication as an extra stage was encompassed for the duration of the sample processing step. Sonication ensures the complete solubilization of the drug in extracting phase. The technique exhibited consistent and reproducible recoveries at all stages of assessment.
Chromatographic conditions
Several mobile solvent systems and stationary columns were scrutinized to confirm maximum sensitivity and to decrease interfering components from endogenous constituents at the drug and IS retention timings. The selected C18-Phenominex reverse phase (2.1 × 50 mm, 1.70 μ) column exhibited selectivity and excellent stability to attain separation from the matrix constituents. Analyte elution was accomplished with an isocratic system of solvents having ACN, methyl alcohol, and 0.1% formic acid in the ratio of 50:30:20%V/V/V. The mobile system was monitored at a flow of 0.60 ml/minute. The optimized chromatographic technique attained suitable peak response, sensitivity, and without matrix interference for drug/IS with a shorter run time. Lenvatinib was carefully chosen as IS, established on its similarity conditions to the analyte and its similarity retaining times at optimized chromatography conditions.
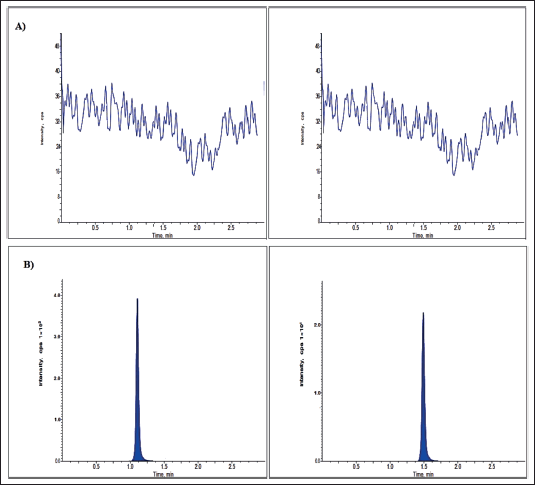 | Figure 2. Larotrectinib chromatograms for (A) blank and (B) LLOQ. [Click here to view] |
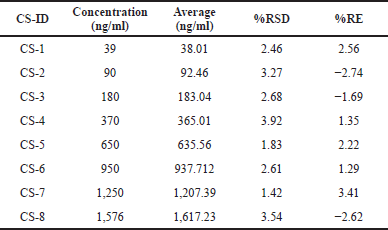 | Table 1. Eight linearity standard solutions of larotrectinib. [Click here to view] |
Mass system
The drug and the IS were evaluated easily by the +ve electrospray ionization technique, based on the chemistry of functional groups on the analytes. The mass systems constraints such as nebulizer gas, spray voltage, collision energy, collision gas, capillary temperature, and curtain gas were adjusted to attain maximum signal. System suitability estimated at a higher linearity standard, earlier to starting validation studies on every day was less than 2.0% and the retention timings of drug and IS were reproducible in every analytical run.
Selectivity and specificity
No significant interfering peaks were detected at the retaining timings of an assessed drug and IS for six variable plasma lot samples, indicating the specificity of the developed technique. The typical chromatograms of LLOQ and blank solutions were revealed in Figures 2 and 3.
Calibration curve
The linearity plot for the eight nonzero calibration solutions between 39 and 1,576 ng/ml fitted with 1/concentration2 weighting factor was rectilinear. The back-calculation was utilized for the determination of calibration standard concentrations, shown in Table 1. The regression coefficient value of >0.99 indicates the linearity of the method.
Precision and accuracy
For the QC samples, the average concentration was within 15% of the nominal value, except for the LLOQ, where the findings were within 20.0% of the nominal value for both samples taken within and between runs. Also, the CV (%) value for the QC samples was less than 15%, except for the LLOQ, which is less than 20% both within and between runs (Table 2).
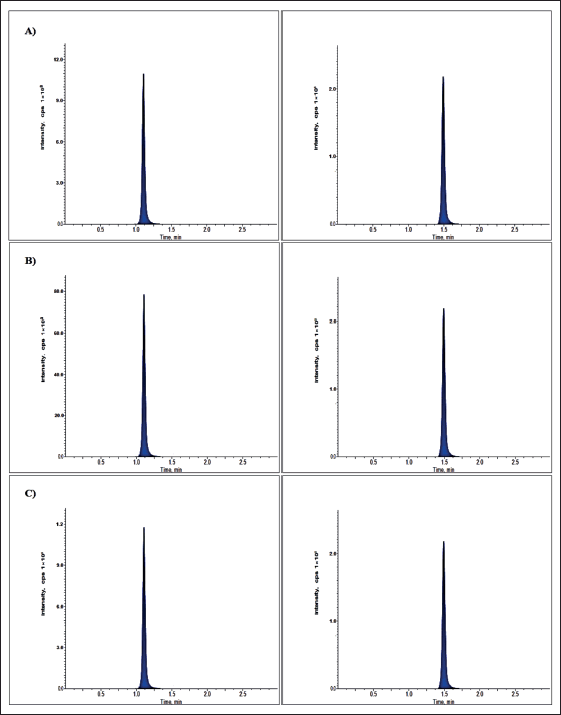 | Figure 3. Larotrectinib chromatogram at (A) LQC, (B) MQC, and (C) HQC levels. [Click here to view] |
The findings of larotrectinib extracted recovery study of plasma solution was represented in Table 3. The efficiency of the extraction technique was measured as an average recovery percentage for the drug and IS at three standard concentrations (low—110 ng/ml, medium—788 ng/ml, and high—1,182 ng/ml). The average recovery was 98.91% (95.34%–102.39%) for the analyte and 99.06% for lenvatinib at 150 ng/ml.
Carryover
It was assessed for the drug and IS at their individual retaining times in carryover blank (reinfused blank solution) which was infused instantaneously after infusing higher calibration standard level. The percentage of carryover observed was <1.0% and it will be within the acceptable range of 20%. The peak response in the blank solution was less than 5.0% of the peak response in the LOQ level.
Integrity of dilution
Experiments on dilution integrity were done by diluting QC standards that were beyond the calibration range. This showed that sample solutions can be made dilution up to 10 times and still be accurately measured. The set of diluted QC samples was accurate and precise enough to be used.
Stability studies
The findings of plasma stability data were represented in Table 4. The timings for storage in the table were the longest time intervals, tested that were accurate enough to meet the ±15% acceptance limit. Larotrectinib was stable in samples taken from plasma spiked at LQC, MQC, and HQC standards at room (bench-top) temperature for approximately 24 hours, with a mean percentage of over 95.92%. Freeze and thaw stability was evaluated after five cycles with a mean percentage above 96.98%. Long-term stability was evaluated for 24 days at −20°C and −70°C with mean percentage values between 95.37% and 98.45%.
 | Table 2. Intrabatch and interbatch A&P. [Click here to view] |
 | Table 3. Recovery values of larotrectinib in plasma samples. [Click here to view] |
 | Table 4. Stability studies of larotrectinib. [Click here to view] |
 | Table 5. Findings for larotrectinib matrix factor. [Click here to view] |
 | Figure 4. Larotrectinib plasma-time profile in rabbits. [Click here to view] |
 | Table 6. Plasma concentration at various time intervals of six rabbits (subject). [Click here to view] |
Matrix factor/effect
The matrix factor was within the limit of ±15% and the findings proposed that the matrix components from the plasma were not showing any kind of changes in the analyte or IS response in the final chromatogram. The matrix factor findings at LQC and HQC standards were represented in Table 5.
Pharmacokinetics in rabbits
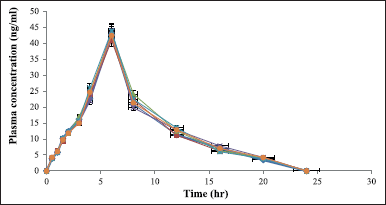
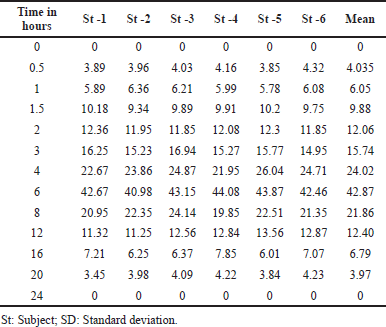
The research used rabbits as participants, and Table 6 and Figure 4 demonstrate the plasma levels of larotrectinib post-oral delivery versus a time interval curve. The outcomes of rabbit kinetics produced the Tmax and Cmax of 5.99 ± 0.09 and 42.87 ± 1.02?ng/ml, correspondingly (Table 7). The AUC0→last and t1/2 outcomes were 314.75 ± 7.51?ng. hour/ml and 5.08 ± 0.14, individually. The established approach was successfully used to investigate the pharmacokinetics of larotrectinib in the biological matrices for future studies.
| Table 7. Pharmacokinetics data of rabbits (subject). [Click here to view] |
CONCLUSION
A linear LC-MS/MS process for the quantitation of larotrectinib was developed in human plasma and validated as per the EMA and FDA guidelines. The findings of matrix factor at LQC and HQC levels were less than 3.91 (%CV). The average recovery value was 98.91% (95.34%–102.39%) for the analyte. Larotrectinib was stable in plasma spiked at LQC, MQC, and HQC standards at room temperature (bench-top) for about 24 hours with a mean percentage above 95.92%. Freeze and thaw stability was evaluated after five cycles with a mean percentage above 96.98%. Long-term stability was evaluated for 24 days at −20°C and −70°C with mean percentage values between 95.37% and 98.45%. The outcomes of rabbit kinetics produced the Tmax and Cmax of 5.99 ± 0.09 and 42.87 ± 1.02?ng/ml, correspondingly. The AUC0→last and t1/2 outcomes were 314.75 ± 7.51?ng. hour/ml and 5.08 ± 0.14, individually. The established approach was successfully used to investigate the pharmacokinetics of larotrectinib in the biological matrices for future studies.
AUTHOR CONTRIBUTIONS
All authors made substantial contributions to the conception and design, acquisition of data, or analysis and interpretation of data; took part in drafting the article or revising it critically for important intellectual content; agreed to submit to the current journal; gave final approval of the version to be published; and agree to be accountable for all aspects of the work. All the authors are eligible to be an author as per the International Committee of Medical Journal Editors requirements/guidelines.
FUNDING
There is no funding to report.
CONFLICTS OF INTEREST
The authors report no financial or any other conflicts of interest in this work.
ETHICAL APPROVALS
The institutional animal ethics committee gave the rabbit research approval under the following number: 1447/PO/Re/S/11/CPCSEA-58/A.
DATA AVAILABILITY
All data generated and analyzed are included in this research article.
PUBLISHER’S NOTE
This journal remains neutral with regard to jurisdictional claims in published institutional affiliation.
REFERENCES
Attwa MW, Kadi AA, Darwish HW. Metabolic stability assessment of larotrectinib using liquid chromatography-tandem mass spectrometry. Drug Des Dev Ther, 2020; 14:111–19.
Berger S, Martens UM, Bochum S. Larotrectinib (LOXO-101). Recent Results Cancer Res, 2018; 211:141–51.
Buhrman DL, Price PI, Rudewiczcor PJ. Quantitation of SR 27417 in human plasma using electrospray liquid chromatography- tandem mass spectrometry: a study of ion suppression. J Am Soc Mass Spectrom, 1996; 7(11):1099–05.
Chae YJ, Song YK, Chae SH, Kim MJ, Kang JS, Lee JY, Koo TS, Lee KR. Development and validation of an LC-MS/ MS method for monitoring larotrectinib, a tropomyosin-related kinase inhibitor, in mouse and human plasma and application to pharmacokinetic studies. J Anal Sci Tech, 2020; 11:20.
Cheng Y, Lu Z, Neue U. Ultrafast liquid chromatography/ultraviolet and liquid chromatography/tandem mass spectrometric analysis. Rapid Commun Mass Spectrom, 2001; 15(2):141–51.
Doebele RC, Davis LE, Vaishnavi A, Le AT, Estrada-Bernal A, Keysar S, Jimeno A, Varella-Garcia M, Aisner DL, Li Y, Stephens PJ, Morosini D, Tuch BB, Fernandes M, Nanda N, Low JA. An oncogenic NTRK fusion in a patient with soft-tissue sarcoma with response to the tropomyosin-related kinase inhibitor LOXO-101. Cancer Discov, 2015; 5(10):1049–57.
Drilon A, Nagasubramanian R, Blake JF, Ku N, Tuch BB, Ebata K, Smith S, Lauriault V, Kolakowski GR, Brandhuber BJ, Larsen PD, Bouhana KS, Winski SL, Hamor R, Wu WI, Parker A, Morales TH, Sullivan FX, DeWolf WE, Wollenberg LA, Gordon PR, Douglas-Lindsay DN, Scaltriti M, Benayed R, Raj S, Hanusch B, Schram AM, Jonsson P, Berger MF, Hechtman JF, Taylor BS, Andrews S, Rothenberg SM, Hyman DM. A next-generation TRK kinase inhibitor overcomes acquired resistance to prior TRK kinase inhibition in patients with TRK fusion-positive solid tumors. Cancer Discov, 2017; 7(9):963–72.
Fatim M, Koneru A, Khan MMA, Varanasi MB, Syed IP. Development and validation of stability indicating RP-HPLC method for estimation of larotrectinib in its formulations. Orient J Chem, 2020; 36(2):327–33.
Fuse MJ, Okada K, Oh-Hara T, Ogura H, Fujita N, Katayama R. Mechanisms of Resistance to NTRK inhibitors and therapeutic strategies in NTRK1-rearranged cancers. Mol Cancer Ther, 2017; 16(10):2130–43.
Gong Z, Chandler K, Webster S, Kerley R, Buist S, McCortTipton M. Simple and rapid determination of norethindrone in human plasma by supported liquid extraction and ultra-performance liquid chromatography with tandem mass spectrometry. Talanta, 2012; 91:77–82.
Hughes NC, Bajaj N, Fan J, Wong EYK. Assessing the matrix effects of hemolyzed samples in bioanalysis. Bioanalysis, 2009; 1(6):1057–66.
Ingelse B, Barroso B, Gray N, Jakob-Rodamer V, Kingsley C, Sykora C, Vinck P, Wein M, White S. European bioanalysis forum: recommendation on dealing with hemolyzed and hyperlipidemic matrices. Bioanalysis, 2014; 6(23):3113–20.
Jemal M, Ouyang Z. The need for chromatographic and mass resolution in liquid chromatography/tandem mass spectrometric methods used for quantitation of lactones and corresponding hydroxy acids in biological samples. Rapid Commun Mass Spectrom, 2000; 14(19):1757–65.
Kulkarni RM, Bhamare VS, Santhakumari B. Oxidative transformation of antiretroviral drug zidovudine during water treatment with permanganate: reaction kinetics and pathways. Des Water Treat, 2016a; 57(52):24999–010.
Kulkarni RM, Bhamar VS, Santhakumari B. Mechanistic and spectroscopic investigations of Ru3+-catalyzed oxidative degradation of azidothymidine by heptavalent manganese at environmentally relevant pH. Des Water Treat, 2016b; 57(58):28349–62.
Meunier C, Blondelle D, Faure P. Development and validation of a method using supported liquid extraction for aldosterone determination in human plasma by LC–MS/MS. Clin Chim Acta, 2015; 447:8–15.
Patel DS, Sharma N, Patel MC, Patel BN, Shrivastav PS, Sanyal M. Development and validation of a selective and sensitive LC–MS/MS method for determination of cycloserine in human plasma: application to bioequivalence study. J Chromatogr B Anal Technol Biomed Life Sci, 2011; 879:2265–73.
Sparidansa RW, Wangc Y, Schinkel AH, Schellensa JHM, Beijnen JH. Quantitative bioanalytical assay for the tropomyosin receptor kinase inhibitor larotrectinib in mouse plasma and tissue homogenates using liquid chromatography-tandem mass spectrometry. J Chromatogr B, 2018; 1102–3:167–72.
Vaishnavi A, Le AT, Doebele RC. TRKing down an old oncogene in a new era of targeted therapy. Cancer Discov, 2015; 5(1):25–34.
Zhang N, Hoffman KL, Li W, Rossi DT. Semi-automated 96- well liquid-liquid extraction for quantitation of drugs in biological fluids. J Pharm Bio Anal, 2000; 22(1):131–8.