INTRODUCTION
Oxalate, which comes from a variety of plant and animal sources and is primarily removed via the kidneys, is the ionic form of oxalic acid. A metabolic disease called hyperoxaluria is characterized by an elevated excretion of oxalate through the urine. Healthy people typically excrete between 10 and 40 mg of oxalate every 24 hours. Clinical hyperoxaluria is defined as concentrations that are greater than 40–45 mg per 24 hours [1–3]. This may be the result of greater intestinal absorption or improved ingestion of precursors of oxalate in hyperoxaluria due to secondary causes or increased endogenous oxalate synthesis in primary hyperoxaluria.
If not treated properly, end-stage renal disease (ESRD), which can manifest in the sixth decade of life or as early as infancy, can result from hyperoxaluria, which has the potential to have devastating consequences [4]. Nephrocalcinosis, urinary tract infections, recurrent kidney stones, as well as chronic kidney disease (CKD) and end-stage renal disease, are among the variety of illnesses. Oxalate deposits in a number of organ systems are caused by elevated plasma oxalate levels. Although systemic oxalosis should be prevented, more than 40% of patients experience a diagnostic delay. As per the survey by Hoppe et al. [5], 30% of the subjects were only diagnosed after they had already developed ESRD. When the disease reappears after a kidney transplant, the diagnosis may occasionally be made for the first time [6]. A great index of doubt and a prompt diagnosis are necessary for the proper treatment of hyperoxaluria, which is still a difficult condition to manage.
Increased urinary oxalate excretion characterizes the disease known as hyperoxaluria. When oxalate intake is increased, its precursors are consumed more frequently, or the gut flora is altered, and secondary hyperoxaluria develops. An inherited defect in the metabolism of oxalate is primary hyperoxaluria. These illnesses can cause nephrocalcinosis, recurring kidney stones, and ultimately end-stage renal disease. Despite these similarities, each subtype of hyperoxaluria has a unique pathophysiology, clinical presentation severity, and therapeutic strategy.
Early clinical diagnosis and differentiation of these illnesses are crucial for timely intervention and have an impact on the prognosis of individuals with hyperoxaluria.
Renal damage and inflammation brought on by hyperoxaluria brought on by calcium oxalate (CaOx) crystal deposition in the kidneys results in a range of illnesses, including CKD. However, it has been unable to distinguish between the renal effects of CaOx crystal deposition and hyperoxaluria. Joshi et al. [7] used the ethylene glycol (EG) model, which allows the timing of both hyperoxaluria and the formation of CaOx crystals.
To test this theory, male rats were given EG to induce hyperoxaluria. Rats were then killed, and kidneys were removed on days 14 and 28 when all of the animals had acquired renal CaOx crystal deposits. Total ribonucleic acid (RNA) was gathered to conduct microarray and genome-wide analysis, aiming to identify differentially expressed genes (DEGs) and compare the variations between hyperoxaluria and kidney changes induced by crystals.
Aim
To use microarray data (deposited by the author Joshi et al. [7]) for bio-informatic analysis to find DEGs that are associated with renal impairment in the hyperoxaluric stage as compared to oxalate crystal formation stage as compared to that in normal controls. The study also aimed to study gene enrichment, gene ontology (GO), KEGG pathway improvement, protein collaboration protein–protein interaction (PPI) organizations, and miRNA-target quality cooperation organizations to learn more about the underlying molecular mechanisms of hyperoxaluria as compared to oxalate crystal formation stage.
METHODOLOGY
Microarray data
Chips, high-throughput microarrays, and data on gene expression can all be found in the public and functional genomics database known as the Gene Expression Omnibus. The GSE89028 microarray data were downloaded https://www.ncbi.nlm.nih.gov/geo/ for evaluation in this study. This dataset was deposited by Joshi et al. [7]. There were three groups of male rats in the study (imp), one being the control group, the other one administered with EG, and the third group on EG and spironolactone (ES). All the groups were investigated on days 14 and 28 for gene expression patterns by microarray analysis.
Data processing
To process raw data and screening DEGs, the statistical software R4.0.1 (https://www.r-project.org/) and a Bioconductor (http://bioconductor.org/biocLite.R) were utilized. The Limma package was used to calibrate and standardize the data in batches. The fundamental aspect of the Limma package is to apply a linear model to gene expression data to assess its potential for differential expression [8]. Reading, standardizing, and analyzing such data is made easy with the Limma package’s powerful tools. A Limma package was then used to filter the genes with different levels of expression. The fold-change and p-value of less than 0.05 were the screening criteria. The DEGs were displayed on a volcano map using the ggplot2 package, and the significant DEGs were clustered using the heatmap package.
Evaluation of enrichment of pathways and function of DEGs
The Gene Ontology [http://www.geneontology.org], a resource for bioinformatics that is based on the community was used. It uses ontology to expand our understanding of biology and provides information about the functions of genes and gene products [9]. An information base for the subjective translation of genomic successions and other natural information, the Kyoto Encyclopedia of Genes and Genomes (KEGG) (https://www.kegg.jp/) includes information about systematic, genomic, chemical, and a supplementary human-specific categories of health information [10]. The GO/KEGG enrichment and cluster Profiler software package were employed to examine the relevant signaling pathways and biological functions. A p-value equal to or greater than 0.05 is deemed statistically significant in the analysis.
Building a network of PPIs and identifying and confirming hub genes
PPI network analysis significantly enhances the prediction of protein functions and their interactions. This valuable tool helps researchers gain insights into cellular and disease mechanisms [11,12]. The STRING database (http://string-db.org) plays a vital role in this context by integrating a vast amount of known and predicted protein–protein association data, offering a comprehensive evaluation of protein interactions [13,14]. The obtained PPI network, constructed using the STRING database, can be visualized in Cytoscape. Additionally, the cytohubba module of the Cytoscape programming was utilized to separate center qualities with a higher score in this investigation, indicating that these genes are more connected to PPI networks. The statistical significance of these genes was confirmed using GEO2R, an interactive network tool that enables users to compare two or more sets of samples in a GEO sequence to identify DEGs [15]. It was deemed statistically significant if p < 0.05.
MicroRNA (miRNA)-target gene network
A type of small endogenous non-coding RNA known as miRNA has between 18 and 25 nucleotides. At the post-transcriptional levels, it is the primary central regulator. It is involved in numerous biological processes, including apoptosis, cell differentiation, and the cell cycle [16,17]. The miRDB, DIANA, and TargetScan database contain detailed metadata, experimental methods, and conditions, as well as manually managed and experimentally validated interactions between genes and miRNAs [18]. These databases were used to construct the miRNA–gene targeting relationship for overlapping differential genes and hub genes.
RESULTS
A total of 62,966 genes were screened, 2,814 were differentially expressed, out of which 603 genes were statistically significantly differentially expressed, after analyzing the GSE89028 dataset (Fig. 1a). A total of 2,810 genes were downregulated and only 4 genes were upregulated on day 14.
A volcano plot visually presents the relationship between statistical significance (expressed as −log10 p-value) and the magnitude of change (log2 fold change) in gene expression. It serves as a valuable tool for visualizing and identifying DEGs. GSE89028 was used to screen DEGs (upregulated and Generated using Limma).The genes Cdt1 and cdhr4 were highly significantly differentiated with log2 (fold change) being −3.085 and −3.966 respectively, −log 10 (p-value) being 6.857 and 6.196, respectively, at 14 days.
On day 28, 62,976 genes were screened, out of which 356 were significantly differentiated (Fig. 1b). EGR2 and DIO3 were highly expressed with a false discovery rate (FDR) of 0.0156 and 817 fold enrichment. Only four genes were upregulated and 240 genes were downregulated. Csmd1, Olr154, Cntfr, and Zbtb16 log2 (fold change) being 1.188, 1.527, 1.782, and 2.636, respectively; −log 10 (p-value) being 4.071, 3.804, 4.357, and 4.061, respectively. At a cutoff (by default) of an adjusted p-value was 0.05, genes that are highlighted exhibit significant differential expression (red indicates upregulation and blue indicates downregulation).
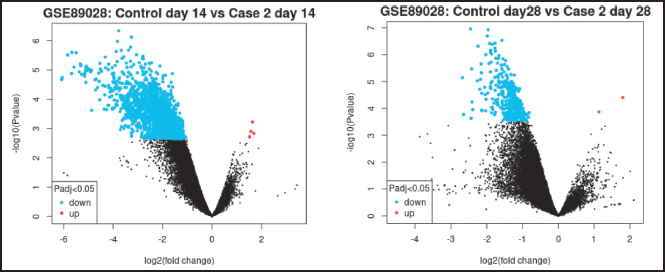 | Figure 1. (a) Volcano plot on the 14th day. (b) Volcano plot on the 28th day. [Click here to view] |
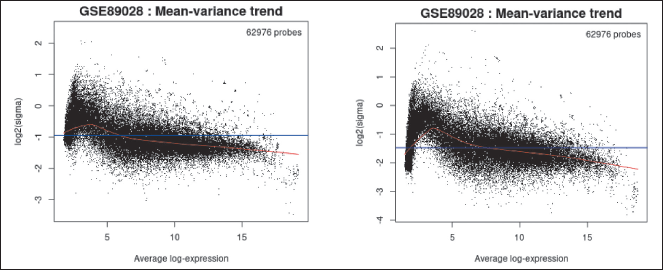 | Figure 2. (a) MD on the 14th day. (b) MD on the 28th day. [Click here to view] |
Data points beyond 1 imply ratio of means is higher than 2 fold or more. Points on the negative log imply half fold increase. p-values become smaller and smaller with increasing significance. The top upper two quadrants are significant.
The log2 fold change in contrast to the average log2 expression value is shown in a mean difference (MD) plot (Fig 2a and b) created with Limma (plotMD), which helps demonstrate DEGs.
A mean distinction plot shows the test results for a solitary difference and compares the disagreement or differences between two quantitative measurements, i.e., the expression of genes. Blue lines suggest MD, being −0.9 and −1.5, respectively, on days 14 and 28. Red lines indicate ±1.96 standard deviations from MD.
Limitation
Plotting data for up to five contrasts is possible. When more than five groups have been identified, the default action is to display contrasts between the genes with the highest and lowest expression numbers.
R boxplot was used to generate the boxplot (Fig. 3a and b). It was used to see the distribution of the values of the selected samples. The samples are arranged in groups by color. To know if the Samples chosen are suitable for differential expression analysis, taking a look at the distribution can be helpful. In most cases, values that are centered on the median indicate that the data can be cross-comparable and normalized.
The plot shows data after log transform and normalization, if they were performed.
Expression density plot (Fig. 4a and b), made with R Limma (plotDensities), to see how the values of the selected samples are distributed. The samples are arranged in groups by color. In checking for data normalization prior to differential expression analysis, this plot works in tandem with the boxplot above.
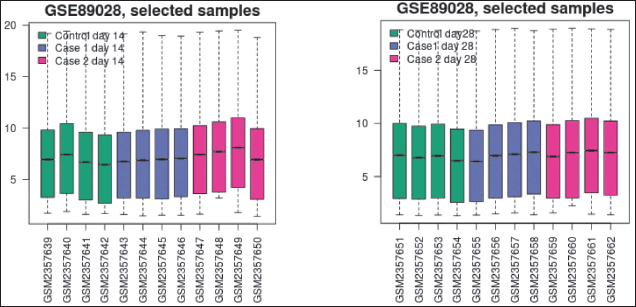 | Figure 3. (a) Box plot on the 14th day. (b) Box plot on the 28th day. [Click here to view] |
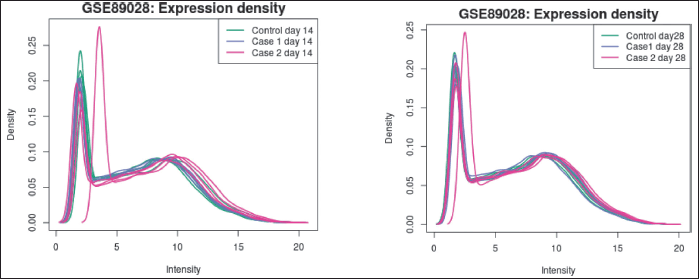 | Figure 4. (a) Expression density plots on the 14th day. (b) Expression density plots on the 28th day [Click here to view] |
Histogram (Fig. 5)—Created with hist—used to see how the distribution of p-values in the analysis results. All selected contrasts were used to calculate the p-value, which is identical to that in the top DEGs table.
Moderated t-statistic quantile–quantile plot; q–q plot (Fig. 6)—produced with the help of Limma, qqt plots a data sample’s quantiles against the theoretical quantiles of a Student’s t distribution. The quality of the Limma test results can be evaluated using this plot.
Following the application of a linear model, an R Limma function (plotSA, vooma) is utilized to generate a mean-variance plot, which serves to validate the correlation between the mean and variance of the expression data. It may be helpful to demonstrate that there is a lot of variation in the data. This graph helps in evaluating whether it is advisable to utilize the precision weights option to address the mean-variance trend. When a significant mean-variance trend exists, employing precision weights enhances the reliability of the test outcomes.
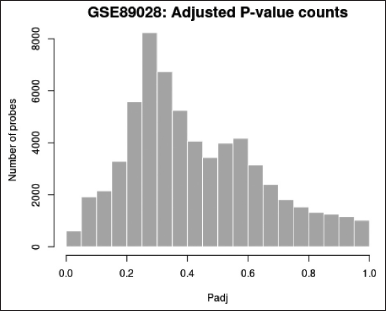 | Figure 5. Histogram for p-value distribution. [Click here to view] |
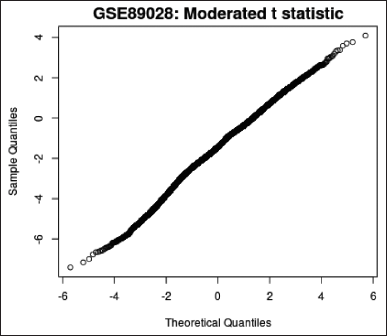 | Figure 6. q–q plot. [Click here to view] |
Each point in the plot represents a gene. The red line depicts the mean-variance trend approximation, which considers or has already considered the precision weight option from the Options tab during the analysis of differential gene expression. On the other hand, the blue line represents an approximation of constant variance.
Generated with the help of Uniform Manifold Approximation and Projection (UMAP), UMAP (Fig. 7a and b) is a useful method for reducing the number of dimensions and making it easier to see how Samples are related to one another. It reduces the data to two dimensions. The plot shows how many closest neighbors were used in the calculation.
By utilizing the Limma algorithm (Venn diagram) (Fig 8a and b) to browse and download the substantial gene overlap between various contrasts Venn diagram is plotted. Out of 2,812 genes, 2 genes were common between cases on EG and cases both on EG and spironolactone. There were no common genes expressed between other groups.
In contrast to day 14, 129 genes were common for controls of cases on EG and cases on both EG and spironolactone, 2 genes each for controls compared to cases on EG and cases on both EG and spironolactone on day 28.
The top 10 genes expressed at days 14 and 28 along with their associated miRNA s are represented in Tables 1 and 2, respectively.
Based on GO enrichment analysis, the gene association displayed a strength of 0.91, and the FDR was 0.0373. The genes showed enrichment in various pathways, including the mitogen-activated protein kinase signaling pathway, the PI3K-Akt pathway, the RAP 1 signaling pathway, the cyclic adenosine monophosphate signaling pathway, and multiple metabolic pathways. Additionally, biological processes such as the intrinsic apoptotic signaling pathway responding to DNA damage, signal transduction by p53, with FDR values ranging from 0.018 to 0.0259 and a strength of 1.58 to 2.0. Cellular component enrichment revealed the transcription regulator complex with a strength of 0.91 and an FDR of 0.0373.
On day 14, a total number of nodes were 9, a number of edges 2 (versus projected number zero), the average local clustering coefficient was 0.22, the average node degree was 0.44, and the PPI enrichment p-value was 0.0738 in the string database analysis (Fig. 9). The strength of cellular enrichment (condensed chromosome kinetochore) was 1.85 with a false discovery rate of 0.0160.
In contrast, on day 28, observed nodes were 7, edges 1 (versus 0), the average node degree, as well as average local clustering coefficient, was 0.286, PPI enrichment p-value being 0.11 (Fig. 10).
The network’s nodes are proteins. The edges represent the hypothesized functional relationships. Seven colored lines were used to draw an edge in evidence mode; The following lines denote the presence of the seven distinct types of evidence that were taken into account when anticipating the relationships. The red line indicates the presence of fusion evidence, neighborhood evidence in green, co-occurrence evidence in blue, experimental evidence in purple, text mining evidence in yellow, database evidence in light blue, and co-expression evidence in black. As only yellow lines were observed on days 14 and 28, only text mining evidence was observed. The strength of alternative splicing (cellular enrichment) was 1.16 with an FDR (false discovery rate) of 0.0409.
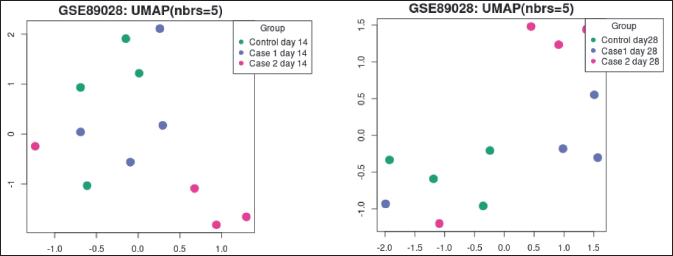 | Figure 7. (a) UMAP plot at day 14. (b) UMAP plot at day 28. [Click here to view] |
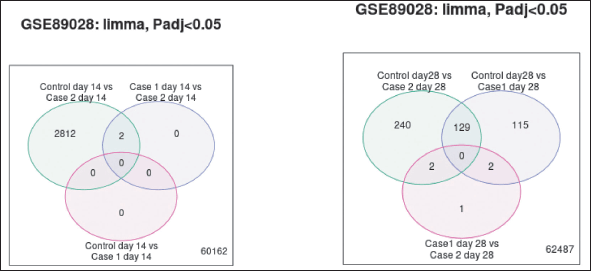 | Figure 8. (a) Venn diagram comparing DEGs on day 14. (b) Venn diagram comparing DEGs at day 28. [Click here to view] |
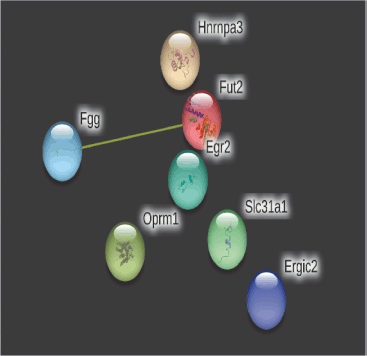 | Figure 9. PPIs of top 10 genes on day 14. [Click here to view] |
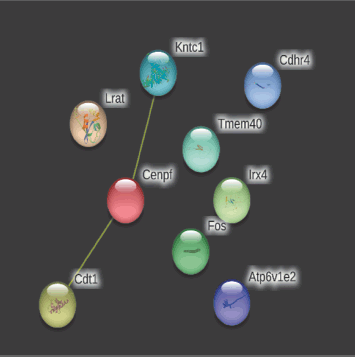 | Figure 10. PPIs of top 10 on day 28 [Click here to view] |
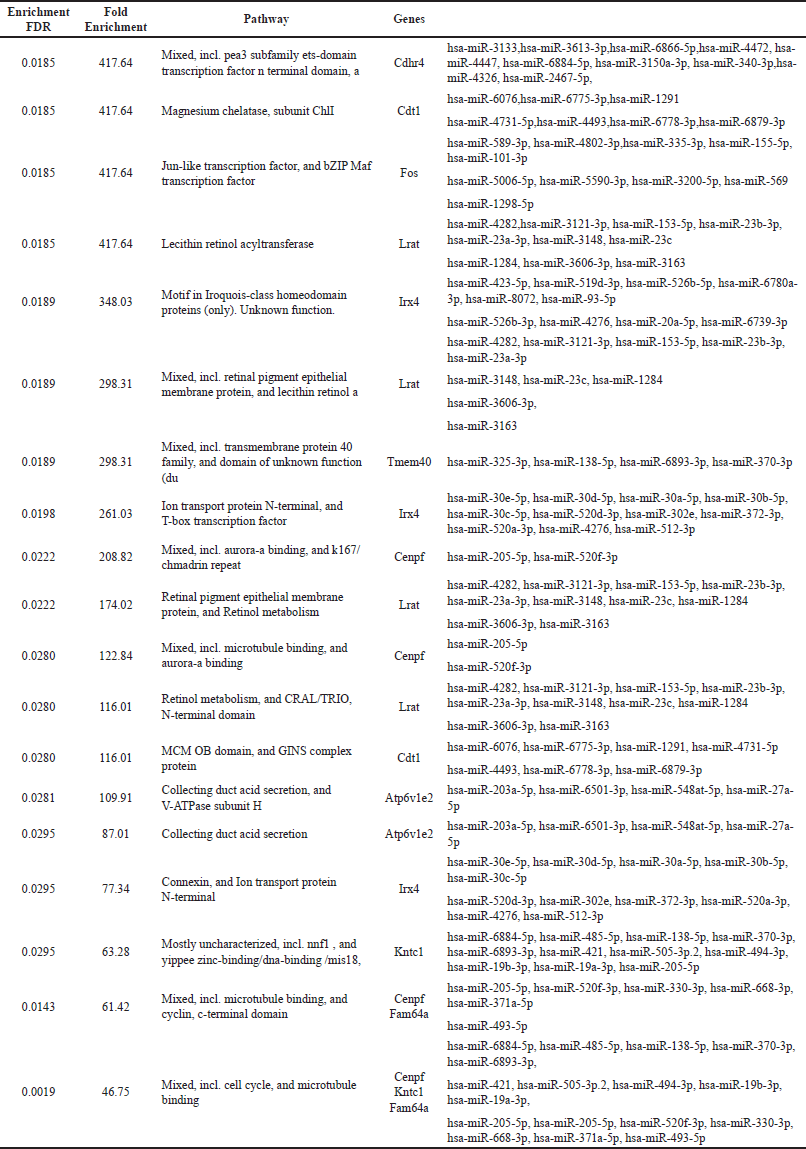 | Table 1. Enrichment of top 10 genes and their associated miRNAs on day 14. [Click here to view] |
The biological, and molecular enrichment processes were statistically insignificant. The predicted network includes only interactions with confidence scores that are higher than the lowest needed interaction score. Lower scores are associated with higher levels of engagement but lower false positive rates. The confidence score indicates the likelihood that a predicted association between two metabolic pathway proteins in the database actually exists. Limitations of confidence include: low confidence—at least 0.15; 0.4, medium confidence; 0.7; high confidence; the lowest level of confidence: 0.9
Microarrays are a powerful high-throughput technology that allows for a comprehensive examination of the genome’s expression levels and the detection of gene expression changes without making any assumptions. Over the last decade, microarrays have been extensively employed in various studies to identify irregularities in gene expression associated with mental disorders. Apart from the hypothesis-driven approach that focuses on analyzing expression levels of specific candidate genes, transcriptomics research has the potential to uncover new biomarkers related to diverse mental illnesses. These biomarkers could prove valuable in developing innovative intervention strategies and implementing personalized medicine approaches.
PPIs are essential for predicting the function of target proteins and molecules’ drug-like properties. Some of the biological processes that are controlled by PPIs include the regulation of metabolic and developmental processes as well as interactions between cells [15]. Finding information about protein communications helps with the determination of remedial targets [18]. Studies have shown that proteins with more connections (hubs) include families of enzymes, transcription factors, and intrinsically disordered proteins [19,20]. PPIs, on the other hand, have more involved processes and a broader regulatory scope. To better comprehend their significance in the cell, it is necessary to recognize various interactions and determine their effects. One approach to analyzing PPIs is the in-silico approach. The fundamental interaction unit in STRING is the “functional association,” or link between two proteins that together contribute to a particular biological function. In the analysis, there were no significant gene co-expression, co-occurrence, or fusions for the gene. Table 2 displays the string database analysis’s findings.
In the study by Joshi et al. [7] by day 7, all rats administered EG developed hyperoxaluria, displayed a few crystal deposits on day 14 and had significant crystal deposition by day 28. Genes encoding NADPH Oxidases, macromolecular crystallization modulators, inflammasome activation genes, and osteogenic marker genes all showed significant changes in expression. The findings show significant differences between hyperoxaluria and renal alterations brought on by CaOx crystals. Inflammation and injury are mostly linked to crystal deposition, demonstrating the important function that crystal retention plays [7]. Microarray data analysis shows that the set of genes expressed differentially is different at 14 days (hyperoxaluric phase) compared to the same at 28 days (CaOx crystal deposition).
Ten miRNAs were the intersections of the projected miRNAs targeting these genes and the hub miRNAs identified by miRNA analysis. The interaction network identified two miRNAs, hsa-miR-6884-5p and hsa-miR-4653-5p, and the genes, CDHR4 and EGR2 as significant players at day 14 and day 28 respectively. These results helped to partially explain how dysregulated gene expressions influence the pathophysiology of hyperoxaluria is different from renal injury due to CaOx crystal deposition. Promising techniques include effective modifications of the miRNA-gene interactions in hyperoxaluria.
Since miRNAs can target over 60% of human genes, they are thought to play a significant and wide-ranging function in gene regulation [21,22]. According to prior research, miRNAs play important regulatory roles in the development, structure, and operation of the kidney, as well as in the regulation of fluid, electrolytes, acid-base balance, and blood pressure. They take part in pathogenic processes as well. In addition, serum and urine miRNA levels are generally stable regardless of storage conditions [23]. MiRNAs are unquestionably useful as kidney injury diagnostic and monitoring markers.
Oxalate-induced oxidative stress causes damage to cells, accompanied by renal deposition of CaOx crystals. Studies have highlighted the extensive functions of miRNAs (miRNAs) in various processes, including cellular responses to oxidative stress. According to Jiang et al.’s [24] study, miR-155-5p has been shown to promote kidney oxidative stress injury caused by oxalate and COM. Other studies have also indicated that certain miRNAs like miR-34a, miR-20b, and miR-30c can inhibit the adhesion or deposition of cell crystals both in vitro and in vivo [25,26]. Additionally, another study by Jiang et al. [24] revealed that the interaction between H19 and miR-216b contributes to renal tubular epithelial cell injury and oxidative stress injury induced by CaOx nephrocalcinosis through the HMGB1/TLR4/NF-κB pathway [27]. Similarly, miR-23 was found to decrease CaOx crystal deposition and kidney injury. Recent research demonstrated that nine miRNAs show different expression levels in the urine of CaOx patients compared to the normal population [28,29]. These findings collectively highlight the various roles played by miRNAs in the formation of CaOx stones.
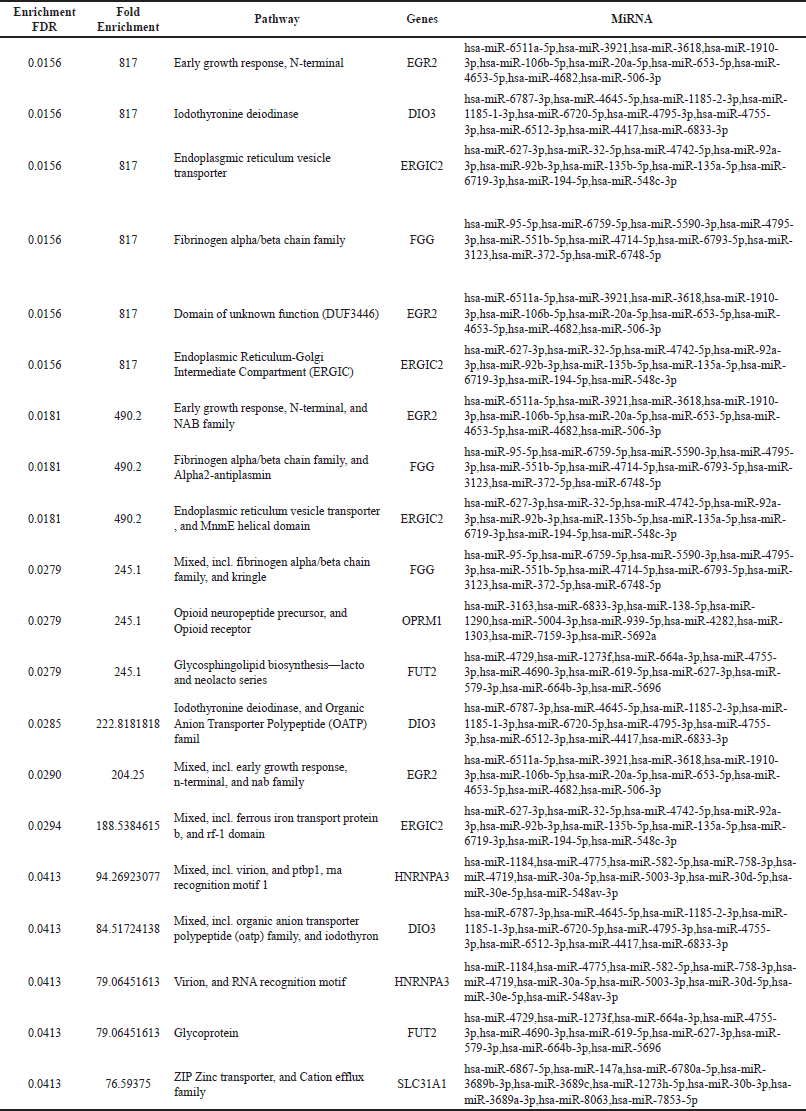 | Table 2. Enrichment of top 10 genes and their associated miRNAs on day 28. [Click here to view] |
CONCLUSION
The results have demonstrated the efficacy of bioinformatics exploration methods for screening prospective pathogenic genes and their causal mechanisms for kidney damage in the hyperoxaluric phase and crystal deposition phase. Microarray data analysis shows that the set of genes expressed differentially is different at 14 days (hyperoxaluric phase) compared to the same at 28 days (CaOx crystal deposition). The interaction network identified two miRNAs, hsa-miR-6884-5p and hsa-miR-4653-5p, and two genes CDHR4 and EGR2 as significant players. It was possible to accurately predict potential biomarkers of kidney damage for hyperoxaluria as well as the oxalate crystal deposition phase of the kidney, which may provide some promising targets for the treatment of hyperoxaluria.
AUTHOR CONTRIBUTIONS
All authors made substantial contributions to the conception and design, acquisition of data, or analysis and interpretation of data; took part in drafting the article or revising it critically for important intellectual content; agreed to submit to the current journal; gave final approval of the version to be published; and agree to be accountable for all aspects of the work. All the authors are eligible to be an author as per the international committee of medical journal editors (ICMJE) requirements/guidelines.
FINANCIAL SUPPORT
There is no funding to report.
CONFLICTS OF INTEREST
The authors report no financial or any other conflicts of interest in this work.
ETHICAL APPROVALS
This study does not involve experiments on animals or human subjects.
DATA AVAILABILITY
All data generated and analyzed are included in this research article.
PUBLISHER’S NOTE
This journal remains neutral with regard to jurisdictional claims in published institutional affiliation.
REFERENCES
1. Asplin JR. Hyperoxaluric calcium nephrolithiasis. Endocrinol Metab Clin North Am. 2002;31:927–49. CrossRef
2. Milliner DS. The primary hyperoxalurias: an algorithm for diagnosis. Am J Nephrol. 2005;25:154–60. CrossRef
3. Robijn S, Hoppe B, Vervaet BA, D’Haese PC, Verhulst A. Hyperoxaluria: a gut-kidney axis? Kidney Int. 2011;80:1146–58. CrossRef
4. Arena R, Cahalin LP. Evaluation of cardiorespiratory fitness and respiratory muscle function in the obese population. Prog Cardiovasc Dis. 2014;56:457–64. CrossRef
5. Hoppe B, Langman CB. A United States survey on diagnosis, treatment, and outcome of primary hyperoxaluria. Pediatr Nephrol. 2003;18:986–91. CrossRef
6. Spasovski G, Beck BB, Blau N, Hoppe B, Tasic V. Late diagnosis of primary hyperoxaluria after failed kidney transplantation. Int Urol Nephrol. 2010;42:825–29. CrossRef
7. Joshi S, Wang W, Khan SR. Transcriptional study of hyperoxaluria and calcium oxalate nephrolithiasis in male rats: inflammatory changes are mainly associated with crystal deposition. PLoS One. 2017;12(11):e0185009. CrossRef
8. Bhatt S, Gething PW, Brady OJ, Messina JP, Farlow AW, Moyes CL, et al. The global distribution and burden of dengue. Nature. 2013;496(7446):504–7. CrossRef
9. Guzman MG, Harris E. Dengue. Lancet. 2015;385(9966):453–65. CrossRef
10. Shahen M, Guo Z, Shar AH, Ebaid R, Tao Q, Zhang W, et al. Dengue virus causes changes of MicroRNA-genes regulatory network revealing potential targets for antiviral drugs. BMC Syst Biol. 2018;12(1):2. CrossRef
11. Tsai CY, Lee IK, Lee CH, Yang KD, Liu JW. Comparisons of dengue illness classified based on the 1997 and 2009 World Health Organization dengue classification schemes. J Microbiol Immunol Infect. 2013;46(4):271–81. CrossRef
12. Castro MC, Wilson ME, Bloom DE. Disease and economic burdens of dengue. Lancet Infect Dis. 2017;17(3):e70–e8.
13. Pei H, Zuo L, Ma J, Cui L, Yu F, Lin Y. Transcriptome profiling reveals differential expression of interferon family induced by dengue virus 2 in human endothelial cells on tissue culture plastic and polyacrylamide hydrogel. J Med Virol. 2016;88(7):1137–51. CrossRef
14. Biswal S, Reynales H, Saez-Llorens X, Lopez P, Borja-Tabora C, Kosalaraksa P, et al. Efficacy of a tetravalent dengue vaccine in healthy children and adolescents. N Engl J Med. 2019;381(21):2009–19. CrossRef
15. Moodie Z, Juraska M, Huang Y, Zhuang Y, Fong Y, Carpp LN, et al. Neutralizing antibody correlates analysis of tetravalent dengue vaccine efficacy trials in Asia and Latin America. J Infect Dis. 2018;217(5):742–53. CrossRef
16. Chou CH, Shrestha S, Yang CD, Chang NW, Lin YL, Liao KW, et al. miRTarBase update 2018: a resource for experimentally validated microRNA-target interactions. Nucleic Acids Res. 2018;46(D1):D296–302.
17. Pu M, Chen J, Tao Z, Miao L, Qi X, Wang Y, et al. Regulatory network of miRNA on its target: coordination between transcriptional and post-transcriptional regulation of gene expression. Cell Mol Life Sci. 2019;76(3):441–51. CrossRef
18. Ryan MM, Lockstone HE, Huffaker SJ, Wayland MT, Webster MJ, Bahn S. Gene expression analysis of bipolar disorder reveals downregulation of the ubiquitin cycle and alterations in synaptic genes. Mol Psychiatry. 2006;11:965–78. CrossRef
19. Clifton NE, Hannon E, Harwood JC, Di Florio A, Thomas KL, Holmans PA, et al. Dynamic expression of genes associated with schizophrenia and bipolar disorder across development. Transl Psychiatry. 2019;9(1):74. CrossRef
20. Kumar A, Pareek V, Singh HN, Faiq MA, Narayan RK, Raza K, Kumar P. Altered expression of a unique set of genes reveals complex etiology of schizophrenia. Front Psychiatry. 2019;10:906. CrossRef
21. Panizo S, Martínez-Arias L, Alonso-Montes C, Cannata P, Martín-Carro B, Fernández-Martín JL, et al. Fibrosis in chronic kidney disease: pathogenesis and consequences. Int J Mol Sci. 2021;22(1):408. doi: https://doi.org/10.3390/ijms22010408 CrossRef
22. Carbonell T, Gomes AV. MicroRNAs in the regulation of cellular redox status and its implications in myocardial ischemia-reperfusion injury. Redox Biol. 2020;36:101607. CrossRef
23. Peters LJF, Floege J, Biessen EAL, Jankowski J, van der Vorst EPC. MicroRNAs in chronic kidney disease: four candidates for clinical application. Int J Mol Sci. 2020; 21(18):6547. doi: https://doi.org/10.3390/ijms21186547
24. Jiang K, Hu J, Luo G, Song D, Zhang P, Zhu J, et al. miR-155-5p promotes oxalate- and calcium-induced kidney oxidative stress injury by suppressing MGP expression. Oxid Med Cell Longev. 2020 Mar 4;2020:5863617.
25. Wang B, He G, Xu G, Wen J, Yu X. miRNA-34a inhibits cell adhesion by targeting CD44 in human renal epithelial cells: implications for renal stone disease. Urolithiasis. 2019;48(2):109–16. doi: https://doi.org/10.1007/s00240-019-01155-9 CrossRef
26. Shi J, Duan J, Gong H, Pang Y, Wang L, Yan Y. Exosomes from miR-20b-3p-overexpressing stromal cells ameliorate calcium oxalate deposition in rat kidney. J Cell Mol Med. 2019;23(11):7268–78. CrossRef
27. Liu H, Ye T, Yang X, Liu J, Jiang K, Lu H, et al. H19 promote calcium oxalate nephrocalcinosis-induced renal tubular epithelial cell injury via a ceRNA pathway. eBioMedicine. 2019;50:366–78. doi: https://doi.org/10.1016/j.ebiom.2019.10.059 CrossRef
28. Chen Z, Yuan P, Sun X, Tang K, Liu H, Han S, et al. Pioglitazone decreased renal calcium oxalate crystal formation by suppressing M1 macrophage polarization via the PPAR-gamma-miR-23 axis. Am J Physiol Renal Physiol. 2019;317(1):F137–51. CrossRef
29. Liang X, Lai Y, Wu W, Chen D, Zhong F, Huang J, et al. LncRNA-miRNA-mRNA expression variation profile in the urine of calcium oxalate stone patients. BMC Med Genomics. 2019;12(1):57. CrossRef