INTRODUCTION
Thai traditional herbs have been used by local healers throughout history (Srichaikul et al., 2012), and more than 50 Thai traditional herbal formulas are listed in the National List of Essential Medicines (Thaenkham et al., 2017). Piper nigrum L. (black pepper) belongs to the Piperaceae family, which is a highly valuable plant and an essential ingredient in various traditional formulas, including in Ayurvedic literature (Zarai et al., 2013). The important pharmacological properties of P. nigrum include antimicrobial, antioxidant, anticancer, antidiabetic, anti-inflammatory, analgesic, anticonvulsant, and neuroprotective activities (Takooree et al., 2019). The major alkaloid of this plant is piperine (Shityakov et al., 2019). Piperine displays antioxidant, anticarcinogenic, anti-inflammatory, antiulcer, antithyroid, and antimicrobial activities (Gorgani et al., 2017). In addition, piperine promotes the bioavailability of some drugs by diminution of metabolism and decreases blood cholesterol levels (Duangjai et al., 2013).
Although researchers have previously reported on the establishment of high-performance liquid chromatography (HPLC) procedures for the estimation of piperine content (Hazra et al., 2019; Jana et al., 2021; Kamal et al., 2012; Khismatrao et al., 2018; Setyaningsih et al., 2021; Shrestha et al., 2020; Upadhyay et al., 2013), they have not employed systematic statistical optimization of those methods for use in herbal formulas. HPLC optimization methods are complicated procedures involving the simultaneous monitoring of the variation of parameters such as solvent system, pH, buffer concentration, flow rate, column temperature, and detector to achieve effective system optimization (Kazusaki et al., 2012; Kumar et al., 2015). After this, the HPLC method needs to be properly adjusted and modified before being used for analysis.
Factorial experimental design has been used for assessing and optimizing various processes, particularly in analytical research in which methods can be influenced by multiple factors (Sahu et al., 2018). Response surface methodology (RSM) was used to optimize the process when variable factors and interactions affect the observed response (Yolmeh and Jafari, 2017). Applying Box–Behnken design (BBD) to RSM is performed for the appropriate parameters collectively to obtain the maximum useful information from the fewest possible experiments, thereby minimizing cost and maximizing profit (Silva et al., 2017). Some studies revealed the application of RSM and BBD to optimize some extraction methods in herbal extract (Ngamkhae et al., 2022). This current study examined the factors that can affect HPLC analysis using RSM with BBD, followed by system suitability testing and robustness testing before application to determine piperine content in seven Thai traditional herbal formulas containing P. nigrum.
MATERIAL AND METHODS
Chemicals and reagents
Piperine was purchased from Sigma-Aldrich, St. Louis, MO. Acetonitrile and n-propanol at HPLC grade were purchased from Merck Ltd., Darmstadt, Germany. Formic acid and methanol (analytical reagent grade) were purchased from BDH (VWR International Ltd, USA). Seven Thai traditional formulas that contain P. nigrum in the formulation were purchased from herb shops in Khon Kaen province, Thailand.
Methods
Preparation of standard piperine solutions
Piperine stock solution (1,000 μg/ml) was prepared in methanol and diluted to the concentrations of 5, 10, 25, 50, 75, and 100 μg/ml as a working solution.
Preparation of sample solution
Dried powders of traditional Thai formulas (10 g in each formula) were macerated with 30 ml of methanol, sonicated for 30 minutes, and filtered through a 0.45 μm nylon syringe filter. All extracts were mixed with methanol at the ratio of 1:100 and kept at −20°C prior to analysis.
Experimental design for HPLC condition
The HPLC condition was established using factorial design RSM with BBD (Box and Behnken, 1960). This method was applied to find the important factors affecting piperine elution in the HPLC system. Three factors, flow rate, detection wavelength, and acetonitrile ratio, were differed at three levels each (Table 1) and monitored for five observed responses: retention time, peak area, number of theoretical plates, tailing factor, and capacity factor. The above responses were optimized using Design Expert software (version 13) via multiple response algorithms. The individual parameters with three levels give rise to the 17 experimental designs presented in Table 2. RSM with BBD statistical testing was applied to optimize the parameters and evaluate quadratic effects for all factors and responses. The linear polynomial equation generated from analysis of variance (ANOVA) is described as follows (Eq. 1):
 | Table 1. Variables and levels used in BBD. [Click here to view] |
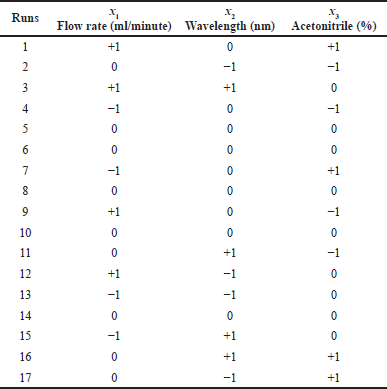 | Table 2. BBD for testing three variables at three levels of HPLC conditions. [Click here to view] |
Y = b0 + b1x1 + b2x2 + b3x3 + b12x1x2 + b13x1x3 + b23x2x3 + b11x21 + b22x22 + b33x23 (1)
where Y is the observed response, b0 is a constant, and b1–b33 are the regression coefficients computed from the observed experiment, x1, x2, and x3 are the coded values of independent variables representing the percentage of acetonitrile, wavelength, and flow rate, respectively.
Robustness testing
In pharmaceutical analysis, robustness testing is becoming a more important procedure in validation investigations of analytical experiments. Robustness testing determines the capacity of a system to remain unaffected by small changes in method parameters (Ferreira et al., 2017). Variations of flow rate, detection wavelength, and percentage of acetonitrile in the mobile phase were considered in this study. The tailing factor of the major piperine peak was one important chromatographic criterion used as a method response for robustness testing. This experimental design was also applied to assess the robustness of the developed method via an alternative approach in which factors were investigated simultaneously.
System suitability parameters
System suitability is regarded as the performance qualification of various analytical procedures. System suitability parameters are established for a specific procedure depending on the type of procedure being validated (Tiryaki et al., 2009). Six replicates of the piperine standards were injected and analyzed using the optimized method. The precision of the retention time, peak area, number of theoretical plates, tailing factor, and capacity factor responses were analyzed and calculated after injection (Bose, 2014). The following definitions of these parameters and the equations for calculating them are taken from the International Conference on Harmonisation of Technical Requirments for Registration of Pharmaceutical for Human Use (ICH) guideline (ICH-Q2 (R1), 2005) and the Center for Drug Evaluation and Research (CDER) guideline (CDER, 1994).
Retention time
The retention time is an easy-to-identify parameter. The condition of the column can influence this parameter, differences between lots of the mobile phase, and variations in ambient temperature (Tiryaki et al., 2009). For the analysis, the variation of retention time is defined in terms of relative standard deviation.
Peak area
The area under the peak represents the size and area of the component peak and is proportional to the amount of the component found in a sample. The peak area is measured and calculated automatically by the HPLC operating system (Vanbel and Schoenmakers, 2009).
Number of theoretical plates
The theoretical plate number is used to determine column efficiency (Bose, 2014). The plate number changes depending on the type of analysis carried out. This parameter is calculated by the following equation:
N = 16 (tR / tW)2 = L / H (2)
where N is the number of theoretical plates, tR is the retention time of the interested peak, tW is the peak width measured at the baseline, L is the length of the column, and H is the height equivalent of the theoretical plate.
Tailing factor
The column efficiency depends not only on the number of theoretical plates but also on the tailing factor. The tailing factor is also called the symmetry factor. This parameter demonstrates the symmetry of the peak shape (Bose, 2014). The tailing factor is calculated by the following equation:
T = Wx / 2f (3)
where T is the tailing factor, Wx is the width of the peak at either 5% (0.05) or 10% (0.10) from the baseline of the peak height, and f is the distance between the peak maximum and the peak front at Wx.
Capacity factor
The capacity factor is a measurement of the retention of the analyte with respect to the void volume or elution time of the nonretained components (Bose, 2014). The capacity factor is calculated by the following equation:
k’ = (tR – tO) / tO, (4)
where k’ is the capacity factor, tR is the retention time of the interested peak, and tO is the elution time of the void volume or nonretained components.
Chromatographic conditions for determination of piperine in Thai herbal formulas
This study was performed using a Shimadzu HPLC system consisting of a solvent delivery pump (LC-20AD), a UV-Vis detector (SPD-20A), and a manual injector with a 20 μl loop (Shimadzu USA Manufacturing Inc., Japan). Separation was performed on a C18 column (Hypersil ODS, 5 μm, 4.0 × 250 mm, Agilent Technologies Inc., Santa Clara, CA) with an isocratic system. The suitable mobile phase consisted of 1% formic acid: propanol: acetonitrile in the ratio of 55: 10: 35, v/v, with a flow rate of 1.2 ml/minute and wavelength at 254 nm.
Statistical analysis
The analysis of each experimental set was carried out in triplicate. Design Expert® (version 13), Stat-Ease Inc., Minneapolis, MN, statistical software was used for designing the optimized conditions of the HPLC method.
RESULTS AND DISCUSSION
Experimental design for HPLC condition
According to the BBD, 17 experimental runs were conducted for 3 variable factors at 3 levels each and 5 responses. Further investigation evaluated the relationship between the observed responses and independent factors using RSM. Based on these values, a quadratic model was selected for the retention time, peak area, number of theoretical plates, and capacity factor responses. In this study, three independent factors, flow rate (x1), wavelength (x2), and %acetonitrile (x3) were varied during trial runs. The qualitative responses were retention time (Y1), peak area (Y2), number of theoretical plates (Y3), tailing factor (Y4), and capacity factor (Y5). The investigated responses were calculated and are shown in Table 3. Based on the predicted residual error sum of squares (PRESS) values, a quadratic model was selected to fit all responses. PRESS provides a summary measure of model fitting, which is calculated from the sums of the squares of the prediction residuals for those observations (Xu, 2017). An ANOVA of the response in the quadratic model was performed, and the results are shown in Table 4. A statistically significant model of responses found that Y1, Y2, Y4, and Y5 showed p values less than 0.05 with low coefficients of variation (% CV). The ANOVA results for Y1, Y2, and Y4 also showed high adjusted R2 values indicating a good relationship between the experiment and the fitted model. For adequate precision, a ratio of the predicted values at the design points to the average prediction error greater than 4 indicates adequate model discrimination (Moradi et al., 2016). In this investigation, the adequate precision of all responses was found to be more than 4 and therefore considered satisfactory.
From the lack-of-fit results, the F-values of Y2 (4.67) and Y4 (1.62) were not significant (p values = 0.0852 and 0.3180, respectively), indicating the fit was good with a satisfactory model (Bisht et al., 2012). As shown in Table 4, the linear parameter x1 was significant at the level of p < 0.05 for Y1 and Y2, and the linear parameter x3 was significant for Y1, Y2, and Y4 at the level of p < 0.001, 0.05, and 0.001, respectively. The quadratic parameters x21 and x22 were significant for Y2 at the level of p < 0.05, while the quadratic parameter x23 was significant for Y4 at the level of p < 0.0001. Moreover, the interaction parameter x2x3 was significant for Y1, Y2, Y3, and Y4 at the level of p < 0.05. For overall testing, the significant regression and nonsignificant lack-of-fit results revealed that the regression equation was suitable to show the relationship between the response values (Y) and independent variables, except for Y3, with an R2 value less than 0.75. The second-order regression equations (Eqs. 5–9) were fitted as follows:
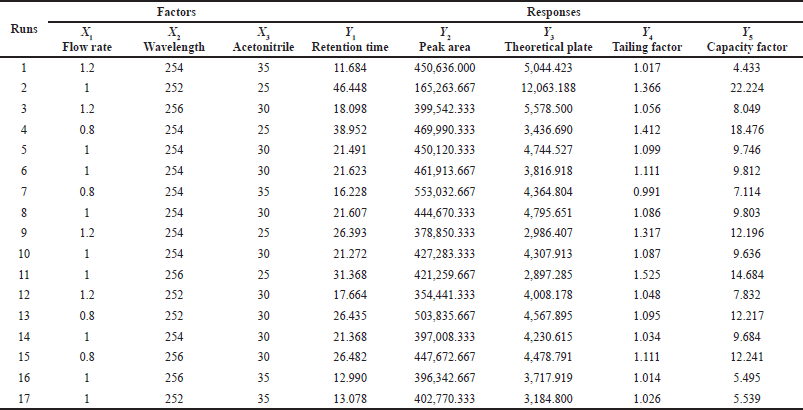 | Table 3. Observed responses of BBD testing of three variables at three levels. [Click here to view] |
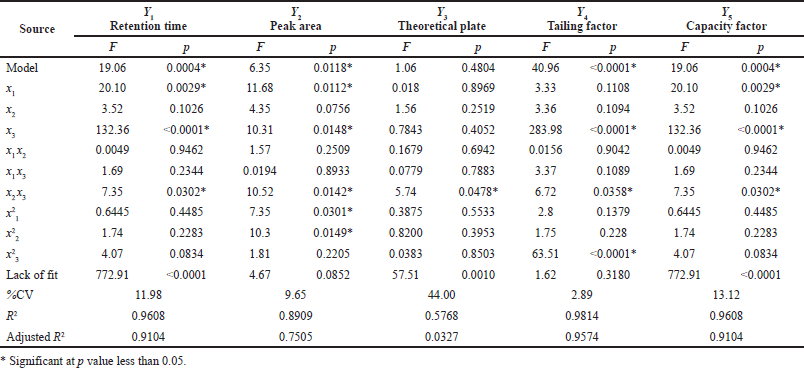 | Table 4. The ANOVA results of the response surface model for retention time, peak area, theoretical plate, tailing factor, and capacity factor. [Click here to view] |
Retention time:
Y1 = 21.47 – 4.38X1 – 1.84X2 – 11.25X3 + 0.097X1 X2 + 1.8X1 X3 + 3.75X2 X3 – 1.08X21 + 1.78X22 + 2.72X23. (5)
Peak area:
Y2 = 436,200 – 48,882.67x1 + 29,813.29x2 + 45,927.21x3 + 25,316x1 x2 – 2,814.17x1 x3 – 65,605.92x2 x3 + 53,446.02x21 – 63,272.22x22 – 26,517.89x23. (6)
Theoretical plate:
Y3 = 4,379.12 + 96.17x1 – 893.95x2 – 633.95x3 – 414.86x1x2 + 282.48x1x3 + 2,424.76x2x3 – 614.25x21 + 893.47x22 + 193.21x23. (7)
Tailing factor:
Y4 = 1.08 – 0.0213x1 + 0.0214x2 – 0.1965x3 – 0.0021x1 x2 + 0.0303x1x3 – 0.0428x2x3 – 0.0269x21 + 0.0212x22 + 0.1281x23. (8)
Capacity factor:
Y5 = 9.74 – 2.19x1 – 0.9178x2 – 5.62x3 + 0.0484x1 x2 + 0.8996x1 x3 + 1.87x2 x3 – 0.5410x21 + 0.8897x22 + 1.36x23. (9)
The response data values from the BBD were substituted into each model for evaluation using the coefficient of determination (R2), which represents the proportion of the model that can explain the variation in the responses (Tan et al., 2010). The R2 values for retention time, peak area, number of theoretical plates, tailing factor, and capacity factor were 0.9608, 0.8909, 0.5768, 0.9814, and 0.9608, respectively. Accordingly, Y1, Y2, Y4, and Y5 gave sufficiently high R2 values to conclude that these developed models satisfactorily described the system’s behavior within the range of the operating parameters (Box and Behnken, 1960), while Y3 did not. This might reveal that the variable factors selected in this design (flow rate, detection wavelength, and percentage acetonitrile in mobile phase) were not appropriate and potentially affected the number of theoretical plates in this experiment. The number of theoretical plates value represents an equilibrated partitioning of the solute between the stationary and mobile phases, which is used to indicate column efficiency (Barth, 2018). The major factors that affect the theoretical plate response are the particle size of the stationary phase, injection volume, dead volume of interconnecting tubing, and column length and temperature. Mobile phase composition and flow rate show only weak-to-medium effects on the number of theoretical plates response (Maneenet et al., 2019).
To examine how the variable factors affect the different responses, a perturbation plot can be used to compare all factors at a particular point in the design space. Each response factor was plotted by changing one factor over its range while the other factors were kept constant (Fig. 1). A response is considered sensitive to a factor if the slope of the line in the perturbation plot is steep and curved, and if the line is flat, the response is considered insensitive to change by that factor. In our study, line C in Figure 1a represents the change in retention time as the percentage of acetonitrile in the mobile phase is varied. It shows a steep slope and curved shape, which indicates that this factor affected this response. Similarly, flow rate appeared to affect peak area (line A, Fig. 1b) and the percentage of acetonitrile in the mobile phase affected the tailing factor and capacity factor (line C, Fig. 1d and E).
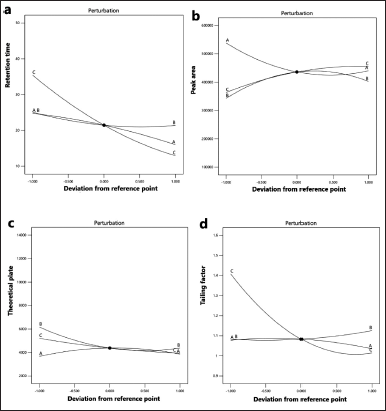 | Figure 1. Perturbation plots showing the effect of various factors [lines: A: flow rate (0.8, 1.0, and 1.2 ml/minute), B: wavelength (250, 252, and 254 nm), and C: percentage acetonitrile (25%, 30%, and 35%)] on responses (a: retention time, b: peak area, c: theoretical plate, d: tailing factor, and e: capacity factor). [Click here to view] |
Further investigation using RSM evaluated the interaction between the independent factors and dependent responses. Three-dimensional (3D) response surface plots of the effect of flow rate, detection wavelength, and percentage acetonitrile of the HPLC system on the retention time, peak area, number of theoretical plates, tailing factor, and capacity factor responses are shown in Figure 2. The 3D response surface plots present dependent interactions between two variable factors while the third factor is kept constant. For example, Figure 2A–C indicates that decreasing the percentage of acetonitrile in the mobile phase substantially reduced retention time, while changes in flow rate showed a small effect and changes in detection wavelength showed no effect. Figure 2D–F indicates that increasing the percentage of acetonitrile and the flow rate had a medium effect on the piperine peak area. The percentage of acetonitrile showed a small effect on the number of theoretical plates response (Fig. 2G–I) and the tailing factor increased with increased flow rate and detection wavelength and reduced with a decreased percentage of acetonitrile (Fig. 2J–L). Figure 2M–O indicates that increased acetonitrile percentage and higher detection wavelength showed an effect on the capacity factor of the column.
Therefore, the appropriate HPLC system for the determination of piperine content was 35% acetonitrile in the mobile phase at a flow rate of 1.20 ml/minute with detection at a wavelength of 254 nm. These HPLC conditions gave the shortest retention time (11.68 minutes) and highest peak area (450,636), with optimum theoretical plate (5,044), tailing factor (1.017), and capacity factor (4.433) values. These results confirmed that the response model adequately reflected the expected optimization of HPLC conditions, and the model was satisfactory and accurate. A study by Maneenet et al. (2019) previously determined piperine content in Kleeb Bua Daeng Thai traditional formula by this HPLC condition. The previous research was about Kleeb Bua Daeng, a Thai traditional herbal formula that ameliorated unpredictable chronic mild stress-induced cognitive impairment in ICR mice and revealed using HPLC for the determination of active compounds in some Thai formula and validating of the HPLC method, including the parameters of accuracy, precision, linearity, limit of detection, and limit of quantitation. However, there are many Thai herbal formulas in which one of the compositions in this formula contains P. nigrum (one of the compositions in the Kleeb Bua Daeng formula), and the main active compound in P. nigrum is piperine. Thus, the optimization for the condition of the HPLC method to analyze piperine should be developed from the previous study to improve the quality and potential of this HPLC method for the determination of piperine and applied to the other herbal formula containing P. nigrum. The previous study did not reveal some parameters, such as robustness testing, which is important and could improve the systematic development of HPLC conditions for the analysis and expand using this analytical method to determine the other herbal formulas.
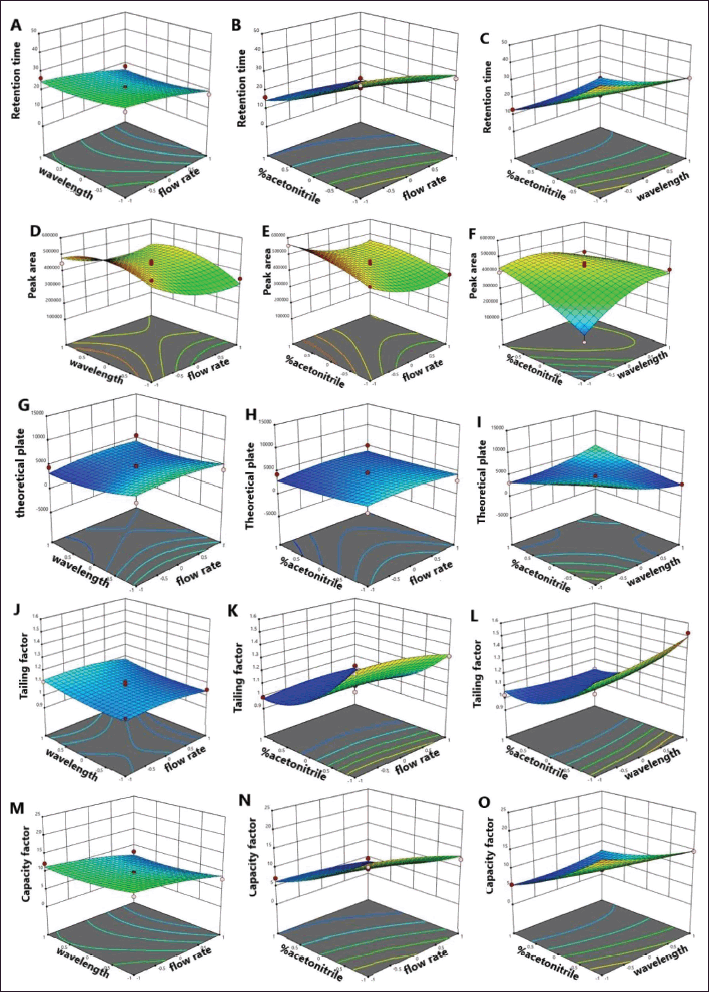 | Figure 2. 3D response surface plot expressing interaction effects of various factors on responses. ABC: retention time; DEF: peak area; GHI: theoretical plate; JKL: tailing factor; MNO: capacity factor. [Click here to view] |
 | Figure 3. Response surface contour graphs showing the effect of flow rate, wavelength, and percentage acetonitrile on the tailing factor response. A: wavelength and flow rate; B: percentage acetonitrile and flow rate; and C: percentage acetonitrile and wavelength. [Click here to view] |
Robustness testing
Robustness is an important parameter in method validation criteria, but robustness testing for piperine analysis has never previously been reported in the former study (Maneenet et al., 2019). The experimental design with the Box–Behnken method employed in this study could be applied to investigate the robustness of the developed HPLC method. The tailing factor was chosen as the response for robustness testing. From the tailing factor quadratic second-order regression equation (Eq. 8), the percentage of acetonitrile in the mobile phase (x3) had the highest coefficient, indicating that it had the highest influence on the tailing factor (Y4). Thus, large changes in the percentage of acetonitrile in the mobile phase could significantly affect the tailing factor. However, the variation in the tailing factor for all variable changes was less than 2, which is within the acceptance criteria for the tailing factor. Contour plots are two-dimensional representations of the function of varying two factors at a time while holding other factors at specified levels (Kumar et al., 2016). In this study, contour graphs were generated by plotting the tailing factor response against two varying factors while the third factor was held constant at the proposed optimum level. The percentage of acetonitrile in the mobile phase notably affected the tailing factor, as shown in Figure 3B and C.
 | Table 5. System suitability results from the HPLC system. [Click here to view] |
System suitability testing
System suitability testing assesses validated chromatographic systems before commencing sample analysis. According to the ICH and CDER, the system suitability testing represents the minimum acceptable system performance levels. The results of system suitability parameters are shown in Table 5. The value for the number of theoretical plates was 5,044.42, indicating good column efficiency and separation of piperine (acceptable theoretical plate limit > 2,000). For the tailing factor, the value was 1.017 indicating high efficacy of piperine quantitation (acceptable tailing factor limit ≤ 2). The capacity factor value was 4.433. The capacity factor represents how much the sample interacts with the chromatography material and should be between 2 and 8 (Tiryaki et al., 2009). Thus, the system suitability parameters were acceptable, and the method was found to be suitable (Table 5).
Chromatographic results of piperine content in Thai herbal formulas
Representative chromatograms of the seven traditional Thai formulas using the developed and optimized HPLC method are shown in Figure 4. Samples were analyzed in triplicate. The amount of piperine in the formulas ranged from 0.256 ± 0.064 to 22.284 ± 0.802 mg/g extract, as shown in Table 6. Variation in piperine content between products reflects the different compositions of P. nigrum in each formulation. The highest piperine content was found in product formula E, which shows the highest composition of P. nigrum on the product label (Fig. 4). These results confirm the usefulness of this HPLC condition for the analysis of piperine in herbal formulas.
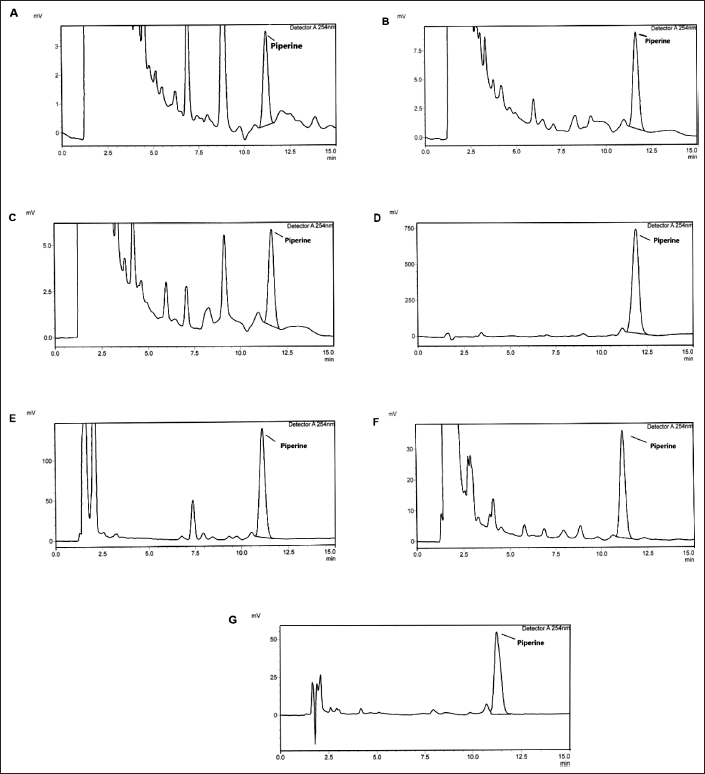 | Figure 4. Chromatograms of piperine in seven traditional Thai herbal formulas (A–G). [Click here to view] |
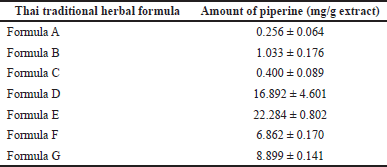 | Table 6. The content of piperine in seven traditional Thai herbal formulas. [Click here to view] |
CONCLUSION
An HPLC method was developed for the determination of piperine content in traditional Thai herbal formulas. A BBD was adopted to optimize the HPLC method. RSM was applied to assess interactions between factors (flow rate, detection wavelength, and percentage of acetonitrile in the mobile phase) and the observed responses (retention time, peak area, number of theoretical plates, tailing factor, and capacity factor). The percentage of acetonitrile in the mobile phase and flow rate showed the most impact on retention time, peak area, and tailing factor, while detection wavelength showed only a small effect on these responses. System suitability testing of the analytical method showed it to be consistent, and robustness testing showed the method to be resistant to small changes in the analytical conditions. Therefore, the HPLC procedure was appropriated for the analysis of piperine from Thai herbal medicines and could potentially be applied to determine piperine content in other formulations containing P. nigrum.
ACKNOWLEDGMENTS
This work was supported by the Fundamental Fund (Basic Research Fund) of Khon Kaen University and funding support from the National Science, Research and Innovation Fund, Thailand. The authors thank Dr. Glenn Borlace for English language assistance through the Publication Clinic of Khon Kaen University.
AUTHOR CONTRIBUTIONS
All authors made substantial contributions to conception and design, acquisition of data, or analysis and interpretation of data; took part in drafting the article or revising it critically for important intellectual content; agreed to submit to the current journal; gave final approval of the version to be published; and agree to be accountable for all aspects of the work. All the authors are eligible to be an author as per the international committee of medical journal editors (ICMJE) requirements/guidelines.
CONFLICTS OF INTEREST
The authors have no conflicts of interest to declare relevant to this article’s content.
ETHICAL APPROVALS
This study does not involve experiments on animals or human subjects.
DATA AVAILABILITY
All data generated and analyzed are included in this research article.
PUBLISHER’S NOTE
This journal remains neutral regarding jurisdictional claims in published institutional affiliation.
REFERENCES
Barth HG. chromatography fundamentals, part V: theoretical plates: significance, properties, and uses. LC GC N Am, 2018; 36(11):830–5.
Bisht D, Yadav SK, Darmwal NS. Optimization of immobilization conditions by conventional and statistical strategies for alkaline lipase production by Pseudomonas aeruginosa mutant cells: scale-up at bench-scale bioreactor level. Turk J Biol, 2012; 37(4):392–404. CrossRef
Bose A. HPLC calibration process parameter in terms of system suitability test. Austin Chromato, 2014; 1(2):1–4.
Box GEP, Behnken DW. Some new three level designs for the study of quantitative variables. Technometrics, 1960; 2(4):455–75. CrossRef
Center for Drug Evaluation and Research (CDER). Reviewer guidance: validation of chromatographic methods. 1994. Available via https://www.fda.gov/media/75643
Duangjai A, Ingkaninan K, Praputbut S, Limpeanchob N. Black pepper and piperine reduce cholesterol uptake and enhance translocation of cholesterol transporter proteins. J Nat Med, 2013; 67:303–10. CrossRef
Ferreira S, Caires A, Borges T, Lima A, Silva L, dos Santos W. Robustness evaluation in analytical methods optimized using experimental design. Microchem J, 2017; 131:163–9. CrossRef
Gorgani L, Mohammadi M, Najafpour GD, Nikzad M. Pierine–the bioactive compound of black pepper: from isolation to medicinal formulations. Compr Rev Food Sci Food Saf, 2017; 16:124–40. CrossRef
Hazra AK, Chakraborty B, Mitra A, Sur Kumar T. A rapid HPTLC method to estimate piperine in Ayurvedic formulations. J Ayurveda Integr Med, 2019; 10:248–54. CrossRef
ICH Q2(R1). Harmonised tripartite guideline: validation of analytical procedure: text and methodology. In Proceedings of the International Conference on Harmonization, Geneva, Switzerland, 2005. Available via https://www.fda.gov/media/152208
Jana SN, Sing D, Banerjee S, Haldar PK, Dasgupta B, Kar A, Sharma N, Bandyopadhayay R, Mukherjee PK. Quantification of piperine in different varieties of Piper nigrum by a validated high-performance thin-layer chromatography?densitometry method. J Planar Chromat, 2021; 34:521–30. CrossRef
Kamal YT, Musthaba M, Singh M, Parveen R, Ahmad S, Baboota S, Ali I, Siddiqui KM, Zaidiet SMA. Development and validation of HPLC method for simultaneous estimation of piperine and guggulsterones in compound Unani formulation (tablets) and a nanoreservoir system. Biomed Chromatogr, 2012; 26(10):1183–90. CrossRef
Kazusaki M, Ueda S, Takeuchi N, Ohgami Y. Validation of analytical procedures by high–performance liquid chromatography for pharmaceutical analysis. Chromatography, 2012; 33(2):66–72. CrossRef
Khismatrao A, Bhairy S, Hirlekar R. Development and validation of RP-HPLC method for simultaneous estimation of curcumin and piperine. Int J Appl Pharm, 2018; 10(5):43–8. CrossRef
Kumar V, Bharadwaj R, Gupta G, Kumar S. An overview on HPLC method development, optimization and validation process for drug analysis. Pharm Chem J, 2015; 2(2):30–40.
Kumar S, Malyan SK, Kumar A, Bishnoi NR. Optimization of fenton’s oxidation by Box-Behnken design of response surface methodology for landfill leachate. J Mater Environ Sci, 2016; 7(12):4456–66.
Maneenet J, Daodee S, Monthakantirat O, Boonyarat C, Khamphukdee C, Kwankhao P, Pitiporn S, Awale S, Chulikhit Y, Kijjoa A. Kleeb Bua Daeng, a Thai traditional herbal formula, ameliorated unpredictable chronic mild stress-induced cognitive impairment in ICR mice. Molecules, 2019; 24(24):4587. CrossRef
Moradi M, Fazizadehdavil M, Pirsaheb M, Mansouri Y, Khosravi T, Sharafi K. Response surface methodoloty (RSM) and its application for optimization of ammonium ions removal from aqueous solutions by pumice as a natural and low-cost adsorbent. Arch Environ Prot, 2016; 42(2):33–43. CrossRef
Ngamkhae N, Monthakantirat O, Chulikhit Y, Boonyarat C, Khamphukdee C, Maneenat J, Kwankhao P, Pitiporn S, Daodee S. Optimization of extraction method for Kleeb Bua Daeng formula and comparison between ultrasound-assisted and microwave-assisted extraction. J Appl Res Med Aromat Plants, 2022; 28(7):11. CrossRef
Sahu PK, Ramisetti NR, Cecchi T, Swain S, Patro C, Panda J. An overview of experimental designs in HPLC method development and validation. J Pharm Biomed Anal, 2018; 147:590–611. CrossRef
Setyaningsih D, Santoso YA, Hartini YS, Murti YB, Hinrichs WLJ, Patramurti C. Isocratic high-performance liquid chromatography (HPLC) for simultaneous quantification of curcumin and piperine in a microparticle formulation containing Curcuma longa and Piper nigrum. Heliyon, 2021; 7:1–8. CrossRef
Silva EO, Borges LL, Conceição EC, Bara MF. Box-Behnken experimental design for extraction of artemisinin from Artemisia annua and validation of the assay method. Rev Bras Farmacogn, 2017; 27:519–24. CrossRef
Shityakov S, Bigdelian E, Hussein AA, Hussain MB, Tripathi YC, Khan MU, Shariati MA. Phytochemical and pharmacological attributes of piperine: a bioactive ingredient of black pepper. Eur J Med Chem, 2019; 176:149–61. CrossRef
Shrestha S, Chaudhary N, Sah R, Malakar N. Analysis of piperine in black pepper by high performance liquid chromatography. J Nepal Chem Soc, 2020; 41:80–6. CrossRef
Srichaikul B, Samappito S, Bakker G. Dejchai S, Boonsong K, Thongkong A, Japa S. The therapeutic and clinical drug review of Thai traditional herbal remedies extracted from ancient Thai medicinal manuscript volume no. 3 of plam leaf scriptures. Adv Nat Sci, 2012; 5(1): 29–36.
Takooree H, Aumeeruddy MZ, Rengasamy KR, Venugopala KN, Jeewon R, Zengin G, Mahomoodally MF. A systematic review on black pepper (Piper nigurm L.): from folk uses to pharmacological applications. Crit Rev Food Sci Nutr, 2019; 59:1–34. CrossRef
Tan MC, Chin NL, Yusof YA. A Box-Behnken design for determining the optimum experimental condition of cake batter mixing. Food Bioproc Tech, 2010; 5(3):972–82. CrossRef
Thaenkham A, Luecha P, Padumanonda T. Prelimnary quality control of Thai traditional medicine formula “Thor-Ra-Nee-San-Tha-Kat”. Int J Res Ayurveda Pharm, 2017; 8(3):73–8. CrossRef
Tiryaki O, Baysoyu D, Aydin G, Seçer E. Setting system suitability parameters for performance optimization of GC-NPD detection for pesticide residue analysis. Gazi Univ J Sci, 2009; 22(3):149–55.
Upadhyay V, Sharma N, Joshi HM, Malik A, Mishra MK, Singh B, Tripathi S. Development and validation of rapid RP-HPLC method for estimation of piperine in Piper nigrum L. Int J Herb Med, 2013; 1(4):6–9.
Vanbel PF, Schoenmakers PJ. Selection of adequate optimization criteria in chromatographic separations. Anal Bioanal Chem, 2009; 394(5):1283–89. CrossRef
Xu S. Predicted residual error sum of squares of mixed models: an application for genomic prediction. G3: Genes Genomes Genet, 2017; 7(3):895–909. CrossRef
Yolmeh M, Jafari SM. Applications of response surface methodology in the food industry processes. Food Bioproc Tech, 2017; 10(3):413–33. CrossRef
Zarai Z, Boujelbene E, Salem NB, Gargouri Y, Sayari A. Antioxidant and antimicrobial activities of various solvent extracts, piperine and piperic acid from Piper nigrum. LWT Food Sci Technol, 2013; 50:634–41. CrossRef