INTRODUCTION
Tuna fish has been widely consumed worldwide due to its high nutrition required for human health. The oil from tuna fish, called TFO, contains various nutritional properties that make it valuable. TFO contains monounsaturated fatty acids and polyunsaturated fatty acids which are important for human nutrition. The oil also rich in omega-3 such as docosahexaenoic acid and eicosapentaenoic acid (Suseno et al., 2014). The nutrition of TFO is comparable with other high-nutrition fish oils such as cod liver oil and salmon oil. The price of high-quality TFO can reach up to 7–10 times higher than other edible oils such as palm oil, corn oil, coconut oil, sunflower oil, and pork oil (PO). Therefore, it is often blended with lower price oils by unethical producers or distributors for economic gains (Budiadnyani and Estiasih, 2015).
Food adulteration becomes a serious issue because it decreases the quality and harms the safety of food products. PO is one of the cheapest oils widely used around the world because of its versatility (Lee et al., 2018). However, nonhalal oil such as PO is truly prohibited to be consumed according to the Islamic shariah law (Ghazali and Tukiran, 2021). Halal consumption has become a lifestyle and culture for Muslim and non-Muslim communities in the world. The phenomenon of consumers choosing halal food or transacting using shariah products is an unavoidable thing. This happens not only because it fulfills the demands of religious law but also because consumers are becoming more aware that halal food products are potentially healthier and safer, which increases halal products’ popularity (Teng et al., 2013). It can be said that the halal lifestyle is marked by the increasing awareness of halal in the community. Currently, the demand for halal foods dramatically increased not only in Muslim countries due to people’s awareness of consuming halal foods (Alzeer et al., 2020; Lubis et al., 2016). In addition, Yang and Huang (2017) stated that the buying behavior of non-Muslim consumers was significantly affected by the awareness of halal food products. If we talk about the data, according to the Business Research Company (2022), the size of the global halal food market is expected to grow from $1,134.14 billion in 2021 to $1,290.35 billion in 2022. The compound annual growth rate (CAGR) was reported to be 13.8%. In 2026, the growth of the halal food market is forecasted to be $2,228.63 billion at a CAGR of 14.6%. One of the things that can support this growth is technology; advanced technology in halal food products is a key trend gaining popularity in the halal market. Therefore, halal laboratories are actively engaged in the development of analytical techniques for ensuring food safety and maintaining quality standards with the increasing demand for halal foods.
Therefore, ensuring and warranting the halal status of food products was important. In some cases, however, advanced analytical techniques are required for the authentication of halal products because visual observation is not able to judge the authenticity of halal food products due to the similarity in characteristics and appearance between halal and nonhalal products (Hassan et al., 2018; Hossain et al., 2022). In this study, authentic TFO is slightly different from PO; however, in the adulterated form of TFO and PO, there is no significant difference observed in their visual appearance. Therefore, a rapid, effective analytical method capable of detecting PO in TFO is highly required.
Various methods using some instruments have been developed for the authentication of fish oils. Methods based on gas chromatography such as gas chromatography using a flame ionization detector and mass spectrometry detector (GC-MS) have been developed by most researchers for fish oils authentication by focusing on fatty acids analysis (Putri et al., 2019; Rohman et al., 2021; Yi et al., 2014). However, several disadvantages such as time consumption, complex sample preparation steps including derivatization, and laborious effort due to the use of some chemical reagents have become a serious concern. Vibrational spectroscopy methods such as FTIR spectroscopy offered rapid analysis without complex sample preparation steps and did not require much amount of solvent (Rohman et al., 2020; Windarsih et al., 2021). Moreover, FTIR spectroscopy has the capability for fingerprint analysis which provides specific spectra for each sample. FTIR spectroscopy has been developed and widely used for the adulteration detection of edible fats and oils due to its high effectiveness and efficiency (Arslan and Ça?lar, 2019). However, the huge dataset obtained from FTIR spectra requires advanced statistical analysis to manage and process the data. Chemometrics, a powerful multivariate analysis, has been combined with FTIR analysis to process the extracted FTIR dataset (Balan et al., 2020).
Bunaciu et al. (2022) have successfully used FTIR spectroscopy to analyze sunflower oil adulteration by the addition of other edible oils. In addition, FTIR-combined chemometrics has been successfully used to analyze various fats and oils including beef fat, chicken fat, milk fat, avocado oil, virgin coconut oil, and virgin olive oil. Results showed that FTIR spectroscopy and chemometrics were successfully used to detect and classify the adulterants present (Li et al., 2019; Neves and Poppi, 2020; Rahayu et al., 2018; Vasconcelos et al., 2015). Moreover, the employment of FTIR spectroscopy combined with chemometrics has been applied for halal testing of food products, including oils and fats (Che Man and Rohman, 2011; Guntarti et al., 2019; Witjaksono et al., 2017). The adulteration detection of Gabus (Channa striata) fish oil with different edible oils (palm and corn oils) has been successfully performed using FTIR spectroscopy combined chemometrics (Irnawati et al., 2021). However, studies on the analysis of nonhalal components for fish oils authentication using FTIR spectroscopy and chemometrics remain limited. There is a lack of reports on the detection of PO in high-quality fish oils such as TFO using FTIR-spectroscopy-combined chemometrics. Therefore, the aim of this study was to develop rapid detection of PO in TFO using FTIR spectroscopy combined with chemometrics techniques for halal authentication.
MATERIAL AND METHODS
Sample collection and preparation
TFO was extracted from the meat of yellowfin tuna fish. The oil was obtained using a direct press extraction method employing a room temperature of 25°C (Stanisavljevic et al., 2007). We were using the temperature of 25°C for the direct press extraction method because it is the room temperature in the laboratory. Besides being simple and efficient to operate the press equipment at this temperature, 25°C also did not deteriorate the nutrition value and metabolites constituents in the sample. The sample of PO was obtained from the supermarket in Yogyakarta, Indonesia. The adulterated samples of TFO with PO were prepared by mixing TFO and PO using several concentration levels of PO (%v/v) ranging from 0% to 100% v/v with a total volume of 1 ml. A total of 21 series of samples were prepared as shown in Table 1. Each series was prepared in three replicates.
FTIR spectroscopy measurement
The samples both authentic and adulterated of TFO were measured using an FTIR spectrophotometer (Bruker Vertex 80, Germany). FTIR spectrophotometer was equipped with attenuated total reflectance (ATR) sampling technique. FTIR spectra acquisition was performed in the 4,000–600 cm−1 region by placing the samples directly on the ATR crystal. The resolution used was 8 cm−1 with 32 scanning. Prior to the measurement of each sample, the spectra of the background were recorded using the spectrum of air. After the measurement of each sample, the ATR crystal was cleaned using ethanol analytical grade.
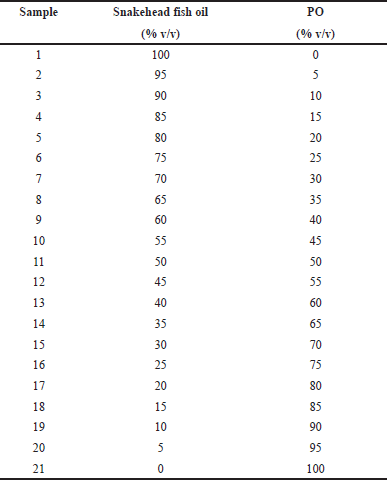 | Table 1. The binary mixtures of TFO and PO used for FTIR analysis. [Click here to view] |
Chemometrics analysis
Chemometrics technique was performed using SIMCA 14.0 software (Umetrics, Sweden) and MetaboAnalyst 5.0. Two chemometrics techniques were used in this study, namely pattern recognition and multivariate calibration. The variables used for chemometrics analysis were the wavenumber extracted from the FTIR spectra. For pattern recognition analysis, unsupervised techniques such as principal component analysis (PCA) and supervised techniques such as PLS-DA and OPLS-DA were used in this study. The PCA model was evaluated using a PCA score plot, PCA loading plot, R2 value, and Q2 value. The performance of PLS-DA and OPLS-DA models was observed using the score plot, R2X value, R2Y value, Q2 value, and permutation test. The variables important for sample differentiation were observed using variables important for projections (VIP) values. Multivariate calibration analysis was performed using PLS and OPLS models. The models were evaluated using coefficient determination, root mean square error of estimation (RMSEE), and root mean square error of cross validation (RMSECV) values. An s-line plot was carried out in OPLS analysis to identify the important variables for creating the prediction model.
RESULTS AND DISCUSSION
FTIR spectra analysis
FTIR spectroscopy provides fingerprint spectra specific for TFO, PO, and a mixture of TFO-PO samples. The spectra of TFO and PO measured at the wavenumber ranging from 4,000 to 600 cm−1 are depicted in Figure 1A. Triacylglycerols, triglycerides, and fatty acids are the main compositions of fats in oils. Therefore, the resulting FTIR vibrations from the oil samples were mainly from those compounds. The stretching vibration of –CH, CH2, and CH3 from aromatic and alkene could be observed at a peak of 3,011 cm−1 whereas the stretching vibration of –CH, –CH2, and –CH3 from aliphatic alkane was found at peaks of 2,922 and 2,853 cm−1. It could be observed that TFO had two peaks at the carbonyl (C=O) region (1,744 and 1,710 cm−1). The absorption band at 1,710 cm−1 was specific for TFO because it was absent in the spectra of PO. The absorption band at 1,459 cm−1 was correlated to the stretching vibration of C=C. Meanwhile, absorption bands at 1,151, 1,116, and 1,097 cm−1 arise from the vibration of C–O (stretching). In addition, vibrations at 1,377, 1,234, 1,032, 929, and 720 cm−1 were associated with bending vibration of –CH, CH2, and CH3 (Rohman et al., 2020). The absorption band at 1,032 cm−1 was unique for PO because it was absent in the spectra of TFO. In the presence of adulterant (PO) with several concentration levels, both absorption bands at 1,710 and 1,032 cm−1 changed as the adulterant concentration increased. The absorbance at 1,710 cm−1 gradually decreased as the concentration of PO increased whereas the absorbance at 1,032 cm−1 increased with the increasing concentration of PO as depicted in Figure 1B. Therefore, the vibrations at 1,710 and 1,302 cm−1 could be used as a potential marker for adulteration analysis of TFO.
A study reported by AL-Kahtani et al. (2017) on the application of FTIR spectroscopy for the identification of lard added in binary mixtures of vegetable oils such as palm oil, corn oil, sunflower oil, and olive oil showed that the FTIR spectra at wavenumber region of 1,405–1,365, 1,260–1,198, 935–910, 877–857, and 857–833 cm−1 could be used for identification of lard in the binary mixtures of those vegetable oils.
Detection of PO in TFO using pattern recognition chemometrics
Three types of pattern recognition analysis were used in this study such as PCA, PLS-DA, and OPLS-DA. PCA could clearly differentiate between TFO and PO samples as depicted in the PCA score plot (Fig. 2). The PCA model had R2 of 0.998 and Q2 of 0.990. The R2 value was used to evaluate model fitting. A model with R2 closer to 1 had the goodness of fit whereas the Q2 was used to evaluate model predictivity. Good model predictivity is obtained when the Q2 value is more than 0.5. In this study, PCA demonstrated a good ability to differentiate TFO from PO. However, analysis using PCA could not clearly differentiate authentic TFO samples from TFO samples adulterated with several concentrations of PO (data not shown). Another study reported that PCA could detect pork adulteration in used cooking oils such as samples of frying oils from fried chicken, fried pork, and fried fish. However, PCA could not differentiate frying oil samples based on their sources (Ali and Tukiran, 2021). Therefore, in our study, PLS-DA was further used for the discrimination of authentic TFO, adulterated TFO with PO at some concentration levels, and pure PO samples. The PLS-DA model could only partially discriminate samples as shown in the PLS-DA score plot (Fig. 3A). The score plots of TFO and adulterated TFO with a lower concentration of PO showed some overlapping with each other. In addition, samples with a high concentration of PO also overlapped with pure PO. Therefore, OPLS-DA was chosen for further analysis to obtain better discrimination results.
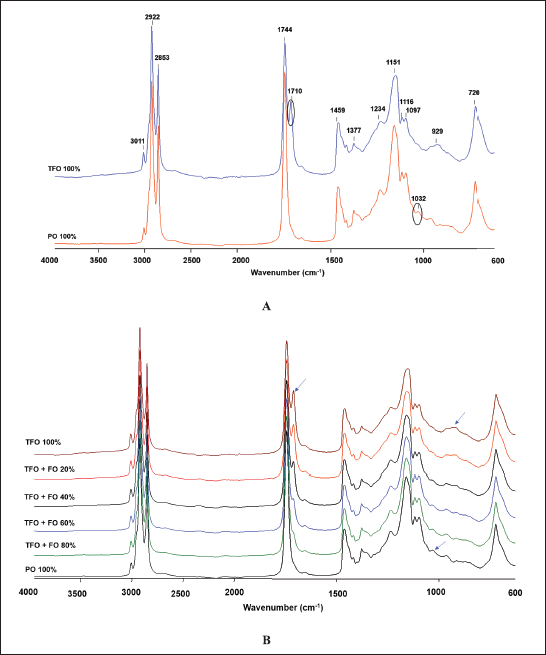 | Figure 1. (A) FTIR spectra of TFO and PO and (B) TFO adulterated PO. [Click here to view] |
OPLS-DA model using three predictive components and seven x-orthogonal components perfectly classified authentic TFO, adulterated TFO with PO, and pure PO with clear separation as demonstrated in the OPLS-DA score plot (Fig. 3B). OPLS-DA could detect and discriminate PO from TFO even at the lowest concentration of PO present (5%v/v). All the mixture samples of TFO-PO could be clearly discriminated from authentic TFO. The OPLS-DA model had an R2X value of 0.998 and an R2Y value of 0.735 indicating good fitness which is associated with the high accuracy model. Meanwhile, the Q2 was 0.552 indicating good model predictivity (Lalaleo et al., 2020). Validation using the permutation test resulted in a Q2 intercept value of zero and below zero (0, −0.581) indicating model validity. In addition, validation using receiver operating characteristics (ROC) analysis also ensures the validity of the OPLS-DA model demonstrated by its area under the curve (AUC) value (1) in all classes. It was associated with the correct classification of samples without misclassification. Analysis of the VIP values showed that variables 2,952, 1,770, 1,743, 1,035, and 1,240 cm−1 were found to be important variables for sample classification. These variables were associated with the vibration of functional groups from fatty acids and triglyceride contents in the oils. It can be summarized that pattern recognition chemometrics such as PCA, PLS-DA, and OPLS-DA are promising to be used for authentication of TFO based on FTIR spectra data with OPLS-DA showing better differentiation results among others.
Multivariate calibration for halal analysis of TFO from PO
Chemometrics multivariate calibrations were applied to detect and predict the concentration of PO added in TFO. PLS was initially applied and the concentration of PO added in TFO was successfully predicted using PLS with the equation of y = x + 4.122.10−6. The PLS model demonstrated a high R2 value of 0.9928 indicating goodness of fit that is associated with good accuracy of the PLS model. Meanwhile, low values of RMSEE (2.81) and RMSECV (2.96) showed low model error, which is correlated to good model precision. The plot of the PLS model is depicted in Figure 4A. PLS is one of the multivariate calibration methods which is widely applied to predict the concentration of target analytes. PLS searches the latent variables to know the relationships between X-matrix and Y-matrix in the prediction model. Previous studies reported the success of the use of PLS for predicting lard added in palm oil (Rohman et al., 2012) as well as lard added in crude palm oil (Ahda and Safitri, 2016) with high precision (R2 > 0.99) and lower error (RMSEC and RMSEE < 5%).
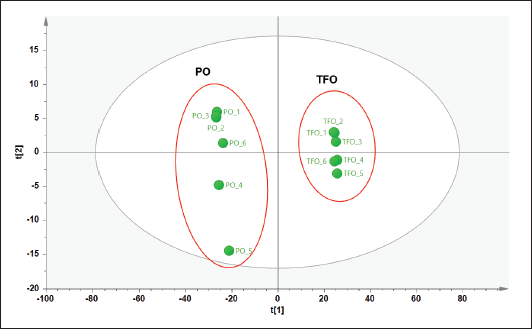 | Figure 2. PCA score plot of TFO and PO. [Click here to view] |
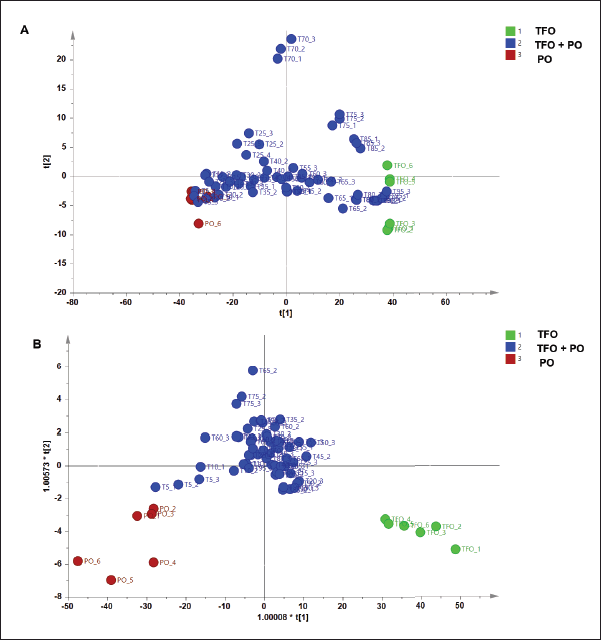 | Figure 3. PLS-DA and OPLS-DA for discrimination and classification of authentic and adulterated TFO with PO. [Click here to view] |
Apart from PLS, OPLS offers different algorithms to create the prediction model due to the application of orthogonal components. Results showed that OPLS was successfully used to detect and predict the concentration of PO in TFO with high accuracy and good precision (Fig. 4B). The unknown sample of TFO adulterated PO could be predicted using the equation of y = x + 7.474.10−6 with the R2 value of 0.9928. The model error was low correlated to the high precision as demonstrated in the values RMSEE (2.81) and RMSECV (2.94). From OPLS analysis, the variables having an important role in predicting the concentration of PO could be observed using an S-line plot as shown in Figure 5. Variables from 11 wavenumbers were investigated. These variables came from the vibrations of –CH, –CH2, and –CH3 stretching, C=O stretching, C–O stretching, C=C stretching, and bending vibration of –CH, –CH2, and –CH3 which were associated with the vibration of fatty acids, triacylglycerols, and triglycerides. It can be summarized that multivariate calibration of PLS and OPLS could be used as rapid and effective methods for authentication of TFO by detecting and predicting the concentration of PO in TFO with high accuracy, good precision, and without time consumption.
Compared to the previous studies on tuna fish and TFO authentication, our study offered several advantages such as being simpler in sample preparation, more economical reagent needed, lower in cost, and faster. Table 2 shows the comparison between our study and the previous studies.
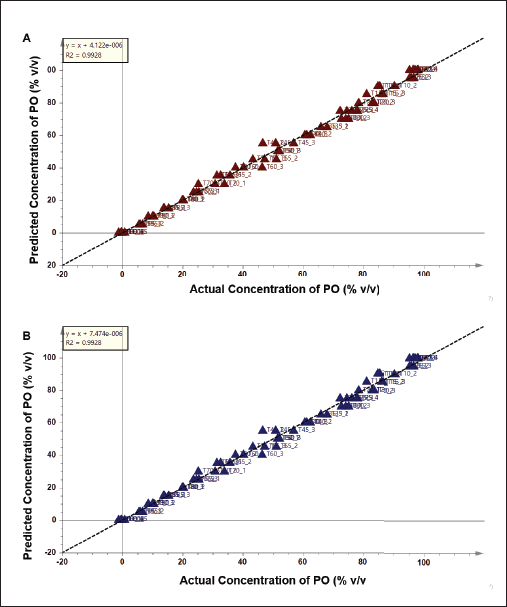 | Figure 4. (A) PLS model and (B) OPLS model to predict the concentration of PO in TFO. [Click here to view] |
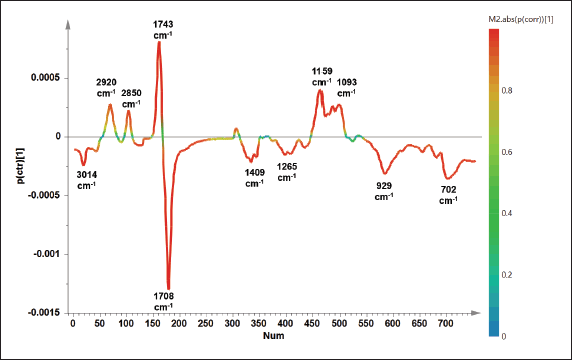 | Figure 5. The S-line plot obtained from OPLS model to identify important variables for predicting the concentration of PO added in TFO. [Click here to view] |
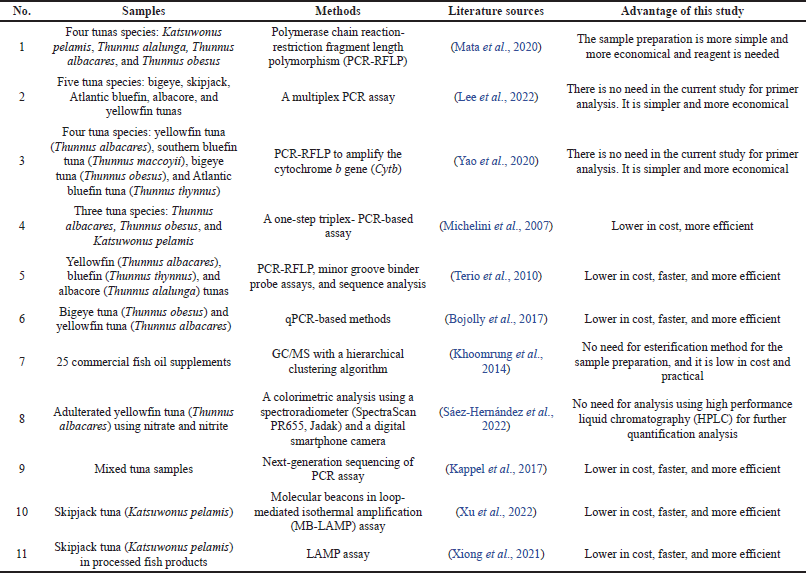 | Table 2. Comparison of a previous study and this study about tuna fish/TFO adulteration detection. [Click here to view] |
CONCLUSION
The authentication of TFO from PO adulteration is very important to warrant the quality and halal status of TFO to protect consumers. FTIR spectroscopy could be used as a rapid analytical method for the authentication of TFO due to its fingerprint properties. Combination with chemometrics PCA, PLS-DA, and OPLS-DA could be used to differentiate PO and TFO. Moreover, OPLS-DA successfully classified authentic TFO and adulterated TFO with 100% accuracy. Meanwhile, chemometrics of PLS and OPLS was effective to predict the concentration of PO added in TFO with high accuracy and high precision. It can be concluded that the combination of FTIR spectroscopy and chemometrics could be a promising analytical technique for the authentication of TFO. In the future, it can be developed as a standard analytical method for the halal authentication of fish oil. Therefore, further research on the application of larger samples of fish oils is required.
ACKNOWLEDGMENT
This research was funded by Penelitian Dasar Unggulan Perguruan Tinggi (PDUPT) with contract number 66/UN29.20/PG/2022. The authors acknowledged the Deputy of Infrastructure and Research Center for Food Technology and Processing (PRTPP), National Research and Innovation Agency (BRIN), Gunungkidul, Yogyakarta, for facilitating the FTIR spectrophotometer instrument.
AUTHORS’ CONTRIBUTIONS
Irnawati conceived and designed the research; Anjar Windarsih prepared the manuscript and made critical thinking on the manuscript; Anastasia Wheni Indrianingsih, Wuri Apriyana, and Yuli Ary Ratnawati performed research activities, data acquisition, and data interpretation; La Ode Muhamad Hazairin Nadia performed statistical analysis; Abdul Rohman conceived and designed research and critically analyzed the manuscript. All authors read and agreed on the published version of the manuscript.
CONFLICTS OF INTEREST
The authors declare no conflicts of interest.
ETHICAL APPROVALS
This study does not involve experiments on animals or human subjects.
DATA AVAILABILITY
All data generated and analyzed are included in this research article.
PUBLISHER’S NOTE
This journal remains neutral with regard to jurisdictional claims in published institutional affiliation.
REFERENCES
Ahda M, Safitri A. Development of lard detection in crude palm oil (CPO) using FTIR combined with chemometrics analysis. Int J Appl Pharmaceutics, 2016; 8:307–9.
AL-Kahtani HA, Ahmed MA, Abou-Arab AA, Hayat K. Identification of lard in vegetable oil binary mixtures and commercial food products by FTIR. Qual Assur Saf Crops Foods, 2021; 9:11–22. CrossRef
Ali NAM, Tukiran NA. Detection of pork in used cooking oil using Fourier transform infrared spectroscopy. Int J Allied Health Sci, 2021; 5:2110–5.
Alzeer J, Rieder U, Hadeed KA. Good agricultural practices and its compatibility with halal standards. Trends Food Sci Technol, 2020; 102:237–41. CrossRef
Arslan FN, Ça?lar F. Attenuated total reflectance–Fourier transform infrared (ATR–FTIR) spectroscopy combined with chemometrics for rapid determination of cold-pressed wheat germ oil adulteration. Food Anal Methods, 2019; 12:355–70. CrossRef
Balan B, Dhaulaniya AS, Jamwal R, Amit, Sodhi, KK, Kelly S, Cannavan A, Singh DK. Application of attenuated total reflectance-Fourier transform infrared (ATR-FTIR) spectroscopy coupled with chemometrics for detection and quantification of formalin in cow milk. Vib Spectrosc, 2020; 107:103033. CrossRef
Bojolly D, Doyen P, Le Fur B, Christaki U, Verrez-Bagnis V, Grard T. Development of a qPCR method for the identification and quantification of two closely related tuna species, bigeye tuna (Thunnus obesus) and yellowfin tuna (Thunnus albacares), in canned tuna. J Agric Food Chem, 2017; 65(4):913–20. CrossRef
Budiadnyani IGA, Estiasih T. Characteristics and fatty acid profile of refined fish oil from byproduct of yellowfin tuna (Thunnus albacares) meal processing. J Life Sci Biomed, 2015; 5:132–6.
Bunaciu AA, Fleschin S, Aboul-Enein HY. Detection of sunflower oils adulteration by ATR-FTIR spectra. Chem Pap, 2022; 76:5533–9. CrossRef
Che Man YB, Rohman A. Detection of lard in vegetable oils. Lipid Technol, 2011; 23:180–2. CrossRef
Ghazali HH, Tukiran NA. Analysis of pork adulteration in recycled frying oils using raman spectroscopy. Malay J Halal Res, 2021; 4:14–7. CrossRef
Guntarti A, Ahda M, Kusbandari A, Prihandoko S. Analysis of lard in sausage using Fourier transform infrared spectrophotometer combined with chemometrics. J Pharm Bioallied Sci, 2019; 11:S594–600. CrossRef
Hassan N, Ahmad T, Zain NM. Chemical and chemometric methods for halal authentication of gelatin: an overview. J Food Sci, 2018; 83:2903–11. CrossRef
Hossain MAM, Uddin SMK, Sultana S, Wahab YA, Sagadevan S, Johan MR, Ali ME. Authentication of halal and kosher meat and meat products: analytical approaches, current progresses and future prospects. Crit Rev Food Sci Nutr, 2022; 62:285–310. CrossRef
Irnawati, Riyanto S, Rohman A. Adulteration of Gabus (Channa striata) fish oil with corn oil and palm oil: the use of FTIR spectra and chemometrics. Food Res, 2021; 5:184–90. CrossRef
Kappel K, Haase I, Käppel C, Sotelo CG, Schröder U. Species identification in mixed tuna samples with next-generation sequencing targeting two short cytochrome b gene fragments. Food Chem, 2017; 234:212–9. CrossRef
Khoomrung S, Raber G, Laoteng K, Francesconi KA. Identification and characterization of fish oil supplements based on fatty acid analysis combined with a hierarchical clustering algorithm. Eur J Lipid Sci Technol, 2014; 116:795–804. CrossRef
Lalaleo L, Hidalgo D, Valle M, Calero-Cáceres W, Lamuela-Raventós RM, Becerra-Martínez E. Differentiating, evaluating, and classifying three quinoa ecotypes by washing, cooking and germination treatments, using 1H NMR-based metabolomic approach. Food Chem, 2020; 331:127351; doi:10.1016/j.foodchem.2020.127351. CrossRef
Lee JY, Park JH, Mun H, Shim WB, Lim SH, Kim MG. Quantitative analysis of lard in animal fat mixture using visible Raman spectroscopy. Food Chem, 2018; 254:109–14. CrossRef
Lee GY, Suh SM, Lee YM, Kim HY. Multiplex PCR assay for simultaneous identification of five types of tuna (Katsuwonus pelamis, Thunnus alalonga, T. albacares, T. obesus and T. thynnus). Foods, 2022; 11(3):280–6. CrossRef
Li Q, Chen J, Huyan Z, Kou Y, Xu L, Yu X, Gao JM. Application of Fourier transform infrared spectroscopy for the quality and safety analysis of fats and oils: a review. Crit Rev Food Sci Nutr, 2019; 59:3597–11. CrossRef
Lubis HN, Mohd-Naim NF, Alizul NN, Ahmed MU. From market to food plate: current trusted technology and innovations in halal food analysis. Trends Food Sci Technol, 2016; 58:55–68. CrossRef
Mata W, Chanmalee T, Punyasuk N, Thitamadee S. Simple PCR-RFLP detection method for genus- and species-authentication of four types of tuna used in canned tuna industry. Food Control, 2020; 108:106842. CrossRef
Michelini E, Cevenini L, Mezzanotte L, Simoni P, Baraldini M, De Laude L, Roda A. One-step triplex-polymerase chain reaction assay for the authentication of yellowfin (Thunnus albacares), bigeye (Thunnus obesus), and skipjack (Katsuwonus pelamis) tuna DNA from fresh, frozen, and canned tuna samples. J Agric Food Chem, 2007; 55(19):7638–47. CrossRef
Neves MDG, Poppi RJ. Authentication and identification of adulterants in virgin coconut oil using ATR/FTIR in tandem with DD-SIMCA one class modeling. Talanta, 2020; 219:121338. CrossRef
Putri AR, Rohman A, Riyanto S. Comparative study of fatty acid profiles in patin (Pangasius micronemus) and gabus (Channa striata) fish oil and its authentication using ftir spectroscopy combined with chemometrics. Int J Appl Pharm, 2019; 11:55–60. CrossRef
Rahayu SW, Martono S, Sudjadi, Rohman A. The potential use of infrared spectroscopy and multivariate analysis for differentiation of beef meatball from dog meat for Halal authentication analysis. J Adv Vet Anim Res, 2018; 5:307–14. CrossRef
Rohman A, Kuwat T, Retno S, Sismindari, Erwanto Y, Tridjoko W. Fourier transform infrared spectroscopy applied for rapid analysis of lard in palm oil. Int Food Res J, 2012; 19:1161–5.
Rohman A, Ghazali MAB, Windarsih A, Irnawati, Riyanto S, Yusof FM, Mustafa S. Comprehensive review on application of FTIR spectroscopy coupled with hemometrics for authentication analysis of fats and oils in the food products. Molecules, 2020; 25:1–28. CrossRef
Rohman A, Putri AR, Irnawati, Windarsih A, Nisa K, Lestari LA. The employment of analytical techniques and chemometrics for authentication of fish oils: a review. Food Control, 2021; 124:107864. CrossRef
Sáez-Hernández R, Antela KU, Mauri-Aucejo AR, Morales-Rubio A, Cervera ML. Smartphone-based colorimetric study of adulterated tuna samples. Food Chem, 2022; 389:133063. CrossRef
Stanisavljevic I, Lakicevic S, Velickovic D, Lazic M, Veljkovic, V. The extraction of oil from tobacco (Nicotiana tabacum L.) seeds. Chem Ind Chem Eng Q, 2007; 13(1):41–50. CrossRef
Suseno SH, Saraswati S, Hayati S, Izaki AF. Fatty acid composition of some potential fish oil from production centers in Indonesia. Orient J Chem, 2014; 30:975–80. CrossRef
Teng PK, Wan Jusoh WJ, Siong HK, Mesbahi MM. Awareness, recognition and intention: insights from a non-Muslim consumer survey regarding halal labeled food products in Malaysia. In 3rd International Conference on Management (3rd ICM 2013) Proceeding, Penang, Malaysia, 2013, pp 89–101.
Terio V, Di Pinto P, Decaro N, Parisi A, Desario C, Martella V, Buonavoglia C, Tantillo MG. Identification of tuna species in commercial cans by minor groove binder probe real-time polymerase chain reaction analysis of mitochondrial DNA sequences. Mol Cell Probes, 2010; 24(6):352–6. CrossRef
The Business Research Company. Halal food market analysis, size and trends global forecast to 2022-2030. Available via https://www.thebusinessresearchcompany.com/report/halal-food-global-market-report
Vasconcelos M, Coelho L, Barros A, de Almeida JMMM. Study of adulteration of extra virgin olive oil with peanut oil using FTIR spectroscopy and chemometrics. Cogent Food Agric, 2015; 1:1018695. CrossRef
Windarsih A, Lestari LA, Erwanto Y, Putri AR, Irnawati, Fadzillah NA, Rahmawati N, Rohman A. Application of Raman spectroscopy and chemometrics for quality controls of fats and oils: a review. Food Rev Int, 2021; 12:1–20. CrossRef
Witjaksono G, Saputra I, Latief M, Jaswir I, Akmeliawati R, Rabih AAS. Non-halal biomarkers identification based on Fourier transform infrared spectroscopy (FTIR) and gas chromatography-time of flight mass spectroscopy (GC-TOF MS) techniques. EPJ Web Conf, 2017; 162:01007. CrossRef
Xiong X, Xu W, Guo L, An J, Huang L, Qian H, Cui X, Li Y, Cao M, Xiong X, Ying X, Wang L. Development of loop-mediated isothermal amplification (LAMP) assay for rapid screening of skipjack tuna (Katsuwonus pelamis) in processed fish products. J Food Compos Anal, 2021; 102:104038. CrossRef
Xu W, Li Q, Xue H, Fei Y, Cui X, Cao M, Xiong X, Xiong X, Yang Y, Wang L. Establishment of a rapid method for skipjack tuna (Katsuwonus pelamis) authentication using molecular beacons in loop-mediated isothermal amplification. Food Chem, 2022; 382:132365. CrossRef
Yang H, Huang L. Research on influencing factors of halal food buying behavior by non-Muslim consumers: a case study of Ningxia in China. Tech Bull, 2017; 55:688–97.
Yao L, Lu J, Qu M, Jiang Y, Li F, Guo Y, Wang L, Zhai Y. Methodology and application of PCR-RFLP for species identification in tuna sashimi. Food Sci Nutr, 2020; 8(7):3138–46. CrossRef
Yi T, Li SM, Fan JY, Fan LL, Zhang ZF, Luo P, Zhang XJ, Wang JG, Zhu L, Zhao ZZ, Chen HB. Comparative analysis of EPA and DHA in fish oil nutritional capsules by GC-MS. Lipids Health Dis, 2014; 13:190. CrossRef