INTRODUCTION
Ginger with the scientific name of Zingiber officinale, with the Indonesian local name “Jahe,” belongs to the Zingiberaceae family. It is known as a spice with characteristics of aroma and pungency and is a part of Indonesian culinary, used as a seasoning (Gong et al., 2004). Ginger is considered a herbal widely employed in Indonesian Traditional medicine for preventing diseases and promoting human health. It is believed that ginger originated from Southeast Asia. In Indonesia, three varieties of ginger are typically cultivated, namely, ginger emprit, ginger gajah, and red ginger. Among these, ginger emprit is known as the most used ginger either as a spice or as an herbal component (Mao et al., 2019). The main bioactive compounds of all variants responsible for the biological activities are [6]-shogaol, [6]-gingerol, [8]-gingerol, and [10]-gingerol. Each variant has its own unique distinctive spicy taste because of the varying number of phenolic ketones in ginger.
Nowadays, ginger has been reported to have some effects which are beneficial to human health (Yudthavorasit et al., 2014), including antioxidant in treating acute kidney injury by increasing the endogenous antioxidant enzymes (Rostamkhani et al., 2022), xanthine oxidase inhibitor (Nile and Park, 2015), potent anti-inflammatory activity through in vivo and in vitro studies (Ezzat et al., 2018), antimicrobial activity against some pathogen microorganism (Abdullahi et al., 2020), and chemopreventive agents toward carcinogens (Abdullahi et al., 2020). These biological activities arise from its bioactive phytochemicals, which are mainly shogaol, gingerols, and other phenolic compounds. The phenolics and flavonoid compounds are good sources of natural antioxidants (Ali et al., 2018). Furthermore, some factors, mainly environmental factors (cultivating, harvesting, and post-harvesting process), are contributing to different levels of active components in ginger; hence, herbal components, in general, must be standardized.
With the development of analytical instruments used for herbal standardization and quality control, large datasets can be obtained in a rapid manner to provide big data. As a consequence, some sophisticated data management called chemometrics is widely applied for handling big data analysis. Numerous analytical instruments are designed and developed with the employment of chemometrics software for creating the recognition pattern of herbals according to their intended uses (classification, discrimination, geographical origin, and detection of herbal adulteration) (Kucharska-Ambro?ej and Karpinska, 2019). The use of chemometric software can significantly improve the understanding of chemical information extracted from instrumental responses. The most used chemometrics in herbal quality control is pattern recognition (PR), which is divided into two groups, namely, unsupervised and supervised ones. Unsupervised PR is employed for data visualization by assessing the relationship between objects or samples and variables without the predetermined class. principal component analysis (PCA) and hierarchical cluster analysis (HCA) are an example of unsupervised PR. In addition, supervised PR is employed for data classification by creating a chemometrics model capable of predicting the class of unknown objects. Linear discriminant analysis (LDA) and Soft independent modeling of class analogy are representative supervised PR widely applied in herbal standardization (Sim et al., 2004; Zhu et al., 2014).
There are some previous reports related to PR chemometrics applied in the quality control of ginger, especially using High Performance Liquid Chromatography (HPLC) instruments. Deng et al. (2015) have discriminated crude and processed ginger from three species, namely, Zingiberis rhizoma, Zingiberis rhizoma preparatum, and Zingiberis rhizoma carbonisata, using chemical responses obtained from Liquid Chromatography-Mass Spectrometry (LC-MS) and PR of PCA and HCA. The combination of 16 peak responses obtained from the HPLC-diode array detector, PCA, HCA, and similarity analysis is also successful in classifying the ginger samples into two different groups (Feng et al., 2014). Rafi et al. (2013) have previously determined the levels of active components in ginger (shogaol and gingerols) using capillary HPLC and used these concentrations as variables for the successful classification and differentiation of three varieties from Indonesian ginger with the help of LDA. The combination of HPLC PR of PCA, HCA, and LDA is capable of discriminating and classifying ginger according to geographical origins (Yudthavorasit et al., 2014). Furthermore, the chemometrics of PCA and canonical variate analysis using FTIR spectra at optimum wavenumbers are successfully reported to differentiate ginger from turmeric and java (Rohaeti et al., 2015). However, using the literature review, the study on the application of FTIR spectra for the classification of Indonesian ginger using PR chemometrics is very limited; hence, the main purpose of this research was to employ the chemometrics technique for the classification and discrimination of Indonesian ginger using FTIR spectra and antioxidant activities as variables.
METHODS
The samples of ginger variety emprit (Z. officinale Roscoe) were obtained from several locations with different altitudes, namely, Bantul (400 masl), Kulonprogo (320 masl) (Yogyakarta), Banyumas (300 masl), Boyolali (900 masl), Karanganyar (712 masl), Magelang (360 masl), Purworejo (1,064 masl), Semarang (536 masl), Temanggung (1,450 masl), Wonogiri (550 masl), Wonosobo (1,000 masl) (Central Java), Magetan (900 masl), Pacitan (946 masl), and Ponorogo (1,056 masl) (East Java). These rhizomes were determined for the authenticity at Plant Systematics Laboratory, Medical Plant and Traditional Medicine Research and Development Center, Tawangmangu, Central Java. The rhizomes were dried and powdered to get rhizome powders subjected to several evaluations. The solvents and reagents used were of analytical grade; Otherwise, the solvents and reagents were not specified.
Sample preparation
The rhizome samples of emprit ginger, harvested at the age of 10–12 months, having leaf color changing from green to yellow and stems all drying up, were cleaned and sliced thinly so that the rhizomes dry quickly. The sliced rhizomes were then dried in an oven at 40°C for 3–5 days. The dried rhizome (Simplicia) was then powdered in the commercial blender. The ginger powder obtained was then sieved using a 20-mesh sieve in order to obtain homogeneous powders. The ginger powder was used for further analysis in an amount of 400 mg each for antioxidants, TFC, and TPC.
DPPH antiradical assay
The evaluation of 1,1-diphenyl-2-picrylhydrazyl (DPPH) radical scavenging activity (DPPH RSA) of samples was carried out according to Ali et al. (2018) and Widodo et al. (2019) with bit modifications. About 1 ml of the sample solution with a certain concentration was added with MeOH in a 10 ml volumetric flask. DPPH-RSA was assessed by measuring the absorbance (Abs) of DPPH• solution 0.4 mM at 517 nm (Abs control) and Abs DPPH• solution added with samples after 30 minutes (Abs sample). All Abs values were corrected with MeOH and ginger samples. DPPH-RSA (in %) was calculated:
DPPH-RSA is expressed as IC50 (the concentration of a sample needed to reduce 50% Abs of DPPH radicals). IC50 value can be depicted graphically by plotting the percentage of RSA of DPPH radicals (y-axis) against the concentration or log concentration of samples (x-axis) to form a linear equation (Waras et al., 2015).
Total determination of phenolic compounds (TPC)
The levels of TPC in ginger samples were determined using Folin-Ciocalteu (F-C) method (Abdullah and Mazlan, 2020) with slight modifications. In a volumetric flask, a certain number of samples were added with 0.5 ml of F-C reagent from Sigma (Aldrich, USA) and 1.5 ml 7.5% sodium carbonate (E. Merck, Germany), and the volume was made into the mark with 7.9 ml distilled water (Ikapharmindo, Indonesia). After that, the sample solution was mixed scrupulously and allowed to stand for 1 hour in a dark place (based on the operating time study). The Abs of blue-colored solutions was measured at 754 nm by using a UV-VIS spectrophotometer (Shimadzu, UV mini-1240, Japan). The TPC of ginger samples was expressed as mg of gallic acid equivalents (mg GAE)/g samples.
Analysis of total flavonoid content (TFC)
TFC was determined (Sukweenadhi et al., 2020) with slight modification. In a volumetric flask, 0.1 g of ginger samples was added along with 4 ml of distilled water, followed by the addition of 0.5 ml solution of AlCl3 2%. The mixture was allowed to stand for 30 minutes. The Abs was scanned at 510 nm using a UV–VIS spectrophotometer (Shimadzu, UV mini-1240, Japan). All analyses were performed in triplicate. The levels of TFC were calculated as mg of quercetin equivalents (mg QE/ g samples).
Scanning of FTIR spectra
The ginger powders are subjected to FTIR spectral measurement without the pellet method. The spectra were scanned using an FTIR spectrophotometer (PerkinElmer), controlled with the operating software of Spectrum 3TM FT-IR. The measurements were done in the mid-infrared region of 4,000–650 cm−1 with a scanning number of 32 and a resolution of 8 cm−1. The used sampling accessory was horizontal attenuated total reflectance composed of ZnSe crystal. FTIR spectral measurement was done without the pellet method.
Chemometrics analysis
The antiradical activities, phenolics contents, and flavonoid contents were expressed as mean ± SD with the aid of Excel software (Microsoft Inc., USA). The Abs values of FTIR spectra were employed as variables during chemometrics modeling. Minitab version 18 (Minitab Inc., USA) was used for the statistical test of one-way ANOVA, followed by a post hoc procedure used for mean comparisons and chemometrics analyses (PCA, HCA).
RESULTS AND DISCUSSION
In this study, the antioxidant activities of Indonesian ginger were evaluated using DPPH-RSA. It is well known that there are phenolics and flavonoids among phytochemicals contributing to antioxidant activity in natural products. Therefore, the studies on natural antioxidants were correlated with TPC and TFC ( Widodo et al., 2019). Phenolics and flavonoid compounds are able to donate hydrogen radicals into DPPH radicals to neutralize DPPH radicals. At the same time, radical phenolics and flavonoids are stabilized by resonance mechanisms. Table 1 compiled the results of DPPH-RSA, TPC, and TFC. The antioxidant activities of TFC and TPC ranging 0.173%–0.704%, 0.039–0.075 g QE/100 g samples, and 0.378–1.106 GAE/100 g samples are shown. Furthermore, the correlation among variables was carried out using a loading plot (LP) of PCA in the next section of the discussion.
Chemometrics analysis of PR of Indonesian ginger
The chemometrics of PCA was used for the classification of Indonesian ginger based on different locations. PCA is essentially a data reduction technique, used to combine the initial variables into new combined variables expressed by first, second, third, etc., on principle components, e.g., PC1, PC2, PC3, …PCn, in which n is the number of original variables. The scores of PC1, PC2, .... PCn are also called latent variables, in which objects or samples having similar values of PC2 will have similar characteristics in terms of variables used during PCA. Based on this fact, PCA is widely explored to classify the studied objects (Gad et al., 2013). Figure 1 exhibited the score plots of PC1 and PC2 of Indonesian ginger using a variable of antioxidant activity, TPC, and TFC.
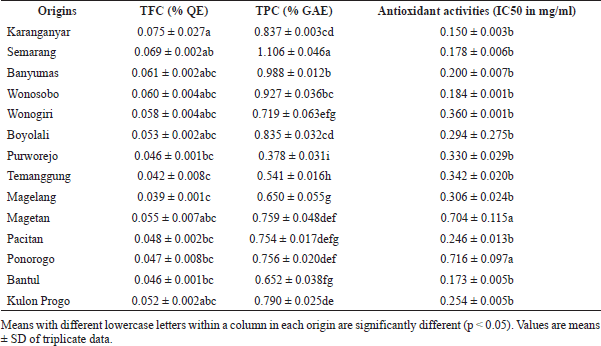 | Table 1. Antioxidant activities of DPPH radical scavenging, TFC, and TPC of powder samples of Z. officinale Roscoe from different regions. [Click here to view] |
In order to correlate these variables (DPPH-RSA, TPC, and TFC), the chemometrics approach based on the LP of PCA was used. LP can be used to explain how the vectors are pinned from the origin point at PC1 = 0 and PC2 = 0. In addition, LP also indicated the weight of each variable to PCs contributing to the score plot of PCs (Mansor et al., 2012). If two vectors (variables) are close forming a small angle approaching 0, the two studied variables are positively correlated; if two variables form an angle of approximately 90°, two variables are not likely to be correlated. When two variables are diverging and form a large angle (about 180°), two variables indicated a negative correlation. Based on this LP in Figure 2, TPC and TFC were highly correlated with R2 of 0.9185, while antioxidant activity revealed a moderate correlation with TPC (R2 = 0.7395) and a high correlation with TFC (R2 = 0.9339). In addition, three variables (antioxidant activity, TFC, and TPC) provide an equal contribution to the score plot of PC1 and PC2 as they had similar distances to origin points (0, 0; PCI, PC2).For clustering among the objects (samples), HCA was employed. HCA is a PR technique intended to provide insight into similarities among the analyzed objects. HCA is based on Euclidian distances in which two samples with the lowest distance will be first joined; therefore, HCA could be used for classification. Objects with the lowest difference in Euclidian distance form one cluster (Popovi?-Djordjevi? et al., 2021). In this study, Indonesian ginger was clustered using a variable of antioxidant activity, TFC, and TPC. Figure 3 exhibited HCA results through the amalgamation step to provide a dendrogram. Objects with the highest similarity (the lowest distance difference) are first joined. In this case, ginger from Semarang is first joined with that from Wonosobo providing a similarity index of 99.31%. This result agreed with that obtained in PCA results (Figure 1) in which the score plots of PC1 and PC2 of gingers from Semarang and Wonosobo were similar.
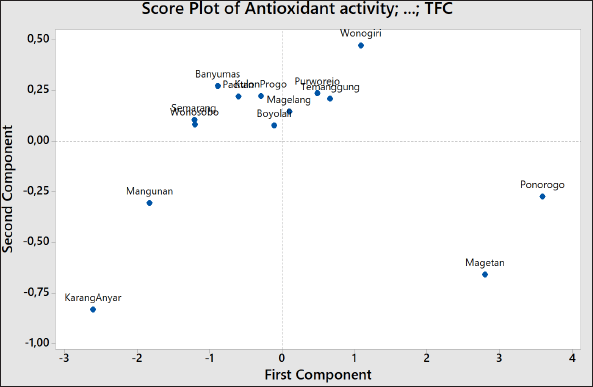 | Figure 1. PCA scores’ plot correlating the PC1 in x-axis and PC2 in y-axis of Indonesian ginger using variable of antioxidant activity, TPC, and TFC. [Click here to view] |
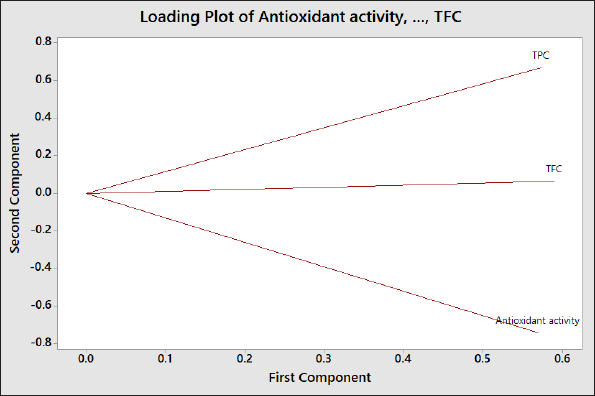 | Figure 2. The LP of PCA using variables of antioxidant activities, TPC, and TFC. [Click here to view] |
Classification of Indonesian ginger using FTIR spectra as variables
Figure 4 depicted attenuated total FTIR spectra of Indonesian ginger from different locations in Indonesia. Due to its property as fingerprinting analytical method, FTIR spectra are excellent variables for the differentiation and characterization of ginger. Based on this fact, FTIR spectroscopy at optimum conditions coupled with chemometrics is widely applied for the characterization of ginger by investigating the peak intensities and the exact wavenumbers of the studied gingers (Yan et al., 2021). Each peak contributing to IR absorption corresponded to functional groups which are summarized in Table 2. Some active compounds in ginger included [6]-gingerol, [8]-gingerol, [10]-gingerol, and [6]-shogaol having the functional groups of –OH, methoxy (−OCH3), conjugated double bond (C=C), carbonyl (C=O), and alkanes. The functional groups present in FTIR spectra supported the active compounds contained in ginger.
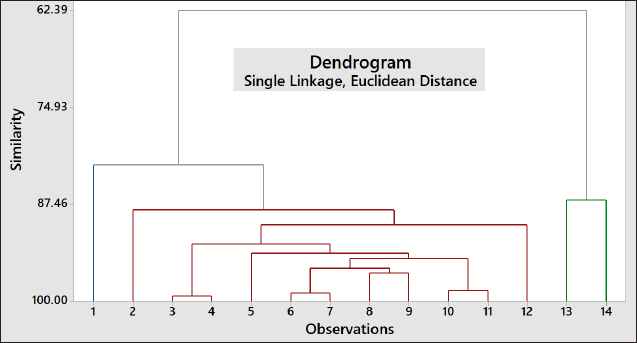 | Figure 3. Cluster analysis expressed by amalgamation step to provide dendrogram for clustering of Indonesian ginger using variable of antioxidant activity, TPC, and TFC. 1: Karanganyar; 2: Mangunan; 3: Semarang; 4: Wonosobo; 5: Banyumas; 6: Pacitan; 7: Kulon Progo; 8: Boyolali; 9: Magelang; 10: Purworejo; 11: Temanggung; 12: Wonogiri; 13: Magetan; and 14: Ponorogo. [Click here to view] |
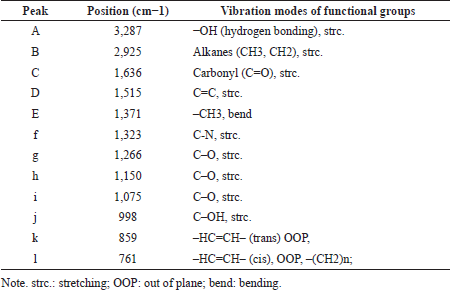 | Table 2. Summary of functional groups corresponding to IR absorption in powder samples of Z. officinale Roscoe in whole range of mid-infrared (4,000–650 cm−1) (primary data, 2021). [Click here to view] |
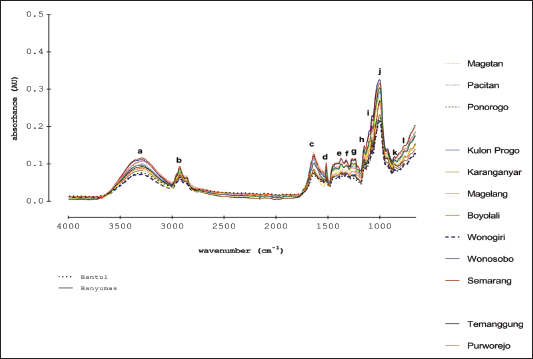 | Figure 4. Attenuated total reflectance- FTIR spectra of gingers obtained from different locations in Indonesia ginger at mid-infrared regions (4,000–650 cm−1). [Click here to view] |
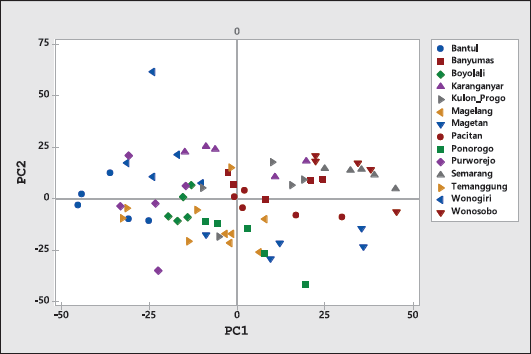 | Figure 5. The score plot of PCA represented by PC1 and PC2 using variable of FTIR spectra in the whole spectra. [Click here to view] |
After the optimization step, PCA using a variable of Abs values at whole wavenumbers was employed. Figure 5 exhibited PCA score plots (PC1 and PC2) of Indonesian ginger using a variable of Abs values at the whole IR region. The objects (Indonesian ginger) were classified successfully and separated clearly. The PCA result using FTIR spectra as a variable agreed with that using antioxidant activity, TPC, and TFC. In both PCA results, gingers from Wonosobo and Semarang revealed the closest PC values, while ginger from Wonogiri exhibited the PC scores which are furthest from each other. The combination of PCA and FTIR spectra could be effective tools for the characterization and differentiation of Indonesian gingers.
CONCLUSION
The chemometrics of PR of PCA and HCA using variables of antioxidant activity, TPC, and TFC, as well as Abs values of FTIR spectra, could provide a reliable and accurate method for the fast differentiation and classification of Indonesian ginger. There is an agreement result between PCA and HCA during the classification and clustering of Indonesian ginger. The developed method can be extended for the geographical origin authentication and the adulteration practice of gingers. Furthermore, with some advantages of FTIR spectra as fingerprinting technique, the combination of FTIR spectra and chemometrics could be proposed as a rapid and green analytical method for the authenticity of herbal components including ginger.
ACKNOWLEDGMENT
The authors are grateful for the Center for Education Financial Services and Indonesia Endowment Funds for Education Scholarship, endowed to the first author (Anita Agustina Styawan) during Ph.D. program at the Faculty of Pharmacy, Universitas Gadjah Mada, Yogyakarta, Indonesia.
LIST OF ABBREVIATIONS
HCA, Hierarchical cluster analysis; LDA, Linear discriminant analysis; PCA, Principal component analysis; SIMCA, Soft independent modeling of class analogy.
AUTHOR CONTRIBUTIONS
All authors made substantial contributions to conception and design, acquisition of data, or analysis and interpretation of data; took part in drafting the article or revising it critically for important intellectual content; agreed to submit to the current journal; gave final approval of the version to be published; and agree to be accountable for all aspects of the work. All the authors are eligible to be an author as per the international committee of medical journal editors (ICMJE) requirements/guidelines.
FINANCIAL SUPPORT
The information regarding financial support and conflict of interest is updated. There is no more updated information.
CONFLICT OF INTEREST
The authors declared that there are no conflicts of interest during this study.
ETHICAL APPROVALS
This study does not involve experiments on animal or human subjects.
DATA AVAILABILITY
All data generated and analyzed are included in this research article.
PUBLISHER’S NOTE
This journal remains neutral with regard to jurisdictional claims in published institutional affiliation.
REFERENCES
Abdullah SSS, Mazlan AN. Quantification of polyphenols and antioxidant activity in several herbal and green tea products in Malaysia. Mater Today Proc, 2020; 31:A106–A13; https://doi.org/10.1016/j.matpr.2020.12.1083 CrossRef
Abdullahi A, Khairulmazmi A, Yasmeen S, Ismail IS, Norhayu A, Sulaiman MR, Ahmed OH, Ismail MR. Phytochemical profiling and antimicrobial activity of ginger (Zingiber officinale) essential oils against important phytopathogens. Arab J Chem, 2020; 13(11):8012–25; https://doi.org/10.1016/j.arabjc.2020.09.031 CrossRef
Ali AMA, El-Nour MEAM, Yagi SM. Total phenolic and flavonoid contents and antioxidant activity of ginger (Zingiber officinale Rosc.) rhizome, callus and callus treated with some elicitors. J Genet Eng Biotechnol, 2018; 16(2):677–82; https://doi.org/10.1016/j.jgeb.2018.03.003 CrossRef
Deng X, Yu J, Zhao M, Zhao B, Xue X, Che C, Meng J, Wang S. Quality assessment of crude and processed ginger by high-performance liquid chromatography with diode array detection and mass spectrometry combined with chemometrics. J Sep Sci, 2015; 38(17):2945–52; https://doi.org/10.1002/jssc.201500294 CrossRef
Ezzat SM, Ezzat MI, Okba MM, Menze ET, Abdel-Naim AB. The hidden mechanism beyond ginger (Zingiber officinale Rosc.) potent in vivo and in vitro anti-inflammatory activity. J Ethnopharmacol, 2018; 214:113–23; https://doi.org/10.1016/j.jep.2017.12.019 CrossRef
Feng X, Kong W, Wei J, Ou-Yang Z, Yang M. HPLC fingerprint analysis combined with chemometrics for pattern recognition of ginger. Pharm Biol, 2014; 52(3):362–7; https://doi.org/10.3109/13880209.2013.837493 CrossRef
Gad HA, El-Ahmady SH, Abou-Shoer MI, Al-Azizi MM. Application of chemometrics in authentication of herbal medicines: a review. Phytochem Anal, 2013; 24(1):1–24; https://doi.org/10.1002/pca.2378 CrossRef
Gong F, Fung YS, Liang YZ. Determination of volatile components in ginger using gas chromatography-mass spectrometry with resolution improved by data processing techniques. J Agric Food Chem, 2004; 52(21):6378–83; https://doi.org/10.1021/jf040102z CrossRef
Kucharska-Ambro?ej K, Karpinska J. The application of spectroscopic techniques in combination with chemometrics for detection adulteration of some herbs and spices. Microchem J, 2019; 153:104278; https://doi.org/10.1016/j.microc.2019.104278 CrossRef
Mansor TST, Man YBC, Shuhaimi M. Employment of differential scanning calorimetry in detecting lard adulteration in virgin coconut oil. JAOCS J Am Oil Chem Soc, 2012; 89(3):485–96; https://doi.org/10.1007/s11746-011-1936-3 CrossRef
Mao Q-Q, Xu X-Y, Cao S-Y, Gan R-Y, Corke H, Beta T, Li H-B. Bioactive compounds and bioactivities of ginger (Zingiber officinale Roscoe). Foods, 2019; 8:1–21; https://doi.org/10.3390/foods8060185 CrossRef
Nile SH, Park SW. Chromatographic analysis, antioxidant, anti-inflammatory, and xanthine oxidase inhibitory activities of ginger extracts and its reference compounds. Ind Crops Prod, 2015; 70:238–44; https://doi.org/10.1016/j.indcrop.2015.03.033 CrossRef
Popovi?-Djordjevi? J, Paunovi? D, Mili? A, Krsti? ?, Siavash Moghaddam S, Roje V. Multi-elemental analysis, pattern recognition techniques of wild and cultivated rosehips from Serbia, and nutritional aspect. Biol Trace Elem Res, 2021; 199(3):1110–22; https://doi.org/10.1007/s12011-020-02199-4 CrossRef
Rafi M, Lim LW, Takeuchi T, Darusman LK. Simultaneous determination of gingerols and shogaol using capillary liquid chromatography and its application in discrimination of three ginger varieties from Indonesia. Talanta, 2013; 103:28–32. CrossRef
Rohaeti E, Rafi M, Syafitri UD, Heryanto R. Fourier transform infrared spectroscopy combined with chemometrics for discrimination of Curcuma longa, Curcuma xanthorrhiza and Zingiber cassumunar. Spectrochim Acta A Mol Biomol Spectrosc, 2015; 137:1244–9; https://doi.org/10.1016/j.saa.2014.08.139 CrossRef
Rostamkhani H, Faghfouri AH, Veisi P, Rahmani A, Noshadia N, Ghoreishi Z. The protective antioxidant activity of ginger extracts (Zingiber Officinale ) in acute kidney injury?: a systematic review and meta-analysis of animal studies. J Funct Foods, 2022; 94:105111; https://doi.org/10.1016/j.jff.2022.105111 CrossRef
Sim C, Hamdan M, Ismail Z, Ahmad M. Assessment of herbal medicines by chemometrics – assisted interpretation of FTIR spectra. Anal Chim Acta, 2004; 1:1–14.
Sukweenadhi J, Yunita O, Setiawan F, Kartini, Siagian MT, Danduru AP, Avanti C. Antioxidant activity screening of seven Indonesian herbal extract. Biodiversitas, 2020; 21(5):2062–7; https://doi.org/10.13057/biodiv/d210532 CrossRef
Waras N, Nurul K, Muhamad S, Maria B, Ardyani IDAAC. Phytochemical screening, antioxidant and cytotoxic activities in extracts of different rhizome parts from Curcuma aeruginosa RoxB. Int J Res Ayurveda Pharm, 2015; 6(5):634–7; https://doi.org/10.7897/2277-4343.065118 CrossRef
Widodo H, Sismindari S, Asmara W, Rohman A. Antioxidant activity, total phenolic and flavonoid contents of selected medicinal plants used for liver diseases and its classification with chemometrics. J Appl Pharm Sci, 2019; 9(6); https://doi.org/10.7324/JAPS.2019.90614 CrossRef
Yan H, Li PH, Zhou GS, Wang YJ, Bao BH, Wu QN, Huang SL. Rapid and practical qualitative and quantitative evaluation of non-fumigated ginger and sulfur-fumigated ginger via fourier-transform infrared spectroscopy and chemometric methods. Food Chem, 2021; 341:128241; https://doi.org/10.1016/j.foodchem.2020.128241 CrossRef
Yudthavorasit S, Wongravee K, Leepipatpiboon N. Characteristic fingerprint based on gingerol derivative analysis for discrimination of ginger (Zingiber officinale) according to geographical origin using HPLC-DAD combined with chemometrics. Food Chem, 2014; 158:101–11; https://doi.org/10.1016/j.foodchem.2014.02.086 CrossRef
Zhu J, Fan X, Cheng Y, Agarwal R, Moore CMV, Chen ST, Tong W. Chemometric analysis for identification of botanical raw materials for pharmaceutical use: a case stusdy using Panax notoginseng. PLoS ONE, 2014; 9(1):1–10; https://doi.org/10.1371/journal.pone.0087462 CrossRef