INTRODUCTION
Mesenchymal-epithelial transition (MET), the proto-oncogenea receptor tyrosine kinase which binds to high-affinity ligand hepatocyte growth factor for activating downstream cell signal pathways (Bang et al., 2020; Esaki et al., 2019; Wu et al., 2021). Abnormal activation of the MET pathway might arise due to high-level MET gene amplification, protein over expression in cancer cells (Baltschukat et al., 2019; Esaki et al., 2019; Wu et al., 2021). One of these activation mechanisms involves the gaining of gene mutations which lead to METexon 14 skipping (METex14) through mRNA splicing. The mutation that leads to METex14 are observed in about 3%–4% of patients suffering from nonsmall cell lung cancer (NSCLC) (Moreno et al., 2021; Wu et al., 2021). The NSCLC is responsible for almost 85% of lung cancers (Upadhya et al., 2020; Wu et al., 2021).
Capmatinib is an oral drug for small-molecule MET inhibition with potent activity against preclinical cancer models across various tumors including NSCLC (Baltschukat et al., 2019; Esaki et al., 2019; Glaenzel et al., 2020; Liu et al., 2011; Vansteenkiste et al., 2019; Wolf et al., 2020).
Tabrecta™ (Capmatinib) is used for treating adults diagnosed with NSCLC where tumors possess mutation resulting in METex14. Capmatinib designated chemically as 2-fluoro-N-methyl-4-{7-[(quinolin-6-yl)methyl]imidazo[1,2-b][1,2,4]triazin-2-yl}benzamide with molecular formula of C23H17FN6O and having molecular weight of 412.43 g/mol (Fig. 1) (FDA, 2020; Novartis, 2020; PubChem, 2021).
Literature on Capmatinib revealed that only one analytical method was developed for the estimation of Capmatinib in rat plasma by LC-MS/MS (Fan et al., 2020). The method was reported for the analysis of rat plasma. There is a need of LC-MS/MS technique for the analysis of biological samples, which will be useful in pharmacokinetic, pharmacodynamics, and forensic studies. In the present work, we developed a method based on the human plasma and applied the same method for healthy rabbits.
MATERIALS AND METHODS
Materials
Capmatinib (99% purity), [13CD3] Capmatinib (98% purity) were procured from Novartis, India. Drug free human plasma having K2-EDTA was obtained from Red Cross blood bank, Hyderabad, India. Milli-Q water purification system (Millipore, USA) was utilized for HPLC-water in the research work. HPLC grade methanol, acetonitrile, ammonium acetate and formic acid (HCOOH) were obtained from local market. The pharmacokinetic study on healthy rabbits was approved by the Institutional Ethical Committee with Ethical no: 1447/PO/Re/S/11/24/A.
Equipment
A modular LC system (Shimadzu LC-20ADvp, Japan) with an SIL-HTC auto sampler, comprising of LC-20AD solvent delivery module coupled with API 6000 applied Biosystems/sciex tandem MS, Canada was used for the research work. The software, version: 1.4.2 applied bio system was used.
Calibration standards
The stock solution of Capmatinib and [13C, D3] Capmatinib (IS) were prepared separately in acetonitrile. The serial dilution of the stock was prepared by adding 20 μl of the diluted samples of Capmatinib to 960 μl of K2EDTA pooled samples. Then, 20 μl of each IS sample was added to obtain 1.0–28,000.0 ng/ml concentration and stored at −20°C in a freezer.
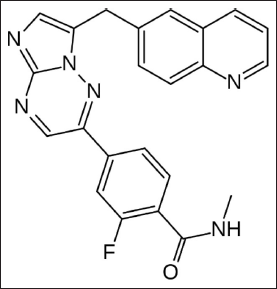 | Figure 1. Structure of Capmatinib. [Click here to view] |
Quality control (QC) standard
Three levels of low quality control (LQC), median quality control (MQC), and highest quality control (HQC) were prepared. The drug-free plasma is spiked with Capmatinib to get the concentration (conc.) of 3.0, 14,000.00, and 21,000.00 ng/ml for LQC, MQC and HQC, respectively, and stored at −20°C.
Chromatography condition
The separation performed on Phenomenex Luna C18 column (50 mm × 2 mm, 5 μm particle size) with 0.1% HCOOH, methanol and ACN as mobile phase in the ratio of 10:20:70 with a flow rate of 0.5 ml/minute and quantity of 10 μl. The run time was 2.00 minutes at oven temperature of 40°C and sample temperature of 5°C.
Mass system parameters
Mass spectrometry was performed with an electro spray ionization (ESI) source in the +ve ionization mode with multiple reaction monitor (MRM) using the following conditions (Table 1) : auxiliary gas flow 30 psi and nebulizer gas flow 25 psi; capillary voltage—3,500 (V); and tube lens voltage—110 (V). Source temperature was set at 280°C. Quadrupoles Q1 and Q3 were fixed at unit resolution. The MRM transitions observed were m/z 413.15–128.05 for Capmatinib and m/z 416.20–131.01 for the internal standard. The samples evaluated by linear regression analysis using the analyst software 1.4.2. Data evaluated by peak area ratio (Fan et al., 2020; He et al., 2018; Saraner et al., 2019).
Sample preparation
For sample preparation, 100 μl of samples, 50 μl of internal standard working solution were mixed and vortexed for 5.0 minutes. The drug was extracted using 3 ml of 0.5% ammonium hydroxide in water and centrifuged at 2,000 rotations per minute for 15 minutes at 4.0°C. After solid phase extraction, the extract was evaporated to dryness. The sample was diluted with 300 μl of ACN, and evaluated by injection of 10 μl of each sample into LC-MS/MS equipment using ESI technique.
Method validation
The developed method was validated as per FDA (2001) and EMA (2011) for following parameters.
 | Table 1. Mass spectrometric parameters. [Click here to view] |
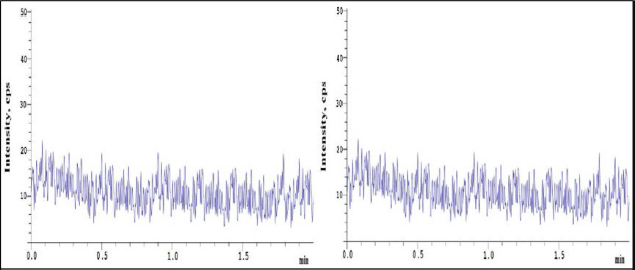 | Figure 2. Blank chromatograms (CHR) of sample and IS. [Click here to view] |
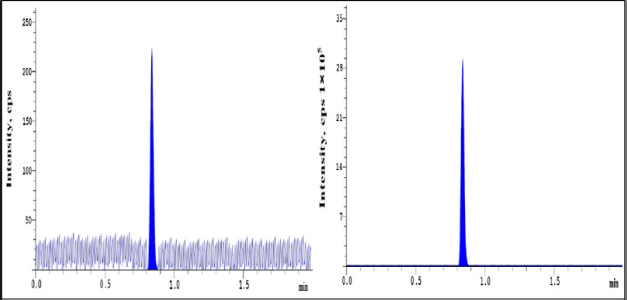 | Figure 3. LLOQ CHR of sample and IS. [Click here to view] |
Selectivity
Eight different human K2 EDTA plasma samples were analyzed to demonstrate the lack of interferences at the retention time (RNT) of analyte and IS (Saraner et al., 2019).
Linearity and sensitivity
The calibration plot constructed among the peak area ratios of analyte and IS against nominal concentration (NOC) of the analyte standards with analyte concentration ranging from 1.0 to 28,000.00 ng/ml. The curve was plotted for blank sample and eight different concentration samples (Bhatt and Rajkamal, 2017; Fan et al., 2020).
Recovery studies
Recovery was determined by the comparison of results of extracted sample with those of spiked plasma samples after extraction. Recovery analyzed at three levels and comparative study carried out between mean analyte responses of six extracted samples and diluted standard solutions (Saraner et al., 2019).
The precession and accuracy (P and A)
The P and A were analyzed by injection of QC samples in six replicates in three batches. This process was carried out on three successive days in order to evaluate inter-day P and A (IN P and A) (Fan et al., 2020; Saraner et al., 2019).
Matrix effect
Six plasma samples (including hemolytic and lipemic plasma) free from interference at RNT of analyte and IS. Evaluations carried out at LQC and HQC concentration in six replicates (Saraner et al., 2019).
Carryover effect
Carryover effect was analyzed by determination of peak area by injection of blank matrix in sequence post injection of highest calibration standard sample.
 | Table 2. Extraction recovery rates of Capmatinib and internal standard. [Click here to view] |
Stability studies
The plasma samples at two QC concentrations analyzed at various conditions and plotted against fresh samples (3.0 and 21,000 ng/ml, n = 6) as follows:
Freeze thaw stability
The samples were frozen at −70°C. After three freeze thaw cycles, the stability was estimated.
Short term temperature stability
Solutions of Capmatinib and IS were prepared in acetonitrile (Stability Samples) and were kept at 25°C for 24 hours. A freshly prepared solution of Capmatinib and stability sample were diluted to similar analyte concentrations and evaluated for six replicate injections.
Stock solution stability
The Capmatinib and stability samples were stored at −20°C 20 days. A fresh solution of Capmatinib and stability samples were approximately diluted to analyte concentration and analyzed for six replicate injections and analyzed.
Bench-top stability
This was examined by storing six samples of spiked plasma with LQC and HQC at 25°C for about 5 hours and processed with freshly prepared calibration standards.
Auto sampler stability
The LQC and HQC of each sample were placed in auto-sampler at 10°C for 24 hours and stability of the samples examined.
Wet extract stability
The LQC and HQC samples of ever analyte were placed at 25°C for 6 hours. The mean concentration for stability samples should be 85%–115% of the mean concentration of freshly prepared samples (Bhatt and Rajkamal, 2017).
Pharmacokinetic evaluation
The study was carried on six healthy white rabbits (subjects) of both sex (2–3 kg). Animals were housed at 25°C, RH 45% with 12 hours alternating light/ dark cycles, 100% fresh air swap. The rabbits were provided with standard diet and water. Post oral administration of 25 mg/kg of Capmatinib, the blood samples collected into polypropylene tubes filled with EDTA solution at specified time slots till 24.0 hours following administration. The plasma isolated by centrifugation of samples at 6,000 rpm for 10 minutes and preserved at −20°C. About 10 μl of plasma samples loaded into LC-MS/MS system and the pharmacokinetic parameters were evaluated by a non-compartmental method analysis using Win Nonlin 3.3® pharmacokinetic software (Pharsight Mountain View, CA) (Fan et al., 2020; Glaenzel et al., 2020; Zhou et al., 2020).
RESULTS AND DISCUSSION
Method validation
Selectivity
Selectivity of the method shows the lack of interferences at RNT of analyte and IS when peak response in blank samples were compared to response of spiked LLOQ samples which contain IS mixtures (Figs. 2 and 3).
Linearity and sensitivity
Calibration curve was linear with linearity equation y = 0.0016x + 0.05234 and coefficient of correlation (r2) value > 0.999 (0.9992). The LLOQ concentration of the method was 1.0 ng/ml for Capmatinib. The results shown the sensitivity of the method. The superior signal-to-noise ratio indicated at this concentration shown that the LLOQ can further be reduced.
Recovery and matrix effect
The mean overall recovery around QC levels for Capmatinib was 96.26%–100.77%. The recovery of IS was measured in a comparable manner using corresponding medium QC samples as reference. Mean recovery of IS was 96.94% and the results were presented in Table 2 (Figs. 4–6). The % CV of LQC and HQC were 4.94% and 4.30% for Capmatinib (Table 3).
The P and A
The intra-batch P and A was within 97.61%–101.56% and the precision was within 1.28%–4.03%. The inter-batch accuracy ranged between 94.59% and 106.00% and the precision was within 1.86%–4.72% (CV). The inter-batch accuracy ranged between 97.33% and 108.78% with a p value of 1.06%–4.04% (CV). The values, were <15% for all the concentrations, which are within the acceptable limit (Table 4).
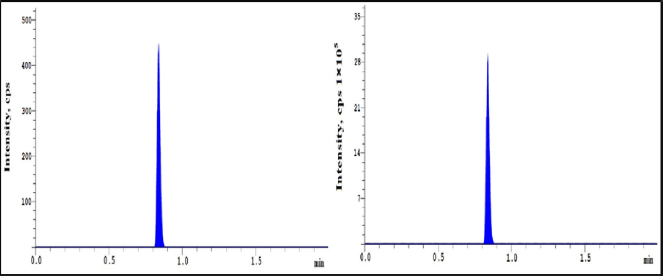 | Figure 4. CHR of Capmatinib at LQC and IS. [Click here to view] |
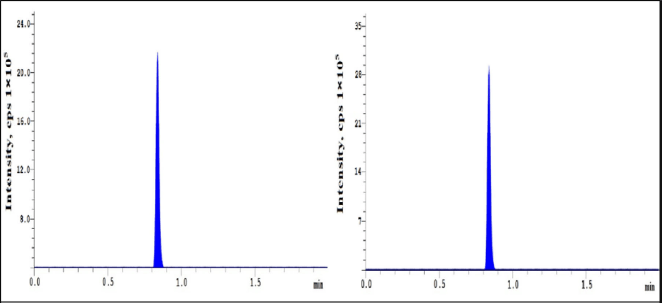 | Figure 5. CHR of Capmatinib at MQC and IS. [Click here to view] |
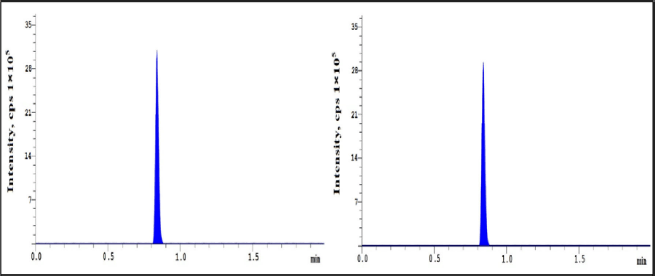 | Figure 6. CHR of Capmatinib at HQC and IS. [Click here to view] |
 | Table 3. Results of Capmatinib matrix effects. [Click here to view] |
 | Table 4. Intra-batch and inter-batch P and A. [Click here to view] |
 | Table 5. Stability results of Capmatinib. [Click here to view] |
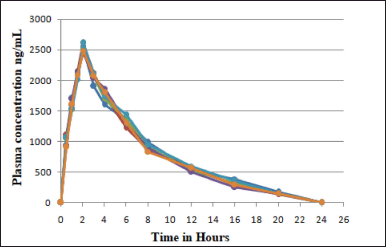 | Figure 7. Plasma concentration-time graph of six healthy subjects. [Click here to view] |
Carryover effect
The blank matrix samples were evaluated in sequence post evaluation of highest calibration standard sample. No carryover effect was observed.
Stability
From the stability studies, Capmatinib was found to be stable at the studied conditions and the stability results were shown in Table 5. The p value was <15% and % stability was between 85% and 115% for the analyte.
Pharmacokinetic studies
The study was carried out in rabbits (subjects) and plasma concentration–time curve of Capmatinib post oral administration was shown in Figure 7 and Table 6. The mean of Cmax and Tmax were 2,537.94 ± 12.42?ng/ml and 2.01 ± 0.03, respectively. Plasma concentration reduced with t1/2 of 10.03 ± 0.44. AUC0→Last value obtained was 12,964.14 ± 635.97?ng.hour/ml, respectively (Table 7).
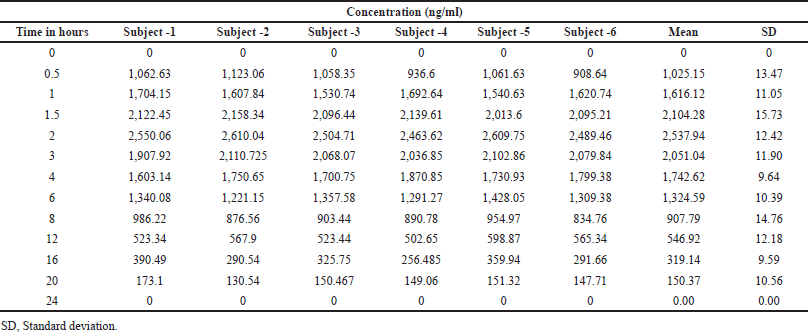 | Table 6. Plasma conc. at various time interval of six rabbits (subject). [Click here to view] |
 | Table 7. Pharmacokinetics data of rabbits (subject). [Click here to view] |
CONCLUSION
A new, effortless, and sensitive LC-MS/MS technique was developed for the estimation of Capmatinib in human plasma by solid phase extraction and reproducible recoveries for analyte and IS with insignificant interference and matrix effect. The technique was validated in according with FDA guideline within concentration of 1.0–28,000.00 ng/ml for Capmatinib with the correlation coefficient value of 0.9992. The reported method was established for the analysis of rat plasma. There is a need for the analysis of Capmatinib in human plasma samples. The linearity ranges in the reported method also less. In the present work, we developed a method based on artificial human plasma and also applied the same method to pharmacokinetic study in healthy rabbits. The intraday and inter-day P and A within 4.72% and the assay accuracy was 96.73%–102.34% of the nominal values. Matrix effect was within 1.21 with a %CV of 4.94 for analyte at LQC and at HQC, the matrix effect was within 1.16 with a %CV of 4.30. Stabilities revealed that the method has high degree of stability. From the pharmacokinetic data, the mean of Cmax and Tmax were 2,537.94 ± 12.42 ?ng/ml and 2.01 ± 0.03, respectively. Plasma concentration decline with t1/2 of 10.03 ± 0.44. AUC0→Last value obtained was 12,964.14 ± 635.97? ng.hour/ml, respectively. The developed method was effectively applied for pharmacokinetics study of Capmatinib in biological matrix for future studies.
AUTHOR CONTRIBUTIONS
All authors made substantial contributions to conception and design, acquisition of data, or analysis and interpretation of data; took part in drafting the article or revising it critically for important intellectual content; agreed to submit to the current journal; gave final approval of the version to be published; and agree to be accountable for all aspects of the work.
CONFLICTS OF INTEREST
The authors report no conflicts of interest in this work.
FUNDING
There is no funding for the research.
ETHICAL APPROVALS
The pharmacokinetic study on healthy rabbits was approved by the Institutional Ethical Committee with Ethical no: 1447/PO/Re/S/11/24/A.
DATA AVAILABILITY
All data generated and analyzed are included within this research article.
PUBLISHER’S NOTE
This journal remains neutral with regard to jurisdictional claims in published institutional affiliation.
REFERENCES
Bang YJ, Su WC, Schuler M, Nam DH, Lim WT, Bauer TM, Azaro A, Poon RTP, Hong D, Lin CC, Akimov M, Ghebremariam S, Zhao S, Giovannini M, Ma B. Phase 1 study of Capmatinib in MET-positive solid tumor patients: dose escalation and expansion of selected cohorts. Cancer Sci, 2020; 111(2):536–47. CrossRef
Baltschukat S, Engstler BS, Huang A, Hao HX, Tam A, Wang HQ, Liang J, DiMare MT, Bhang HC, Wang Y, Furet P, Sellers WR, Hofmann F, Schoepfer J, Tiedt R. Capmatinib (INC280) is active against models of non-small cell lung cancer and other cancer types with defined mechanisms of MET activation. Clin Cancer Res, 2019; 25(10):3164–75. CrossRef
Bhatt D, Rajkamal B. A UPLC-MS/MS method development and validation for the estimation of sofosbuvir from human plasma. Int J Appl Pharm, 2017; 9(1):30–6. CrossRef
Capmatinib (Rx)-Medscape. Available via https://reference.medscape.com/drug/tabrecta-capmatinib-4000068
EMA. Guideline on bioanalytical method validation. 2011. Canary Wharf, London E14 5EU, United Kingdom.
Esaki T, Hirai F, Makiyama A, Seto T, Bando H, Naito Y, Yoh K, Ishihara K, Kakizume T, Natsume K, Myers A, Doi T. Phase I dose escalation study of Capmatinib (INC280) in Japanese patients with advanced solid tumors. Cancer Sci, 2019; 110(4):1340–51. CrossRef
Fan X, Yang G, Cui W, Liu Q, Zhang Z, Zhang Z. Development and full validation of an LC-MS/MS methodology to quantify capmatinib (INC280) following intragastric administration to rats. Biomed Chromatogr, 2020; 34:e4768. CrossRef
FDA. FDA guidance for industry: bioanalytical method validation. US Department of Health and Human Services, Food and Drug Administration, Centre for Drug Evaluation and Research (CDER), Center for Veterinary Medicine (CVM), 2001.
FDA. FDA grants accelerated approval to Capmatinib for metastatic non-small cell lung cancer-highlights of prescribing information. US Food and Drug Administration (FDA), 2020. Available via https://www.accessdata.fda.gov/drugsatfda_docs/label/2020/213591s000lbl.pdf
Glaenzel U, Jin Y, Hansen R, Schroer K, Rahmanzadeh G, Pfaar U, van Lier JJ, Borell H, Meissner A, Camenisch G, Zhao S. Absorption, distribution, metabolism, and excretion of Capmatinib (INC280) in HEalthy male volunteers and in vitro aldehyde oxidase phenotyping of the major metabolite. Drug Metab Dispos, 2020; 48(10):873–85. CrossRef
He G, Mai L, Wang X. Development and validation of an HPLC-MS/MS method for rapid simultaneous determination of cefprozil diastereomers in human plasma. Int J Anal Chem, 2018; 6959761:1–9. CrossRef
Liu X, Wang Q, Yang G, Marando C, Koblish HK, Hall LM, Fridman JS, Behshad E, Wynn R, Li Y, Boer J, Diamond S, He C, Xu M, Zhuo J, Yao W, Newton RC, Scherle PA. A novel kinase inhibitor, INCB28060, blocks c-MET-dependent signaling, neoplastic activities, and cross-talk with EGFR and HER-3.Clin Cancer Res, 2011; 17:7127–38. CrossRef
Moreno V, Greil R, Yachnin J, Majem M, Wermke M, Arkenau HT, Basque JR, Nidamarthy PK, Kapoor S, Cui X, Giovannini M. Pharmacokinetics and safety of Capmatinib with food in patients with MET-dysregulated advanced solid tumors. Clin Ther, 2021; 4:6. CrossRef
Novartis. Tabrecta (Capmatinib) tablets 150 mg, 200 mg. Novartis Pharmaceuticals Corporation. 2020. Available via https://www.hcp.novartis.com/products/tabrecta/met-exon-14-skipping-mutation-nsclc/
PubChem. PubChem compound summary for CID 25145656, Capmatinib. National Center for Biotechnology Information, 2021. Available via https://pubchem.ncbi.nlm.nih.gov/compound/Capmatinib
Saraner N, Karagoz A, Guney B, Saglam O. Determination of Dasatinib in human plasma by using liquid chromatography-tandem mass spectrometry. Int J Anal Bioanal Methods, 2019; 1:2. CrossRef
Upadhya A, Yadav KS, Misra A.. Targeted drug therapy in non-small cell lung cancer. Clinical significance and possible solutions-Part I. Exp Opin Drug Deliv, 2020; 18(1):73–102. CrossRef
Vansteenkiste JF, Van De Kerkhove C, Wauters E, Van Mol P. Capmatinib for the treatment of non-small cell lung cancer. Expert Rev Anticancer Ther, 2019; 18(8):659–71. CrossRef
Wolf J, Seto T, Han JY, Reguart N, Garon EB, Groen HJM, Tan DSW, Hida T, de Jonge M, Orlov SV, Smit EF, Souquet PJ, Vansteenkiste J, Hochmair M, Felip E, Nishio M, Thomas M, Ohashi K, Toyozawa R, Overbeck TR, de Marinis F, Kim TM, Laack E, Robeva A, Le Mouhaer S, Waldron-Lynch M, Sankaran B, Balbin OA, Cui X, Giovannini M, Akimov M, Heist RS, GEOMETRY mono-1 Investigators. Capmatinib in MET Exon 14–Mutated orMET-amplified non-small-cell lung cancer. N Engl J Med, 2020; 383:944–57. CrossRef
Wu YL, Smit EF, Bauer TM. Capmatinib for patients with non-small cell lung cancer with MET exon 14 skipping mutations. A review of preclinical and clinical studies. Cancer Treat Rev, 2021; 95:102173. CrossRef
Zappa C, Mousa SA. Non-small cell lung cancer: current treatment and future advances. Transl Lung Cancer Res, 2016; (5):288–300. CrossRef
Zhou C, Tian J, Lin P, Liu T, He A, Fang L, Sun L. Quantitation of Capmatinib, a mesenchymal-epithelial transition factor inhibitor by UPLC-MS/MS in rat plasma and its application to a pharmacokinetic study. Bioanalysis, 2020; 12(5):285–93. CrossRef