INTRODUCTION
Jatropha spp., locally known as Jarak, belongs to the Euphorbiaceae family. Jatropha curcas and J. multifida are the most common species found in Indonesia. Jatropha curcas is widely cultivated as biodiesel feedstock (Ezeldin Osman et al., 2021; Shamsi and Babazadeh, 2022) and for phytoremediation of ex-mining lands rich in heavy metals (Bhatt et al., 2021; Riyazuddin et al., 2022), while J. multifida was developed as an ornamental plant. In Indonesia, ethnopharmacologically, the sap from the leaves and bark of this plant is generally used traditionally to treat wounds. Both species are reported to have anti-inflammatory, antimicrobial, anticancer, antiviral, antidiabetic, and anticoagulant activities (Abdelgadir and Van Staden, 2013; Srinivasan et al., 2019). However, this species has also been reported to have toxicity, especially to the seed organ (Dong et al., 2022).
Fourier transform infrared (FTIR) spectroscopy is a part of vibrational spectroscopy that provides the fingerprint information of fundamental vibrations of the chemical structure of materials in a nondestructive testing technology that has been widely used in various fields (Taylan et al., 2021). Compared to chemical detection, standardization, and quality control in herbal medicines, infrared spectroscopy combined with chemometrics is a quicker identification, reliable, effective, and low-cost method that is more convenient (Wu et al., 2022). A combination of FTIR and chemometrics can be applied to classify medicinal plants using fingerprint analysis, for example, classification of Sida rhombifolia from different growing locations (Rohman et al., 2021); Andrographis paniculata based on planting age and the solvent extraction method used (Kautsar et al., 2021); discrimination of Curcuma longa, Curcuma xanthorrhiza, and Zingiber cassumunar from different locations (Rohaeti et al., 2015); differentiation of wild and cultivated agarwood (Yao et al., 2022); and quality grade discrimination from Gastrodia elata powder (Zhan et al., 2022).
Closely related plant species may have similar compositions of compounds, but their metabolism is influenced by several factors, such as altitude, planting age, growing location, and water requirements (Kautsar et al., 2021; Rohaeti et al., 2015; Rohman et al., 2021; Umar et al., 2021). The three sampling locations in this study have different altitudes, affecting the levels of secondary metabolites. At higher altitudes, soil pH and soil micronutrient content decrease, attributed to lower mineralization processes at lower pH. Some compounds increase in response to different altitudes. These secondary metabolites help adapt stressed plants to different environmental conditions (Hashim et al., 2020). In addition, these two species are widely used as raw materials for traditional medicine. They have different pharmacological effects (Sabandar et al., 2013), thus allowing errors in the selection and adulteration of raw materials. For this reason, quality control of Jatropha species becomes crucial and discrimination between the two species in this study has not been previously reported. However, because of the complex spectral data from plant samples, it is not easy to distinguish them visually. Therefore, chemometric techniques are needed to overcome them. Our literature study has shown no reports applying FTIR-based combined metabolomics fingerprinting and chemometrics to classify and discriminate J. curcas and J. multifida and their organs from different regions. The application of chemometrics methods, mainly principal component analysis (PCA) and orthogonal partial least square-discriminant analysis (OPLS-DA), was undertaken to discriminate and identify the key functional group between different types of plants from different geographical origins (Nasr et al., 2022; Yao et al., 2022). The OPLS-DA score plot model has also been applied to identify markers of functional groups and metabolites from samples (Yao et al., 2022). This study aims to classify J. curcas and J. multifida (species and plant organs) from different growing locations based on a combination of FTIR spectrum data with chemometric analysis using PCA and identification of functional group markers using OPLS-DA.
MATERIALS AND METHODS
Plant material and chemicals
Jatropha curcas and J. multifida samples were collected from different regions (Toraja Utara, Tana Toraja, Maros, Gowa, and Makassar) in South Sulawesi (Table 1). The plant parts used are leaves and stem bark. Potassium bromide (KBr) was purchased from Sigma-Aldrich (St. Louis, MO) for spectroscopy grade.
Sample preparation
All samples were sieved, dried, and pulverized before use. In this experiment, the powder samples (10 mg) were blended with KBr (90 mg) disks. The powdered samples were pressed to the germanium crystal surface for spectra collection.
FTIR spectra acquisition
The FTIR spectra of samples were scanned using an FTIR spectrophotometer (Nicolet™ iS10 FTIR, Thermo Scientific™, USA), controlled with the OMNIC™ software (Thermo Scientific™, USA). The measurements were carried out in 4,000–400 cm–1 with 16 scans at a resolution of 16 cm–1 and an interval of 1.928 cm–1 using horizontal attenuated total reflectance (HATR) composed of germanium crystal type. All FTIR spectra were corrected against the FTIR spectrum of air as background. In addition, FTIR was recorded in five replications as absorbance values at each data point. FTIR analysis was used as a qualitative technique for analyzing the functional groups of materials. This analysis was used to obtain the spectrum pattern from the sample of plant parts, i.e., leaves and stem bark. Then, the obtained spectrum and functional groups were analyzed by chemometrics to identify, discriminate, group, and detect any functional groups that might be potential markers to distinguish J. curcas and J. multifida.
Data analysis
The processed data wavenumber from FTIR analysis was analyzed using MetaboAnalyst 5.0 (https://www.metaboanalyst.ca/) for multivariate data analysis (MVDA) (Xia and Wishart, 2016). The principal component analysis evaluated the score plot for sample grouping, similarities, and differences among species and plant parts. Furthermore, OPLS-DA was used for separation between the two Jatropha species (J. curcas and J. multifida). In addition, VIP scores were used to screen potential characteristic functional groups in the samples. Sample normalization by median and the Pareto scaling (data scaling) were chosen for PCA and OPLS-DA analysis. MVDA results were subjected to several validation tools such as permutation value (R2 and Q2) and VIP to confirm the reliability of the OPLS-DA model (Lim et al., 2022).
RESULTS AND DISCUSSION
Sample
Sample powder was used as a substitute for the extract to avoid bias in the FTIR analysis. The presence of solvent extraction such as water and alcohol will produce a stretching vibration pattern –OH at 3,200–3,500 cm–1 (Rohman et al., 2021).
Spectroscopy characteristics
In this study, we evaluated the capability of rapid, nondestructive, reliable, and robust FTIR spectroscopy coupled with multivariate analyses for discrimination of J. curcas and J. multifida. The typical representative FTIR spectra of the Jatropha sample powder are shown in Figure 1, and the overall sample spectra are shown in Figure S1.
The characteristic FTIR peaks were initially used to distinguish the different substances (Zhan et al., 2022). The FTIR spectra of the leaves and stem bark samples from both species showed the same pattern but showed differences in the intensity of the peak transmittance. Each peak and shoulder in FTIR spectra corresponded to functional groups and are responsible for infrared absorption from metabolites in J. curcas and J. multifida (Akin Geyik et al., 2022). The spectral patterns formed on the leaves and stems bark of the two species show a noticeable difference, with wavenumbers 2,848 cm–1 (leaves) and 1,421 cm–1, 1,384 cm–1, 1,247 cm–1, and 1,156 cm–1 (stem bark). The peak near 2,848 cm–1 corresponds to C–H (alkane, aldehyde) asymmetric stretching vibration. 1,421 cm–1 is attributed to C–C (aromatic) bending vibration. The spectral bands near 1,384 cm–1 correspond to C–H (alkanes) bending vibration. The peak near 1,247 and 1,156 cm–1 is assigned to C–O (esters, ethers, alcohol, and carboxylic acid) stretching vibration and C–N (aliphatic amine) stretching vibration. The fingerprint area at 1,000–400 cm−1 has the same pattern but different absorbance (Gad and Bouzabata, 2017; Rohaeti et al., 2015; Rohman et al., 2021; Wang et al., 2021). The functional groups present in the samples and their relative abundance (absorbance values) with a hierarchical cluster analysis (HCA) model in the form of a heatmap are shown in Figure 2. According to Vilkickyte and Raudone (2021), sunshine duration, temperature, air humidity, longitudes, altitudes of collecting locations, and macronutrients in the soil significantly affect the levels of compounds from plants.
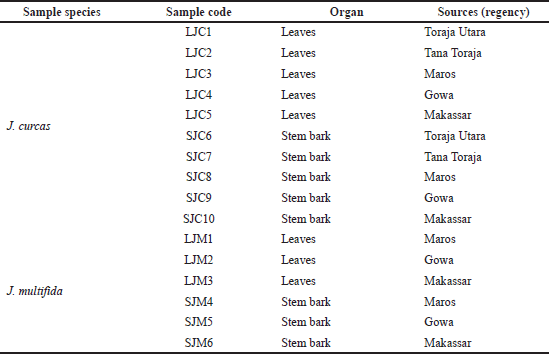 | Table 1. Sources of plant samples in South Sulawesi. [Click here to view] |
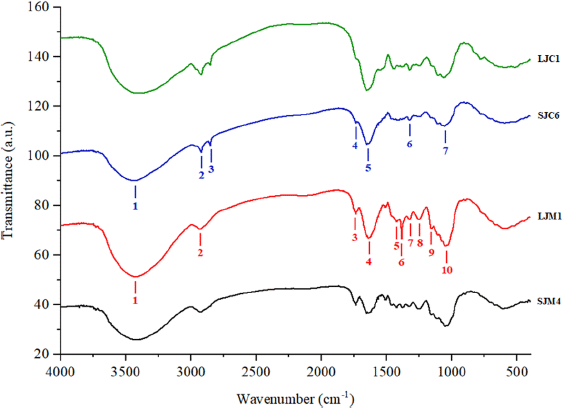 | Figure 1. Representative FTIR spectrum of leaves (LJC1) and stem bark (SJC6) of J. curcas and leaves (LJM1) and stem bark (SJM4) of J. multifida in the 400–4,000 cm−1 region. The different main peaks are numbered below the spectra. [Click here to view] |
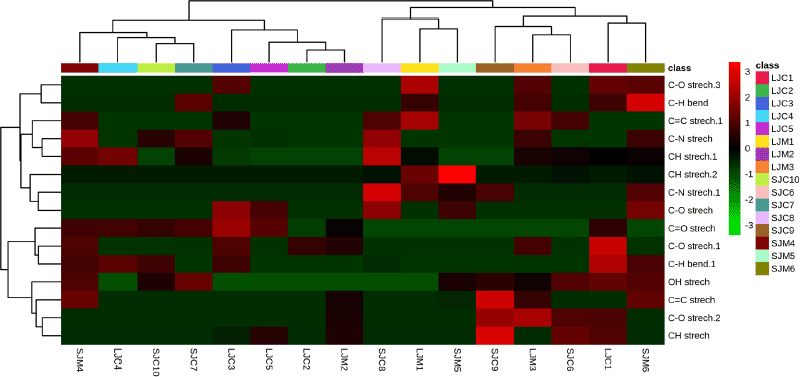 | Figure 2. Heatmap analysis representing the functional group of leaves and stem bark from J. curcas and J. multifida. The color scale shows the relative abundance of each functional group. Each row represents the functional group and each column represents a sample. [Click here to view] |
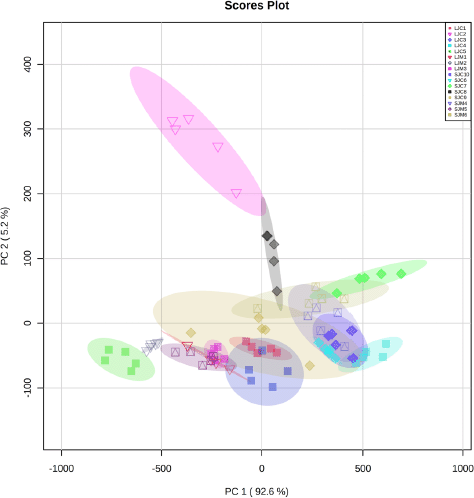 | Figure 3. PCA score plots for the main components (PC-1) and (PC-2) on all samples of Jatropha spp. generated by FTIR analysis and the separation of 16 clusters. [Click here to view] |
PCA carried out exploratory analysis with FTIR spectral data in 4,000–400 cm–1. The PCA score plot is shown in Figure 3. The principal components (PC) showed 97.8% (PC-1, 92.6% and PC-2, 5.2%) of explained variance when the spectra FTIR data were analyzed using PCA. The total PC values on leaves and stem bark discrimination of J. curcas (Fig. S2) and J. multifida (Fig. S3) were 97.65 (PC-1, 93.1% and PC-2, 4.5%) and 98.8% (PC-1, 88.7% and PC-2, 10.1%), respectively. We also performed an analysis of the leaves and stems of each sample. The total PC value of J. curcas and J. multifida (Fig. S4) leaves was 98.5%, while that of the stem bark (Fig. S5) was 98.1%. In this study, PCA and HCA, as some unsupervised pattern recognition techniques, have been used to obtain information on sample grouping patterns, similarities, and differences between plant species and parts (Batsukh et al., 2020; Umar et al., 2021). The total PC value obtained from each sample analysis shows an outstanding accuracy in grouping samples based on species, organs, and geographic origin (Umar et al., 2021). The sample group close to the central coordinate point (0,0) is similar. On the contrary, further away from the central coordinate point shows a high difference with each sample (Khan et al., 2015).
The OPLS-DA was used to identify the functional groups with the highest ranking using the VIP value parameters, and it is imperative to consider the VIP value in interpreting the OPLS-DA data. Four functional groups were identified (CH stretching, C–H bending, C–O stretching, and C=C stretching) based on the VIP score greater than 1.0 (Fig. 4). Functional groups with VIP values > 1 are thought to play an important role in distinguishing J. curcas and J. multifida (Mashiane et al., 2021).
Using the OPLS-DA loading S-plot (Fig. 5), CH stretching and C–O stretching vibration were identified as functional groups separating J. curcas and J. multifida. The loading S-plot model was also used to identify differentiating compounds in the cooking method of pumpkin leaves (Momordica balsamina L.) (Mashiane et al., 2021) and authentication of saffron spice accessions (Hegazi et al., 2022).
In this study, we also embedded sample information into the OPLS-DA model to use the power of metabolite abundance in-group discrimination and used permutation tests to verify and evaluate the quality of the OPLS-DA model. Thus, we performed a supervised multivariate analysis to see if the functional groups’ information alone could discriminate the two samples (Misra et al., 2019; Pan et al., 2022; Worley and Powers, 2016). The T-score and orthogonal T-score values are 1.6% and 90.4%, respectively (Fig. 6). The values obtained can clearly distinguish the two species of J. curcas (JC) and J. multifida (JM). The highest permutations value of R2 (0.919) and Q2 (0.89) (Fig. S6) for the OPLS-DA model indicates that the model was stable and suitable for fitness and prediction (Pan et al., 2022). This combination approach between FTIR and chemometrics has proven to effectively discriminate the species and organs of J. curcas and J. multifida. Because of its benefits, the combination of these methods can be used as one of the standard methods in identifying raw materials from plants in the future.
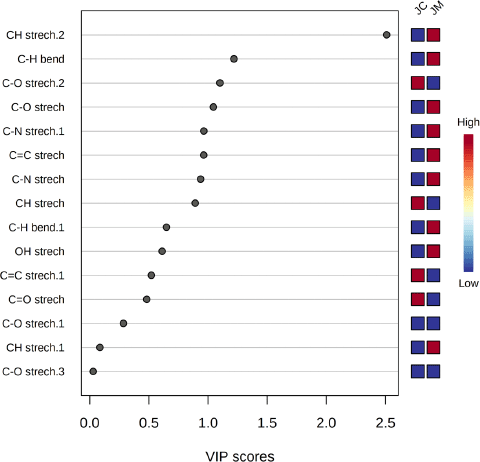 | Figure 4. VIP scores of functional groups in OPLS-DA. Their absorbance values represent the most abundant functional groups of JC (J. curcas) and JM (J. multifida). On the right, the colored boxes indicate the relative abundance of the functional groups. Red color indicates a high level and blue color indicates a low level. [Click here to view] |
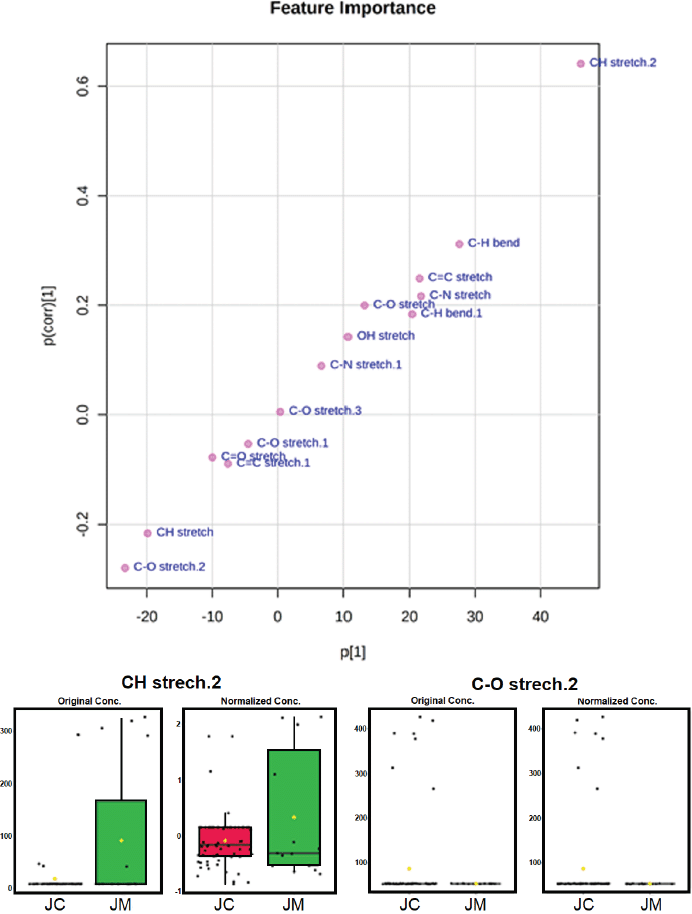 | Figure 5. The OPLS-DA loading S-plot and the functional groups responsible for the separation of Jatropha samples. [Click here to view] |
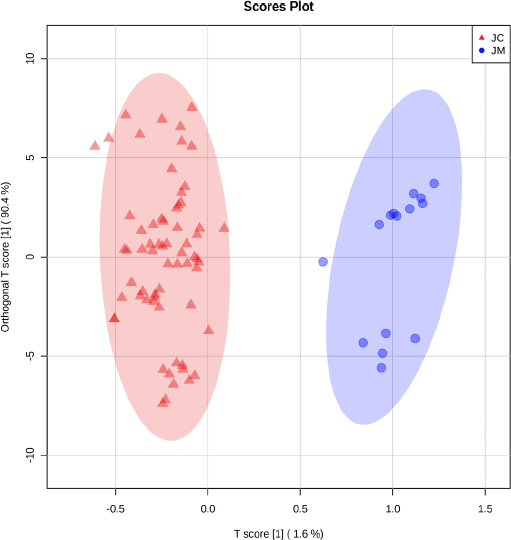 | Figure 6. The OPLS-DA score plot shows the separation of two clusters for J. curcas (JC) and J. multifida (JM). [Click here to view] |
CONCLUSION
In this study, FTIR spectroscopic data combined with chemometric techniques with PCA and OPLS-DA could classify J. curcas and J. multifida from different regions with clear separation and identify the main functional groups that distinguish the two species. As a safe technique, this method was developed because of free solvent and minimal sample preparation. Therefore, this method could be considered an alternative, fast, and reliable method for species discrimination, authentication, quality control, and standardization of herbal medicines.
AUTHORS’ CONTRIBUTIONS
Abdul Halim Umar and Reny Syahruni conceptualized and designed the research. Abdul Halim Umar and Imanuel Ranteta’dung carried out the research activities, data acquisition, data interpretation, and statistical analysis. Abdul Halim Umar prepared the manuscript. Abdul Halim Umar, Reny Syahruni, and Mohamad Rafi critically analyzed the manuscript. All authors read and agreed on the published version of the manuscript.
CONFLICT OF INTEREST
There is no conflict of interest.
FUNDING
This study is self-funded.
REFERENCES
Abdelgadir HA, Van Staden J. Ethnobotany, ethnopharmacology and toxicity of Jatropha curcas L. (Euphorbiaceae): A review. S Afr J Bot, 2013; 88:204–18. CrossRef
Akin Geyik G, Peker Cengiz B, Tugrul F, Karuk Elmas SN, Yilmaz I, Arslan FN. A rapid diagnostic approach for gastric and colon cancers via Fourier transform mid–infrared spectroscopy coupled with chemometrics from paraffin–embedded tissues. Spectrochim Acta A, 2022; 267:120619. CrossRef
Batsukh Z, Toume K, Javzan B, Kazuma K, Cai S-Q, Hayashi S, Kawahara N, Maruyama T, Komatsu, K. Metabolomic profiling of Saposhnikoviae Radix from Mongolia by LC–IT–TOF–MS/MS and multivariate statistical analysis. J Nat Med, 2020; 74:170–88. CrossRef
Bhatt P, Ganesan S, Santhose I, Durairaj T. Phytoremediation as an effective tool to handle emerging contaminants. Phys Sci Rev, 2021; 415:129040. CrossRef
Dong R, Chen F, Zhang F, Yang S, Liu H, Wang H, Hu J. A comprehensive evaluation on pyrolysis kinetics, thermodynamics, product properties and formation pathways of Jatropha oil for high-value utilization. Fuel, 2022; 313:122982. CrossRef
Ezeldin Osman M, Sheshko TF, Dipheko TD, Abdallah NE, Hassan EA, Ishak CY. Synthesis and improvement of Jatropha curcas L. biodiesel based on eco-friendly materials. Int J Green Energy, 2021; 18:1396–404. CrossRef
Gad HA, Bouzabata A. Application of chemometrics in quality control of Turmeric (Curcuma longa) based on Ultra-violet, Fourier transform-infrared and 1H NMR spectroscopy. Food Chem, 2017; 237:857–64. CrossRef
Hashim AM, Alharbi BM, Abdulmajeed AM, Elkelish A, Hozzein WN, Hassan HM. Oxidative stress responses of some endemic plants to high altitudes by intensifying antioxidants and secondary metabolites content. Plants, 2020; 9:869. CrossRef
Hegazi NM, Khattab AR, Frolov A, Wessjohann LA, Farag MA. Authentication of saffron spice accessions from its common substitutes via a multiplex approach of UV/VIS fingerprints and UPLC/MS using molecular networking and chemometrics. Food Chem, 2022; 367:130739. CrossRef
Kautsar A, Wahyuni WT, Syafitri UD, Muflihah S, Mawadah N, Rohaeti E, Arif Z, Prajogo B, Amran, MB, Rohman A, Rafi M. Data fusion of UV-Vis and FTIR spectra combined with principal component analysis for distinguishing of Andrographis paniculata extracts based on cultivation ages and solvent extraction. Indones J Chem, 2021; 21: 753–60. CrossRef
Khan MA, Abbasi BH, Shah NA, Yücesan B, Ali H. Analysis of metabolic variations throughout growth and development of adventitious roots in Silybum marianum L. (Milk thistle), a medicinal plant. Plant Cell Tiss Organ Cult, 2015; 123: 501–10. CrossRef
Lim V, Chong HW, Samad NA, Abd Ghafar SA, Ismail IS, Mohamed R, Yong YK, Gan CY, Tan JJ. Vibrational spectroscopy-based chemometrics analysis of Clinacanthus nutans extracts after postharvest processing and extract effects on cardiac C-Kit cells. Evid Based Complemen Alternat Med, 2022; 1967593. CrossRef
Mashiane P, Manhivi VE, Shoko T, Slabbert RM, Sultanbawa Y, Sivakumar D. Cooking African pumpkin leaves (Momordica balsamina L.) by stir-frying improved bioactivity and bioaccessibility of metabolites-metabolomic and chemometric approaches. Foods, 2021; 10:2890. CrossRef
Misra BB, Ruiz-Hernández IM, Hernández-Bolio GI, Hernández-Núñez E, Díaz-Gamboa R, Colli-Dula RC. 1H NMR metabolomic analysis of skin and blubber of bottlenose dolphins reveals a functional metabolic dichotomy. Comp Biochem Physiol Part D, 2019; 30:25–32. CrossRef
Nasr EG, Epova EN, de Diego A, Souissi R, Hammami M, Abderrazak H, FX Donard O. Trace elements analysis of Tunisian and European extra virgin olive oils by ICP-MS and chemometrics for geographical discrimination. Foods, 2022; 11:82. CrossRef
Pan L, Zhou C, Jing J, Zhuang M, Zhang J, Wang K, Zhang H. Metabolomics analysis of cucumber fruit in response to foliar fertilizer and pesticides using UHPLC-Q-Orbitrap-HRMS. Food Chem, 2022; 369:130960. CrossRef
Riyazuddin R, Nisha N, Ejaz B, Khan MIR, Kumar M, Ramteke PW, Gupta R. A comprehensive review on the heavy metal toxicity and sequestration in plants. Biomolecules, 2022; 12:43. CrossRef
Rohaeti E, Rafi M, Syafitri UD, Heryanto R. Fourier transform infrared spectroscopy combined with chemometrics for discrimination of Curcuma longa, Curcuma xanthorrhiza and Zingiber cassumunar. Spectrochim Acta Part A, 2015; 137:1244–9. CrossRef
Rohman A, Ikhtiarini AN, Setyaningsih W, Rafi M, Aminah NS, Insanu M, Irnawati I, Santosa D. The use of chemometrics for classification of sidaguri (Sida rhombifolia) based on FTIR spectra and antiradical activities. Indones J Chem, 2021; 21:1568–76. CrossRef
Sabandar CW, Ahmat N, Mohd Jaafar F, Sahidin I. Medicinal property, phytochemistry and pharmacology of several Jatropha species (Euphorbiaceae): A review. Phytochemistry, 2013; 85:7–29. CrossRef
Shamsi M, Babazadeh R. Estimation and prediction of Jatropha cultivation areas in China and India. Renew Energy, 2022; 183: 548–60. CrossRef
Srinivasan N, Palanisamy K, Mulpuri S. Jatropha: phytochemistry, pharmacology, and toxicology. In: Mulpuri S, Carels N, Bahadur B (eds.). Jatropha, challenges for a new Energydua crop: a sustainable multipurpose crop, Springer, Singapore, pp 415–35, 2019;. CrossRef
Taylan O, Cebi N, Sagdic O. Rapid screening of Mentha spicata essential oil and L-Menthol in Mentha piperita essential oil by ATR-FTIR spectroscopy coupled with multivariate analyses. Foods, 2021; 10:202. CrossRef
Umar AH, Ratnadewi D, Rafi M, Sulistyaningsih YC. Untargeted metabolomics analysis using FTIR and UHPLC-Q-Orbitrap HRMS of two Curculigo species and evaluation of their antioxidant and α-glucosidase inhibitory activities. Metabolites, 2021; 11:42. CrossRef
Vilkickyte G, Raudone L. Phenological and geographical effects on phenolic and triterpenoid content in Vaccinium vitis-idaea L. leaves. Plants, 2021; 10:1986. CrossRef
Wang L, Li X, Wang Y, Ren X, Liu X, Dong Y, Ma J, Song R, Wei J, Yu Ax, Fan Q, Shan D, Yao J, She G. Rapid discrimination and screening of volatile markers for varietal recognition of Curcumae Radix using ATR-FTIR and HS-GC-MS combined with chemometrics. J Ethnopharmacol, 2021; 280:114422. CrossRef
Worley B, Powers R. PCA as a practical indduaicator of OPLS-DA model reliability. Curr Metabolomics, 2016; 4:97–103. CrossRef
Wu L, Gao Y, Ren W, Su Y, Li J, Du Y, Wang Q, Kuang H. Rapid determination and origin identification of total polysaccharides contents in Schisandra chinensis by near-infrared spectroscopy. Spectrochim Acta Part A, 2022; 264:120327. CrossRef
Xia J, Wishart DS. Using MetaboAnalyst 3.0 for comprehensive metabolomics data analysis. Curr Protoc Bioinformatics, 2016; 55:14.10.1–14.10.91. CrossRef
Yao C, Qi L, Zhong F, Li N, Ma Y. An integrated chemical characterization based on FT-NIR, GC–MS and LC-MS for the comparative metabolite profiling of wild and cultivated agarwood. J Chromatogr B, 2022; 1188:123056. CrossRef
Zhan W, Yang X, Lu G, Deng Y, Yang L. A rapid quality grade discrimination method for Gastrodia elata powder using ATR-FTIR and chemometrics. Spectrochim Acta Part A, 2022; 264:120189. CrossRef
SUPPLEMENTARY MATERIAL
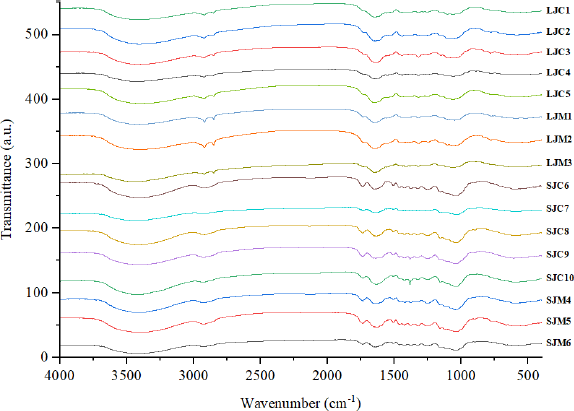 | Figure S1. FTIR spectra using Jatropha spp. powdered samples from different regions. [Click here to view] |
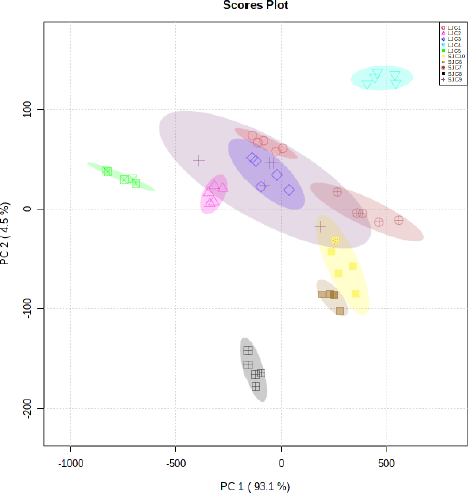 | Figure S2. Score plot of the PCA model for grouping leaves and stem bark of J. curcas. [Click here to view] |
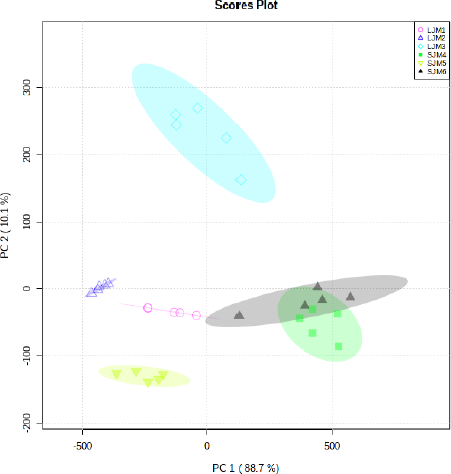 | Figure S3. Score plot of the PCA model for grouping leaves and stem bark of J. multifida. [Click here to view] |
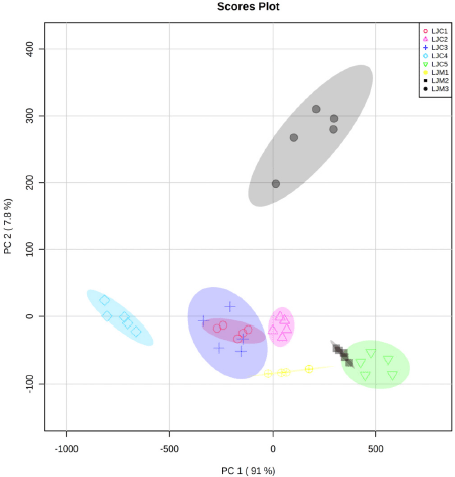 | Figure S4. Score plot of the PCA model for grouping leaves of J. curcas and J. multifida. [Click here to view] |
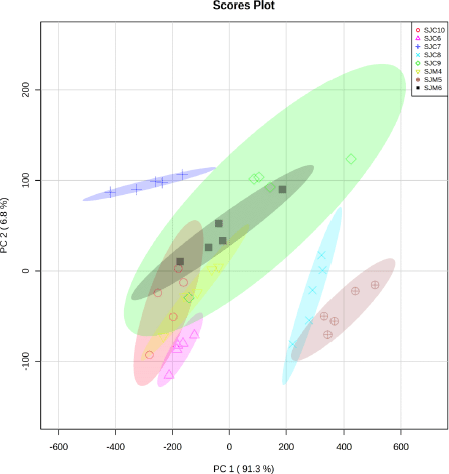 | Figure S5. Score plot of the PCA model for grouping stem bark of J. curcas and J. multifida. [Click here to view] |
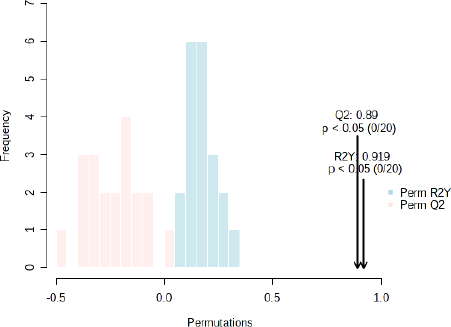 | Figure S6. Permutation values for the OPLS-DA model indicate that the model is stable and suitable for fitness and prediction. [Click here to view] |