INTRODUCTION
Teneligliptin (TEN) is a dipeptidyl peptidase (DPP)-4 inhibitor, the consumption of TEN with healthy food and regular physical practice as a comprehensive treatment of type 2 diabetes is successful to control high blood sugar. The intake of TEN increases the level of incretin hormones, which control the blood sugar level by balancing insulin release, particularly after meals.
In practice, multiple steps are involved in drug synthesis; hence, it is essential to take into account the unreacted raw materials, intermediates, impurities from the process, and degradation products while providing the rationale for impurities. Also, the residual solvents and catalysts may exist in the pharmaceuticals through the manufacturing process of drugs (Goda and Kadowaki, 2013; Kishimoto, 2013; Kutoh et al., 2014; Sharma et al., 2016). Hence, it is very important to analyze, identify, and possibly control or remove all substances other than the drug, as long as they do not provide any therapeutic benefits (United States Pharmacopoeia, 2016).
In the synthesis of TEN, tert-butyl(2S,4S)-4-(4-(3-methyl-1-phenyl-1H-pyrazol-5-yl)piperazin-1-yl)-2-(thiazolidine-3-carbonyl)pyrrolidine-1-carboxylate is an intermediate with the Boc group (Fig. 1). The deprotection of Boc using 1-octanesulfonic acid (Kumar et al., 2017) afforded teneligliptinoctanesulfonic acid salt, which upon further workup provided TEN with octanesulfonic acid (carcinogen), and methyl 1-octanesulfonate (MOS), ethyl 1-octanesulfonate (EOS), and butyl 1-octanesulfonate (BOS) (known as potential genotoxic impurities (PGIs)) by reacting with the process solvents. In fact, the impurities are neither completely controlled nor removed simply by practical manufacturing techniques (European Council of Health and Consumers, 2012; International Conference on Harmonization ICH, 2011). However, it is very crucial to control all the impurities by process optimization (to prove the effective control strategy of the drug process) to meet the requirements of the European Medicines Agency (EMA), International Council for Harmonization (ICH), and United States Food and Drug Administration (USFDA).
 | Figure 1. Deprotection of Boc using octane sulphonic acid to obtain Teneligliptin. [Click here to view] |
The genotoxic/carcinogenic impurity limit has been defined by the USFDA and EMA guidelines as the “threshold of toxicological concern” (TTC). TTC exposure of 1.5 g/day of mutagenic impurities is considered an insignificant risk. A predicted daily dose of a patient can be used to calculate the ppm limit of genotoxic impurities in the TTC-derived drug. The recommended maximum dose of TEN is 40 mg/day.
The average of MOS, EOS, and BOS should not exceed 37.5 ppm of TEN per day. Therefore, it is important to have a suitable analytical technique with good sensitivity, preciseness, and accuracy for the estimation of MOS, EOS, and BOS impurities in drug substances. But the available gas chromatography-mass spectrometry (GC-MS) and liquid chromatography–mass spectrometry (LC-MS) methods (designed based on the different volatility of sulfonate esters) are useful to eliminate certain impurities only. Specifically, to detect the methyl methanesulfonate (MMS), ethyl methanesulfonate (EMS), and methyl isopropylsulfonates in Active pharmaceutical ingredient (API) and/or formulated products, the GC-MS methods are effective (Ramakrishna et al., 2008; Wollein and Schramek, 2012; Zhang et al., 2016), whereas using either a simple LC-MS or tandem mass spectrometry (LC-MS/MS) mesylates in benzenesulfonate and/or in p-toluenesulfonates were detected (Kakadiya et al., 2011; Taylor et al., 2006). In addition, a headspace GC-MS in-situ derivatization method for the concurrent measurement of methyl, ethyl, and isopropyl esters of methane/benzene/p-toluenesulfonates, and other sulfates in drug substances was successful (Ahirrao et al., 2020; Alzaga et al., 2007), but already a nonderivatization method was reported for the abovementioned sulfonates by LC- Atmospheric pressure chemical ionization (APCI)-MS/MS (Jin et al., 2019).
On the other hand, alkyl sulfonates and dialkylsulfonates in drug substances were detected by electrospray ionization mass spectrometry detection and hydrophilic interaction chromatography separation technique (An et al., 2008). The HPLC–UV method was employed to detect the methyl and ethyl mesylates and tosylates by derivatization (Li et al., 2019; Nageswari et al., 2011; Wang et al., 2022), and at an LOQ of 0.60 ppm was effective in the detection of EMS and MMS (Zhou et al., 2017).
Based on the literature strategy, we understand that there is neither a specific nor generalized method to determine the genotoxic MOS, EOS, and BOS. Thus, we were motivated to develop a suitable, selective and sensitive method for the estimation of the abovementioned genotoxic sulfonate ester impurities. Consequently, the following attempts were made to estimate even a trace level of those PGIs in TEN by GC-MS.
MATERIALS AND METHODS
Materials
MOS, EOS, BOS, dichloromethane (DCM), acetonitrile (MeCN), and methanol (MeOH) solvent were purchased from Sigma-Aldrich, India.
Optimized GC-MS conditions
The following chromatographic parameters were optimized during the method development to obtain an acceptable peak shape and recoveries to meet the GC system aptness: (a) flow rate (0.8–1.5 mL at constant flow), (b) initial column oven temperature (60–150°C), (c) temperature ramp, (d) injector temperature, (e) detector temperature, (f) split ratio (2:1–10:1), (g) injection volume, (h) diluent (DCM, MeCN, and MeOH), and (i) columns.
During the method optimization, a variety of capillary GC columns, like HP-5, DB-1, DB-1701, and DB-624, with varied film thickness were tested. Among them, DB-624 (60 m length, 0.25 mm, 1.4 μm film thickness) and DB-1701 (30 m length, 0.25 mm, 1 μm film thickness) have had acceptable retention periods. However, a sensible level of retention, sensitivity, resolution, and chromatographic selectivity with a stable baseline was attained with DB-1701 (than the other) through the helium carrier gas.
The MOS (m/z 97), EOS (m/z 111), and BOS (m/z 112) were studied through scan mode from 29 to 150 Da to fix the selective ion monitoring (SIM) process.
As an outcome of various trials, the following method was identified as the best one (optimized) with a single quadrupole mass spectrometer (Agilent 5977B GC/MSD, USA) using the DB-1701 capillary column with the injection volume of 1 μl through a 5:1 split inlet.
The GC oven ramping temperature was initially maintained at 80°C for 2 minutes, then raised to 220°C at the rate of 20°C/minute and held for 11 minutes. Afterward, it was raised to 240°C at the rate of 20°C/minute and held for 9 minutes.
Summary of the optimized parameters are as follows: injector temperature: 240°C; GC-MS interface: 250°C; quad temperature: 150°C, ion source temperature: 230°C; flow rate: 1.0 ml/minute; carrier gas: helium; ionizing energy: 70 eV; solvent delay: 11 minutes; gain factor: 5.0; detector off: 19.0 minutes; SIM mode mass spectra (Fig. 2): MOS (m/z 97), EOS (m/z 111), and BOS (m/z 112). The GC-MS mass hunter software was employed to the analysis and identification of the chemicals was achieved by National Institute of Standards and Technology mass spectral data.
Diluent
The diluent used was DCM.
Blank solution
DCM was the diluent; its chromatogram is shown in Figure 3.
Standard stock preparation
Each 75 mg of MOS, EOS and BOS was transferred into separate 50 ml standard flasks and diluted. Then, 2.5 ml of each solution was diluted to 10 ml.
Standard solution preparation
1.0 ml of standard stock was diluted to 50 ml. The chromatogram of the standard solution is shown in Figure 4.
Sample preparation
200 mg of the sample was diluted to 5 ml; the chromatogram of the sample is shown in Figure 5.
RESULTS AND DISCUSSION
Method validation
The current analytical procedure is validated by the International Conference for Harmonization (ICH, 2005) recommendations (United States Food and Drug Administration USFDA, 2015).
System suitability
The standard solutions (37.5 ppm) of MOS, EOS, and BOS were injected as a part of the system suitability and the data are presented in Table 1. The percentage of relative standard deviation (%RSD) area of MOS, EOS, and BOS peaks was obtained from six preparations of standard solution. The observed %RSD values of MOS (6.25), EOS (4.84), and BOS (5.71) are in the acceptance limit (i.e., %RSD < 15), and hence the system is suitable for the estimation of the abovementioned sulfonate esters in TEN.
Specificity
Specificity study was carried out by injecting the solvents used during the manufacturing process of TEN. As an outcome of the study, no interference was observed at the retention time of the analyte components.
Limit of detection and limit of quantification
As stated in the ICH guidelines for analytical method validation, the calibration curve method was used for the determination of LOD and LOQ values (Table 2). The LOD values of MOS, EOS, and BOS are 0.74, 0.68, and 0.61 ppm (Fig. 6) and LOQ values are 2.48, 2.25, and 2.03 ppm, respectively (Fig. 7). The %RSD peak areas of MOS, EOS, and BOS obtained from six LOQ preparations are 5.3, 2.6, and 2.7, respectively.
Linearity
Linearity was carried out in the range of LOQ to 150% and the correlation coefficients were 0.9980, 0.9981, and 0.9979 for MOS, EOS, and BOS, respectively. In addition, the slope and regression coefficient data of the abovementioned sulfonates are given in Table 3.
Table 3 indicates the system suitability (which passes the acceptance criteria) as follows: (i) the correlation coefficient of MOS, EOS, and BOS are more than 0.99; and (ii) the %RSD areas of each solvent peak obtained from the six preparations of linearity levels 1 and 6 are not more than 15.
Precision and accuracy
Precision of this method was verified by injecting six replicate preparations of the standard solution (37.5 ppm) of MOS, EOS, and BOS, and as a consequence, the %RSD of the six replicates were 5.8, 4.2, and 8.1, respectively. The complete data is shown in Table 4; the low %RSD is within the acceptance criteria and thus precision of this method is witnessed.
Recovery was carried out by spiking the samples of MOS, EOS, and BOS at the QL level: 50%, 100% (Fig. 8), and 150 % (Table 5). Based on the limits, the recovery should be between 80% and 120% for all precision levels of MOS, EOS, and BOS. From the obtained accuracy values, it is observed that the average recoveries are within the acceptable limit, and hence the method is accurate.
Robustness
Method robustness was assessed by studying the impact of small variations in the temperature of oven, injector, and detector to evaluate the impact on the peak area of MOS, EOS, and BOS at 37.5 ppm. The %RSD of the octane sulfonates peak area is summarized in Table 6. The %RSD of the standard solution of the modified and optimized GC conditions were all within ±10.0%. The data in Table 6 demonstrate the robustness of this method.
Acceptance criteria: The %RSD of peak areas should be ≤15% for all the six injections.
Method recommendation
There are a considerable number of reports on the other sulfonates, such as MMS, EMS, IMS or analogous besylates and tosylates, which are comparatively lower boiling chemicals than the octane sulfonates, such as MOS, EOS, and BOS. To the best of our knowledge, there is no report on the estimation of octane sulfonates; hence, we made this attempt on the higher boiling octane sulfonates. As a result, the chromatographic conditions and validation parameters are effective in the estimation of them in TEN.
The method is simple, efficient, and sensitive, and particularly does not require any derivatization process, which can be directly employed to estimate the octane sulfonates in a short time with high sensitivity. The standard test procedure of MOS, EOS, and BOS content in TEN by GC-MS is provided in Table 7. The LODs and LOQs of MOS, EOS, and BOS are 0.74, 0.68, and 0.61 and 2.48, 2.25, and 2.03 ppm, respectively. The sensitivity of this method is comparable to the analogous lower boiling methyl, ethyl, and isopropyl methane sulfonates, where the LODs and LOQs are reported in ng/g to ppm (Ahirrao et al., 2020; Kakadiya et al., 2011; Liu et al., 2019; Wollein and Schramek 2012). The linearity, %RSD, and mean recoveries are comparable and even better than a few of the abovementioned reports. In fact, it is not a straightforward comparison of the validation parameters of these higher boiling octane sulfonates with the lower boiling methane sulfonates. However, the present study excels its importance by a simple GC-MS technique even without derivatization, unlike the abovementioned reports.
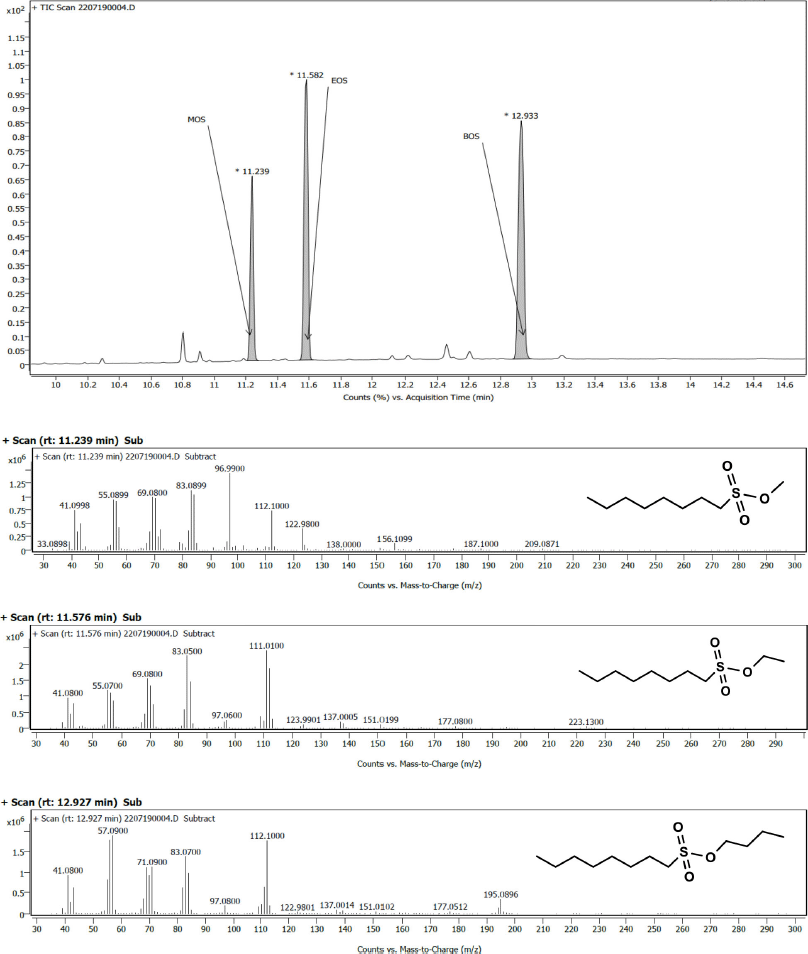 | Figure 2. GC-MS mass pattern of MOS, EOS and BOS standards. [Click here to view] |
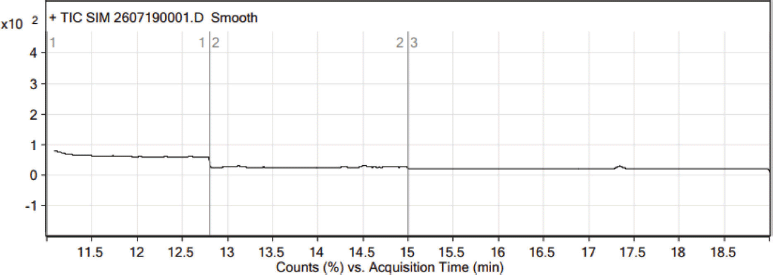 | Figure 3. Typical blank chromatogram. [Click here to view] |
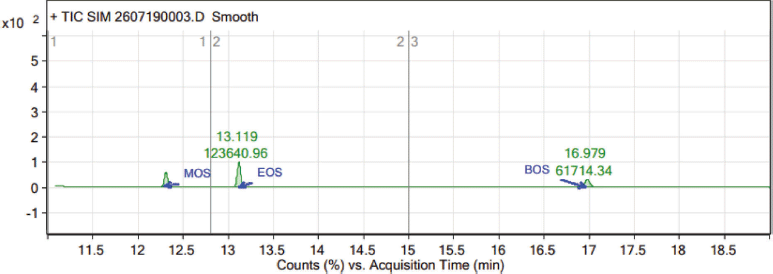 | Figure 4. Typical standard chromatogram. [Click here to view] |
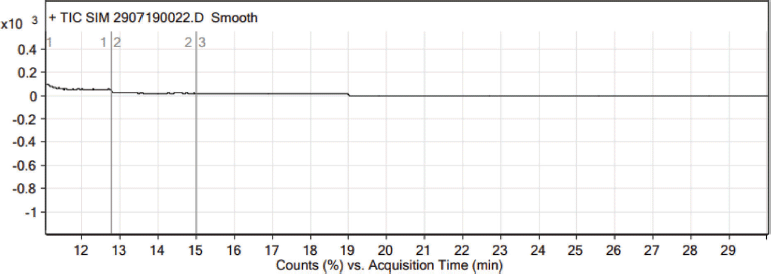 | Figure 5. Typical sample chromatogram. [Click here to view] |
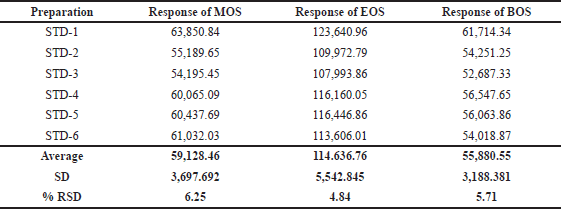 | Table 1. System suitability data for standard samples. [Click here to view] |
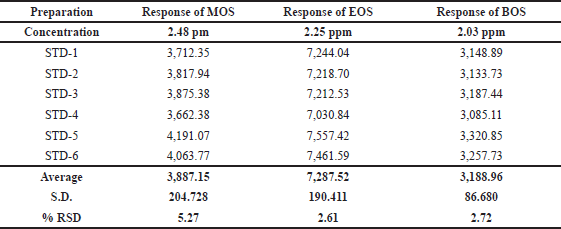 | Table 2. Precision at LOQ level. [Click here to view] |
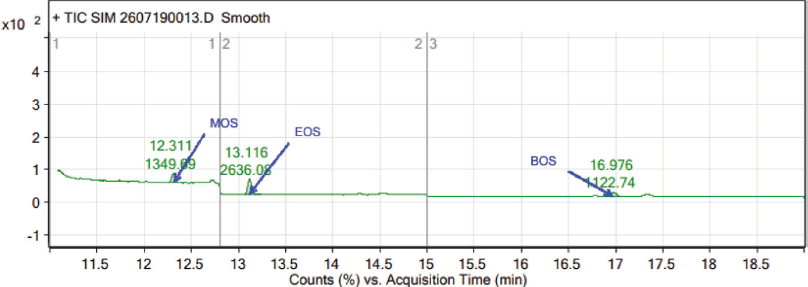 | Figure 6. Typical LOD chromatogram. [Click here to view] |
Hence, based on the validation parameters, we strongly recommend this method even for trace-level estimation of octane sulfonates not only in gliptins, also for a wide range of pharmaceuticals as it does not require derivatization and is easy to adapt in any industrial laboratories.
Mass spectral analysis
In the GC-MS, the observed retention time of 12.3, 13.1, and 17.0 minutes authenticated the presence of MOS, EOS, and BOS, respectively. In the mass spectrum of MOS (C9H20O3S, 208.11), the major fragments reflect the m/z of 123, 112, 97, 83, and 69. As shown in the mass spectrum of EOS (C10H22O3S, 222.13) peaks associated with major fragments reflect the m/z of 111, 83, and 69. In the BOS mass spectrum (C12H26O3S, 250.16), m/z 123, 112, 83, and 71 are the major fragments. The analysis of fragmentation pattern of the mass spectra (Fig. 2) clearly supports the presence of MOS, EOS, and BOS impurities in TEN.
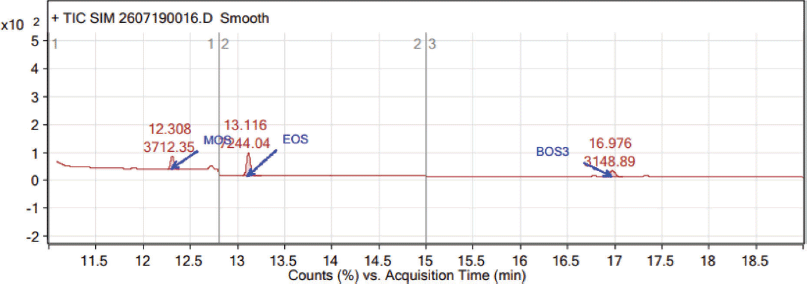 | Figure 7. Typical LOQ chromatogram. [Click here to view] |
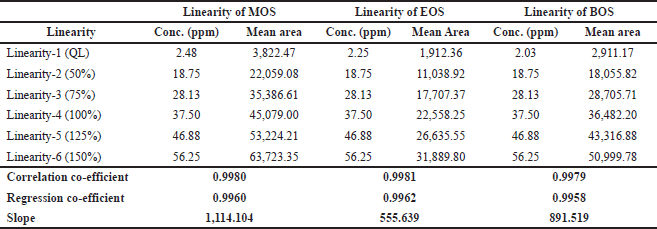 | Table 3. Linearity of MOS, EOS, and BOS. [Click here to view] |
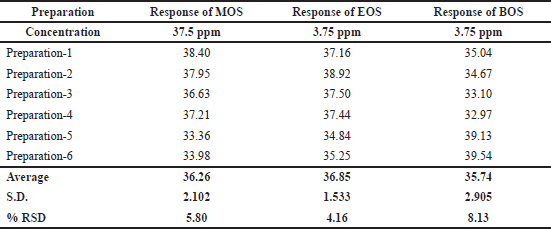 | Table 4. Precision of MOS, EOS, and BOS. [Click here to view] |
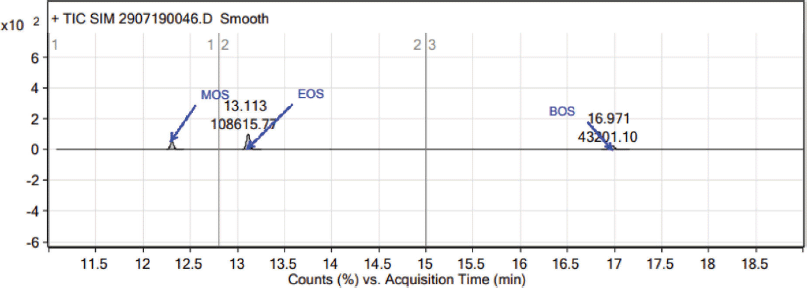 | Figure 8. Typical chromatogram of Teneligliptin sample spiked with MOS, EOS and BOS standards. [Click here to view] |
 | Table 5. Accuracy of MOS, EOS, and BOS. [Click here to view] |
 | Table 6. Robustness of MOS, EOS, and BOS. [Click here to view] |
 | Table 7. Method recommendations for MOS, EOS, and BOS. [Click here to view] |
CONCLUSION
A new GC-MS method has been developed for the estimation of octane sulfonates and then validated as per the ICH guidelines. Based on the results of various validation parameters, the proposed GC-MS method is simple, specific, robust, linear, precise, and accurate for the intended purpose. In addition, the method is very simple to adapt in any industrial analytical lab as it does not require derivatization. Accordingly, the validated method can detect the MOS, EOS, and BOS at 0.74, 0.68, and 0.61 ppm as LOD and 2.48, 2.25, and 2.03 ppm as LOQ, respectively. This is an appreciable level detection of PGIs in drug substances. Hence, we recommend this method for even the trace-level quantification of octane sulfonates in gliptins. In the future, this method can be expanded to other classes of drug substances to quantify a range of sulfonates and may be employed as a generalized method as well.
AUTHORS’ CONTRIBUTIONS
All authors made substantial contributions to conception and design, acquisition of data, or analysis and interpretation of data; took part in drafting the article or revising it critically for important intellectual content; agreed to submit to the current journal; gave final approval of the version to be published; and agree to be accountable for all aspects of the work. All the authors are eligible to be an author as per the international committee of medical journal editors (ICMJE) requirements/guidelines.
FUNDING
There is no funding to report.
CONFLICTS OF INTEREST
The authors report no financial or any other conflicts of interest in this work.
ETHICAL APPROVALS
This study does not involve experiments on animals or human subjects.
DATA AVAILABILITY
All data generated and analyzed are included within this research article.
PUBLISHER’S NOTE
This journal remains neutral with regard to jurisdictional claims in published institutional affiliation.
REFERENCES
Ahirrao VK, Jadhav RA, Rane VP, Bhamare HR, Yeole, RD. Time-dependent selected reaction monitoring-based GC-MS/MS method for estimation of genotoxic impurities in new antibacterial agent: alalevonadifloxacin mesylate. J Anal Sci Tech, 2020; 11:22. CrossRef
Alzaga R, Ryan RW, Taylor-Worth K, Lipczynski AM, Szucs R, Sandra P. A generic approach for the determination of residues of alkylating agents in active pharmaceutical ingredients by in situ derivatization of headspace gas chromatography-mass spectrometry. J Pharm Biomed, 2007; 45(3):472–9. CrossRef
An J, Sun M, Bai L, Chen T, Liu DQ, Kord A. A practical derivatization LC/MS approach for determination of trace level alkyl sulfonates and dialkyl sulfates genotoxic impurities in drug substances. J Pharm Biomed, 2008; 48(3):1006–10. CrossRef
European Commission Health and Consumers. Use of the Threshold of Toxicological Concern (TTC) approach for human safety assessment of chemical substances with focus on cosmetics and consumer products, 2012; 10.2772:2058.
Goda M, Kadowaki T. Teneligliptin for the treatment of type 2 diabetes. Drugs Today, 2013; 49(10):615–29. CrossRef
ICH Q3C (R5). Technical requirements for registration of pharmaceuticals for human use impurities guideline for residual solvents. International Conference on Harmonization, 2011. Available via https://www.pmda.go.jp/files/000156308.pdf
ICH Q2 (R1). Validation of analytical procedures: text and methodology. International Conference on Harmonization, 2005. Available via https://database.ich.org/sites/default/fles/Q2_R1_Guideline.pdf
Jin B, Guo K, Zhang T, Li T, Ma C. Simultaneous determination of 15 sulfonate ester impurities in phentolamine mesylate, amolodipine besylate and tosufloxacin tosylate by LC-APCI-MS/MS. J Anal Methods Chem, 2019; Article ID 4059765. CrossRef
Kakadiya PR, Reddy BP, Singh V, Ganguly S, Chandrashekhar TG, Singh DK. Low level determinations of methyl methanesulfonate and ethyl methanesulfonate impurities in lopinavir and ritonavir active pharmaceutical ingredients by LC/MS/MS using electrospray ionization. J Pharm Biomed, 2011; 55(2):379–84. CrossRef
Kishimoto M. Teneligliptin a DPP-4 inhibitor for the treatment of type 2 diabetes metabolic syndrome and obesity. Diabetes Metab Syndr Obes, 2013; 6:187–95. CrossRef
Kumar N, Devineni SR, Aggile K, Gajjala PR, Kumar P, Dubey SK. Facile new industrial process for synthesis of Teneligliptin through new intermediates and its optimization with control of impurities. Res Chem Intermed, 2018; 44:567–84. CrossRef
Kutoh E, Hirate M, Ikenoa Y. Teneligliptin as an initial therapy for newly diagnosed, drug naive subjects with type 2 diabetes. J Clin Med Res, 2014; 6(4):287–94. CrossRef
Li M, Gu C, Luo L, Zhou J, Liu J, Zheng F. Determination of trace methanesulfonates in drug matrix using derivatization and headspace single drop microextraction followed by high-performance liquid chromatography with ultraviolet detection. J Chromatogr A, 2019; 1591:131–7. CrossRef
Liu Z, Fan H, Zhou Y, Qian X, Tu J, Chen B, Duan G. Development and validation of a sensitive method for alkyl sulfonate genotoxic impurities determination in drug substances using gas chromatography coupled to triple quadrupole mass spectrometry. J Pharm Biomed Analysis, 2019; 168:23–9. CrossRef
Nageswari A, Reddy VSRK, Mukkanti K. A Sensitive and Simple HPLC-UV Method for trace level quantification of ethyl p-toluenesulfonate and methyl p-toluenesulfonate, two potential genotoxins in active pharmaceutical ingredients. Sci Pharm, 2011; 79:865–76. CrossRef
Ramakrishna K, Raman NVVSS, Rao KMVN, Prasad AVSS, Reddy KS. Development and validation of GC-MS method for the determination of methyl methanesulfonate and ethyl methanesulfonate in imatinibmesylate. J Pharm Biomed, 2008; 46(4):780–3. CrossRef
Sharma SK, Panneerselvam A, Singh KP, Parmar G, Gadge P, Swami O. Teneligliptin in management of type 2 diabetes mellitus. Diabetes Metab Syndr Obes, 2016; 9:251–6. CrossRef
Taylor GE, Gosling M, Pearce A. Low level determination of p-toluenesulfonate and benzenesulfonate esters in drug substance by high performance liquid chromatography-mass spectrometry. J Chromatogr A, 2006; 1119(1–2):231–7. CrossRef
USP. General chapter, Residual solvents. In: United States Pharmacopoeia. USP39–NF34:339, p 467, 2016.
USFDA: Guidance for industry: analytical procedures and methods validation for drugs and biologics, 2015. Available via https://www.fda.gov/fles/drugs/published/Analytical-Procedures-and-Methods-Validation-for-Drugs-and-Biolo gics.pdf
Wang Y, Feng J, Wu S, Shao H, Zhang W, Zhang K, Zhang H, Yang Q. Determination of methyl methanesulfonate and ethyl methylsulfonate in new drug for the treatment of fatty liver using derivatization followed by high-performance liquid chromatography with ultraviolet detection. Molecules, 2022; 27:1950. CrossRef
Wollein U, Schramek N. Simultaneous determination of alkyl mesilates and alkyl besilates in finished drug products by direct injection GC-MS. Eur J Pharm Sci, 2012; 45(1–2):201–4. CrossRef
Zhang C, Huang L, Wu Z, Chang C, Yang Z. Determination of sulfonate ester genotoxic impurities in imatinibmesylate by gas chromatography with mass spectrometry. J Sep Sci, 2016; 39(18):3558–63. CrossRef
Zhou J, Xu J, Zheng X, Liu W, Zheng F. Determination of methyl methanesulfonate and ethyl methanesulfonate in methanesulfonic acid by derivatization followed by high-performance liquid chromatography with ultraviolet detection. J Sep Sci, 2017; 40(17):3414–21. CrossRef