
INTRODUCTION
Peanuts are one of the high protein sources widely consumed by the population and available in the market, either with or without shells. The food industries process most peanuts into various products, thus increasing the demand for this commodity as an industrial raw material. The increase in demand has led to higher productivity and income of the peanut farmers (Sholihah, 2016). According to the Ministry of the Agriculture Republic of Indonesia, peanut production in 2018 increased by 3.38% compared to 2017. However, local productions cannot fulfill the demand; therefore, they are still imported to supply 30% of the domestic needs (Kasno, 2017). The failure in providing sufficient quantities may be due to contamination through fungal growth in many regions.
The presence of fungal growth reduces domestic production and reduces the quality of available peanuts. Several factors explaining fungal growth include improper storage conditions or other ecophysiological factors, as well as optimal humidity and temperature conditions (Bhat et al., 2017). A previous study has reported an occurrence of aflatoxin contamination in peanuts, including aflatoxins B1, B2, G1, and G2 (Iha et al., 2017). This contamination can cause severe human health problems (Riordan and Wilkinson, 2007).
Aflatoxins have toxicological consequences on humans, including mutagenic, teratogenic, and carcinogenic effects (Ardic et al., 2008). They can also cause acute liver damage, edema, and hemorrhage (Benkerroum, 2020). At a trace level of 20−120 µg kg−1, they cause detrimental effects on human health (WHO, 2018). Therefore, a reliable method for identifying and quantifying these compounds in food is required.
Both conventional and advanced methods were developed to analyze aflatoxins in peanuts, including Fourier transform infrared (FTIR), ELISA, high-performance liquid chromatography (HPLC), liquid chromatography–mass spectrometry (LC-MS), and ultra-high performance liquid chromatography- tandem mass spectrometry (Afsah-Hejri et al., 2011; Berthiller et al., 2017; Wolf et al., 2018). The advanced methods provide a higher sensitivity and selectivity (Berthiller et al., 2017). However, the available methods have disadvantages, such as using many reagents and being time-consuming in checking contamination throughout the supply chain, online monitoring in food industries, and controlling the market products. Therefore, spectroscopy was the most recommended method for rapid analysis of aflatoxins, and FTIR spectroscopy was the most appropriate spectroscopic method for this purpose (Kos et al., 2016; Oplatowska-Stachowiak et al., 2016). Hence, this study developed the FTIR method to identify and quantify aflatoxins in peanuts.
Several variables may influence the development of aflatoxin determination in peanuts using FTIR, necessitating the use of chemometrics to process information from spectrum data. Multivariate data analysis (MDA) was selected for data processing because it could classify and quantify the peanuts based on their infrared spectra (Rohman, 2014). Since the multivariate analyses produce a large amount of data, a principal component analysis (PCA) is needed to reduce the amount of data for unsupervised pattern recognition (Miller and Miller, 2005). PCA was utilized because the profile pattern of the peanut sample was unknown before the study, and no assumptions were made on the distribution of the variables (Rohman, 2014). For the calibration and validation technique, partial least square (PLS) regression was used to predict aflatoxin contamination levels in peanuts.
In a previous study, a classification model developed by Fourier transform infrared spectroscopy, coupled with an attenuated total reflectance unit (FTIR-ATR), followed by discriminant analysis (DA) and PLS, successfully separated aflatoxigenic and nonaflatoxigenic strains of Aspergillus flavus and Aspergillus parasiticus invasion in peanuts. The method classified all the samples correctly using the DA technique resulting in a high coefficient of determination (R2 = 0.9998) for total aflatoxins in 1,800−800 cm−1 at smoothing for the first derivative spectral data (Kaya-Celiker et al., 2014). Furthermore, Kos et al. (2016) presented the classification results of aflatoxin B1 in peanuts using FTIR spectroscopy combined with PCA contrasting reference data from the LC-MS analyses. The method effectively classified 77% of 92 peanut samples for aflatoxin B1 at the European Union regulatory limit (8 µg kg−1) (Kos et al., 2016). Hence, this study aimed to develop a rapid method to classify samples and quantify aflatoxin B1, B2, G1, and G2 contamination levels in peanuts using FTIR spectroscopy combined with the PCA and PLS techniques and compare it with HPLC as a reference method.
MATERIALS AND METHODS
Chemicals
Phosphate buffer saline (PBS), double-distilled water (aqua bidest, Ikapharmindo, Jakarta, Indonesia), acetone (analytical grade), and methanol (HPLC grade) were purchased from Merck (Darmstadt, Germany). The immunoaffinity cleanup (IAC) columns were specific for aflatoxins (VICAM, Milford, CT). A mixed aflatoxins standard containing B1, B2, G1, and G2 was stored at −20°C until used for HPLC analysis.
Preparation of standard solution
A mixture solution of aflatoxins standard B1−G1 (1 µg ml−1) and B2−G2 (0.3 µg ml−1) was diluted 10× with methanol. Subsequently, a series of working standards for B1−G1 (0.2 to 40 ng ml−1) and B2−G2 (0.06 to 12 ng ml−1) were prepared in methanol:water (80:20).
Peanut samples
A total of 20 peanut samples were analyzed for aflatoxins which were randomly collected from the traditional and modern markets in Yogyakarta, Klaten, Bantul, Sleman, Sragen, Temanggung, Semarang, Sukoharjo, Kebumen, Magelang, and Boyolali (Indonesia). They were samples of the whole peanut, those without shells, and peanuts without shells and testa. The samples were correctly labeled with the identity of the sites, and quarter sampling was conducted to make a representative sample of 100 g. The samples for analysis were packed in polyethylene bags and stored at 4°C until further use (Afsah-Hejri et al., 2011).
Sample preparation
For FTIR analysis, 100 g of sample peanut was ground with a steel blender (Philips HR 2221, Eindhoven, Dutch) until a paste was obtained and then analyzed using FTIR spectroscopy (Kos et al., 2016). For HPLC analysis, the representative sample (20 g) of peanut was ground using a blender. The sample (5 g) was placed in a 25 ml brown bottle with 15 ml of methanol:water (80:20) and closed tightly. The mixture was homogenized with a vortex for 30 s and an ultrasonic bath for 10 min at a temperature of 50°C. The sample was then cooled down to reach room temperature and filtered with filter paper. Subsequently, the filtrate was pipetted (3 ml) and placed into a brown container with 15 ml PBS solution, closed tightly, and homogenized with a vortex for 30 s. The sample solution was passed into the IAC column at a flow rate of 2−3 ml.minute−1, and IAC was washed with 2 × 10 ml of water. Air was then passed into the IAC using a syringe to dry, and the analyte was eluted with 2 × 0.5 ml of methanol at a 2−3 ml minute−1 flow rate. Then, backflushing was carried out thrice and the mixture reeluted with 1.0 ml of water at a flow rate of 2–3 ml minute−1. Finally, the eluate was collected in a 5 ml brown vial for further HPLC analysis (Organization of Training Course on Food Testing, 2011).
FTIR spectroscopy method
The spectra of peanut paste samples were collected using an FTIR spectrometer equipped with an attenuated total reflectance (ATR) and a diamond crystal accessory of Thermo Fisher Scientific (Nicolet iS 10, WI). The spectra were recorded in ATR and corrected by the OMNIC software. To generate the calibration data, spectra were collected as absorbance from 64 scans through the frequency region of 4,000−475 cm−1 at a resolution of 8 cm−1. In addition, background measurements were made against air, and the diamond crystal was cleaned with acetone and dried (Kos et al., 2016).
HPLC method
A fluorescence detector (Waters, D13475432N, Wilmslow, UK) was used in the aflatoxin measurement by HPLC (Waters e 2695 using Empower software control, Wilmslow, UK), which was also equipped with a photochemical reactor for enhanced detection (PHRED, Aura, San Diego, CA) for the derivatization procedure. The temperature of the C18 column (4.6 mm × 25 cm × 5 µm, Waters, Sunfire, Dublin, Ireland) was maintained at 30°C; the injection volume was 100 µl; and the running time was 25 minutes. The isocratic mobile phase was composed of 45% methanol and 55% water with a flow rate of 1.0 ml minute−1. The fluorescence detector was set to excitation and emission wavelengths of 360 and 440 nm, respectively.
Infrared data classification and validation
One or more spectra composed of typically hundreds of wavelengths of overlapping bands were used simultaneously to build a classification or quantitation model. PCA was the most popular MDA used for data reduction and classification. A combination of PCA and PLS regression was highly recommended for classification and quantification techniques. The performance of the final PLS model was evaluated in terms of root mean square error of calibration (RMSEC), root mean square error of prediction (RMSEP), and coefficient of determination (R2). The accuracy of the calibration models was obtained according to the smallest values for RMSEC, while RMSEP was used for external validation.
RESULTS AND DISCUSSION
Identification and interpretation of IR spectrum
All peanut samples were analyzed using an FTIR spectrophotometer to identify the presence of aflatoxins from the IR spectrum. Interpretation of the IR spectrum was a combination of all information between samples and aflatoxins, each of which had a complex structure that can cause the observation of characteristic bands in the same region. Samples were measured in the MIR region of 4,000–475 cm−1, as shown in Figure 1.
The chemical structure of the CH(–CH2–) asymmetric and symmetric stretch, characteristic absorption bands, was shown at 2,922.1 and 2,853.1 cm−1, respectively. At 1,744.3 cm-1, the strong peak belonging to the C=O stretch of ester examined the presence of aflatoxins in peanuts. Aflatoxin showed a characteristic absorption band at wavenumber 3,007.0 cm-1 for –CH cis-stretching. The decreased fatty acid ester bonds centered on this wavenumber were due to increased free fatty acid content (Jiang et al., 2020; Wang et al., 2020). However, stretching the triglyceride carbonyl esters in the peanut matrix due to fungal growth and lipid hydrolysis predominates in the same region (Kaya-Celiker et al., 2014). The band observed at 1,485−1,425 cm−1 was associated with –C–H stretching of CH2 and CH3 of aflatoxin and stretching of –C–H of the CH2 and CH3 aliphatic fatty acids. The band around 1,397.4 cm−1 was mainly related to the –C–H symmetric bending methyl groups of aflatoxin, while the symmetric stretching of =C–O–C was presented at 1,047.6 cm−1 (Mirghani et al., 2001; Kos et al., 2016; Dandashire Salisu and Raubilu Almajir, 2020). 1,630 cm−1 corresponded to the stretching vibration of C=O and C–N of amide I, then 1,537.6 cm−1 represented the N–H, C–O bending, and C–C, C–N stretching of amide II indicated the appearance of protein (Kaya-Celiker et al., 2015).
Principal component analysis (PCA)
A total of 20 samples of peanuts were acquired from several traditional markets by random sampling. The criteria for the collection were samples of the whole peanut, those without shells, and those without shells and testa. The PCA score plot of the sample was described by the first and second principal components (PC1 and PC2). In Figure 2, PC1 and PC2 explain the maximum variance of the entire sample with a value of 95.2% consisting of 91.5% PC1 and 3.7% PC2.
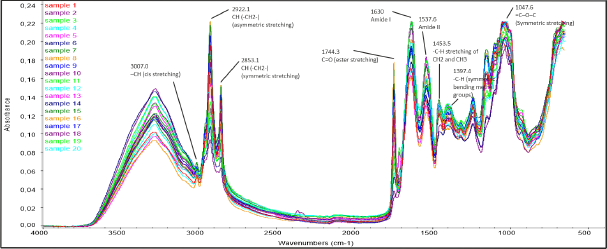 | Figure 1. FTIR-ATR spectra of peanut samples from several traditional markets in Central Java and Yogyakarta (Indonesia). [Click here to view] |
The result of PCA is referred to as principal components (PCs), and two or more samples with the same PC may be considered similar. The closest score plot between PC1 and PC2 shows the similarity of characteristics between the samples. Figure 3 shows three groups of samples observed based on the closeness of the score plots and the similarity of the physicochemical properties. One of the groups with the black marks was observed as peanuts without shells and testa, the second one marked with a blue circle indicated a group of peanuts without shells, and the last was marked with a red circle for a group with shells.
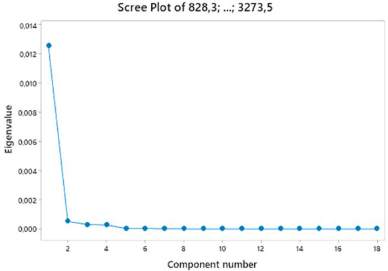 | Figure 2. The results of the scree plot sample using PCA analysis. The proportion value for PC1 was 91.5%, and PC2 was 3.7%. [Click here to view] |
Figure 3 shows that peanuts contaminated with aflatoxin were found in samples without shells and testa and those without shells. This classification described that less optimum handling and conditions during postharvest significantly affect quality, specifically unwanted moisture and temperature conditions during storage (Thanushree et al., 2019). Contamination of aflatoxin occurred when shells were broken and easily penetrated by mold (Porter et al., 1986). Blanching is used to remove the shell and testa of peanut from the kernel, and the frequency of aflatoxin contamination was higher in processed peanut products than in the unprocessed (Chen et al., 2013).
Determination of aflatoxins in peanuts
Determination of aflatoxin contamination in peanut samples was examined using high-performance liquid chromatography coupled with a fluorescence detector (HPLC-FD). Table 1 shows the analytical properties of HPLC-FD analyses for aflatoxins B1, B2, G1, and G2. The chromatographic method was validated by a high coefficient of determination (R2 > 0.999) and repeatability (CV > 2.94%). Based on the HPLC-FD results (Table 2), 4 out of 20 peanut samples (20%) were contaminated with aflatoxins to levels of 1.272–9.585 µg kg−1 for B1 and 0.448–2.943 µg kg−1 for B2. Most of the contaminated samples were peanuts without shells, while peanuts in shells showed no aflatoxin contamination. A prior study found that fungi from Aspergillus were often found in peanuts without shells (Atayde et al., 2012). In addition, the handling factor in the supply chain also influences where food products sold, specifically in tropical countries, are usually displayed under unacceptable conditions. Exposure to mold and dust in the long term from the environment could increase the possibility of aflatoxin production in this commodity (Afsah-Hejri et al., 2013).
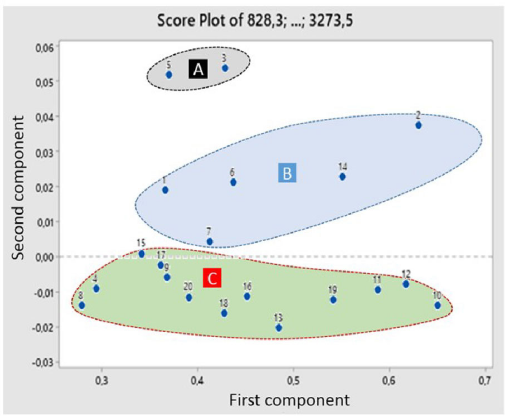 | Figure 3. Score plot of 20 peanut samples. (A) A group of raw peanuts without shells and testa; (B) A group of raw peanuts without shells; and (C) A group of peanuts in shells. [Click here to view] |
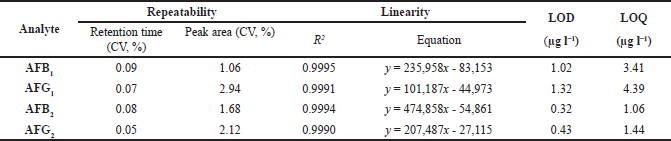 | Table 1. Analytical properties of HPLC-FD method aflatoxin analysis. [Click here to view] |
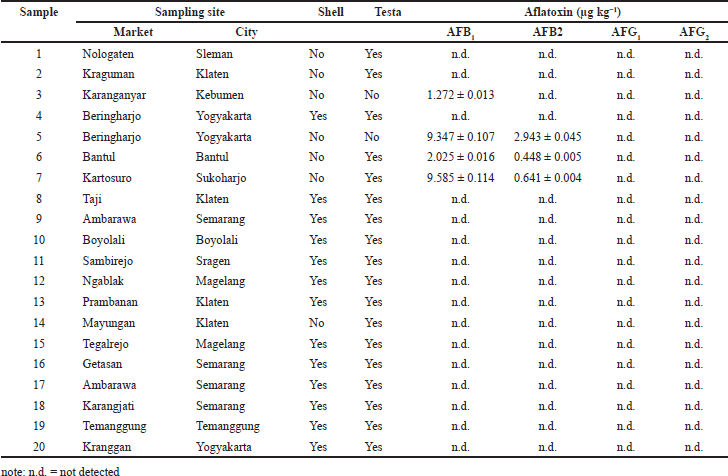 | Table 2. Aflatoxin concentration in the studied peanut samples. [Click here to view] |
Several studies from different countries reported the incidence and contamination levels of aflatoxin in peanuts. In Malaysia, samples of 84 raw peanut kernels were contaminated with B1 (75%), B2 (68%), and G1 (11%) at levels of 9.00, 1.91, and 0.38 µg kg−1, respectively (Arzandeh et al., 2010). Furthermore, raw peanut kernels from retailers were the most contaminated products at levels up to 1,021.4 µg kg−1 (mean: 120.7 µg kg−1, median: 1.4 μg kg−1) (Norlia et al., 2018). Another study in Malaysia reported that aflatoxins were found in 5% of peanut kernel samples (1.0–12.7 µg kg−1) and 13.8% of husk samples (1.0–117.8 μg kg−1) (Atayde et al., 2012). In Pakistan, 13 of 22 raw peanuts in shells (59%) and 16 of 29 raw peanuts without shells (55%) were contaminated by aflatoxins at levels of 6.4 and 5.5 µg kg−1, respectively (Iqbal et al., 2013). A study of 151 groundnut samples in Turkey disclosed that 29 (19.2%) were contaminated with levels ranging from 0.16 to 60.9 µg kg−1 (Hepsag et al., 2014). Meanwhile, Wen-Lien et al. (2019) found aflatoxin B1 (2.40 g µg kg−1), B2 (0.41 µg kg−1), G1 (0.19 µg kg−1), and G2 (0.03 µg kg−1) contamination in peanuts and the derived products in Taiwan. These findings should urge the government to establish regulations to control aflatoxin contamination in peanuts.
Calibration and validation of the quantitative models for aflatoxin contamination in peanuts
Multivariate calibration techniques were used to quantify contamination levels of aflatoxin in peanuts. The selected informative spectral region of varied samples was the raw data to construct the prediction of the PLS regression models. Contamination levels in peanut samples were calculated by applying the PLS algorithm to the calibration and external validation datasets from each variable. The calibration model was built from eight samples, with the remaining four serving as external validation. As an actual and predicted value, the concentration of aflatoxins was determined by HPLC-FD and infrared, respectively. The occurrence of aflatoxin was extracted in the fingerprint region from 1,800 to 800 cm–1. This region was observed for chemometric modeling based on PLS optimization to predict the aflatoxin contamination levels in several wavenumbers, resulting in optimum R2, RMSEC, and RMSEP for aflatoxins B1 and B2 (Table 3).
The coefficient of determination (R2) reflected that the independent variable could predict the variance of the dependent variables, and RMSEC showed the difference between the predicted and the actual concentration. Therefore, the minimum RMSEC and higher R2 values are the best model for the spectral dataset. Table 4 showed that the R2 values of calibration and validation of B1 were 0.9995 and 0.9973, and B2 was 0.9999 for both calibration and validation sets, respectively. Furthermore, the RMSEC value was 0.1180 and 0.0119 for B1 and B2, respectively, while B1 had an RMSEP value of 0.3000 and 0.0594 for B2. This study could not predict the level of G1 and G2 contamination in the samples because both analytes were not detected in the studied peanut samples.
A new analytical method was continuously improved to assess aflatoxin occurrence in peanuts rapidly. FTIR combined with chemometric models has been successfully used to quantify aflatoxin contamination levels in peanuts. Several studies evaluated aflatoxin contamination using FTIR spectroscopy coupled with MDA. Kaya-Celiker et al., (2014) reported the potential usage of the FTIR-ATR system as a rapid qualifying technique for detecting fungal-infected peanuts based on mold density. A flavus and A parasiticus are the most studied fungi since they produce aflatoxins that cause peanut spoilage. Furthermore, 164 samples were successfully classified using the DA technique. Moldy peanut samples were analyzed for their first derivative spectral smoothing, and PLS regression (R2 = 0.9998) was applied for the calibration model to predict total aflatoxin levels for A. flavus and A. parasiticus in 1,800–800 cm−1 (Kaya-Celiker et al., 2014). Kos et al. (2016) successfully classified aflatoxin B1-contaminated peanuts based on regulatory limits using FTIR spectroscopy combined with PCA. This model had a classification accuracy of 77% for 92 peanut samples, where 71 samples were correctly classified at 8 µg kg−1 (Kos et al., 2016). The R2 value of calibration, validation sets, and RMSEC and RMSEP values for B1 and B2 were all closer to 1. The higher R2 and the smaller error of RMSEC and RMSEP values showed that FTIR spectroscopy might be a viable rapid approach to identify and quantify aflatoxin contamination levels in peanuts.
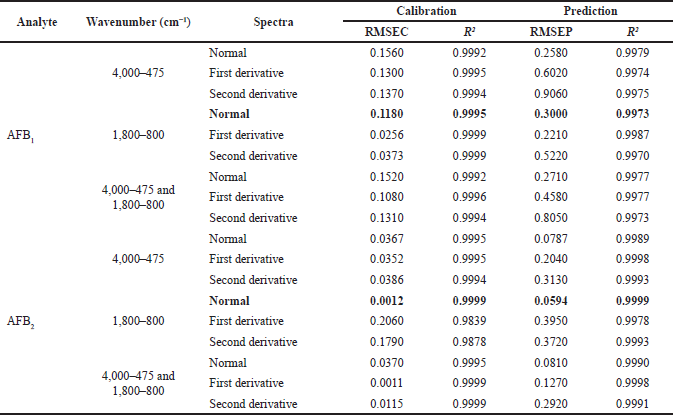 | Table 3. The optimization of PLS for predicting aflatoxin contamination level in peanut samples. [Click here to view] |
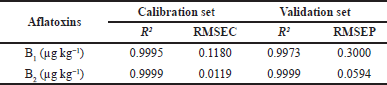 | Table 4. Calibration and validation results of the PLS for the aflatoxin contamination levels in peanuts in the wavenumber region 1,800–800 cm−1. [Click here to view] |
CONCLUSION
A new analytical method based on the infrared spectrum associated with MDA was developed to identify and quantify aflatoxin contamination levels in peanuts. The PCA technique has successfully classified peanut samples based on their physicochemical properties. Furthermore, with a high coefficient of determination and low error (RMSEC and RMSEP values), FTIR spectroscopy at fingerprint wavenumber paired with PLS regression can be an alternative approach to determining aflatoxin contamination in peanuts.
ACKNOWLEDGMENT
The authors are grateful to the National Agency of Drug and Food Control (NADFC) Foundation of the Republic of Indonesia for a Master’s Studentship through the NADFC Scholarships 2020/2022.
CONFLICTS OF INTEREST
The authors declare no conflicts of interest.
FUNDING
The research was funded by the National Agency of Drug and Food Control (NADFC) Foundation of the Republic of Indonesia through NADFC Scholarships 2020/2022.
AUTHOR CONTRIBUTIONS
All authors made substantial contributions to conception and design, acquisition of data, or analysis and interpretation of data; took part in drafting the article or revising it critically for important intellectual content; agreed to submit to the current journal; gave final approval of the version to be published; and agree to be accountable for all aspects of the work. All the authors are eligible to be an author as per the international committee of medical journal editors (ICMJE) requirements/guidelines.
ETHICAL APPROVALS
This study does not involve experiments on animals or human subjects.
DATA AVAILABILITY
All data generated and analyzed are included within this research article.
PUBLISHER’S NOTE
This journal remains neutral with regard to jurisdictional claims in published institutional affiliation.
REFERENCES
Afsah-Hejri L, Jinap S, Arzandeh S, Mirhosseini H. Optimization of HPLC conditions for quantitative analysis of aflatoxins in contaminated peanut. Food Control, 2011; 22:381–8. CrossRef
Afsah-Hejri L, Jinap S, Hajeb P, Radu S, Shakibazadeh S. A review on mycotoxins in food and feed: Malaysia case study. Compr Rev Food Sci Food Saf, 2013; 12:629–51. CrossRef
Ardic M, Karakaya Y, Atasever M, Durmaz H. Determination of aflatoxin B1 levels in deep-red ground pepper (isot) using immunoaffinity column combined with ELISA. Food Chem Toxicol, 2008; 46:1596–9. CrossRef
Arzandeh S, Selamat J, Lioe H. Aflatoxin in raw peanut kernels marketed in Malaysia. J Food Drug Anal, 2010; 18:44–50. CrossRef
Atayde DD, Reis TA., Godoy IJ, Zorzete P, Reis GM, Corrêa B. Mycobiota and aflatoxins in a peanut variety grown in different regions in the state of São Paulo, Brazil. Crop Prot, 2012; 33:7–12. CrossRef
Benkerroum N. Chronic and acute toxicities of aflatoxins: Mechanisms of action. Int J Environ Res Public Health, 2020; 17:1–28. CrossRef
Berthiller F, Cramer B, Iha M.H. Developments in mycotoxin analysis: an update for 2016-2017. World Mycotoxin J, 2017; 11:5–31. CrossRef
Bhat R, Reddy KRN. Challenges and issues concerning mycotoxins contamination in oil seeds and their edible oils: updates from last decade. Food Chem, 2017; 215:425–37. CrossRef
Chen YC, Liao CD, Lin HY, Chiueh LC, Shih DYC. Survey of Aflatoxin contamination in peanut products in Taiwan from 1997 to 2011. J Food Drug Anal, 2013; 21:247–52. CrossRef
Dandashire Salisu B, Raubilu Almajir I. Aflatoxins and aflatoxigenic fungal contamination of common poultry feed products in Katsina State, Nigeria. Nov Res Microbiol J, 2020; 4:653–65. CrossRef
Hepsag F, Golge O, Kabak B. Quantitation of aflatoxins in pistachios and groundnuts using HPLC-FLD method. Food Control, 2014; 38:75–81. CrossRef
Iha MH, Mini CA; Okada IA, Briganti R. de C, Trucksess MW. The use of regenerated immunoaffinity columns for aflatoxins B1, B2, G1 and G2 in peanut confection. J Chromatography A, 2017; 1483:1–7. CrossRef
Iqbal SZ, Asi MR, Zuber M, Akram N, Batool N. Aflatoxins contamination in peanut and peanut products commercially available in retail markets of Punjab, Pakistan. Food Control, 2013; 32:83–6. CrossRef
Jiang H, Liu T, He P, Chen Q. Quantitative analysis of fatty acid value during rice storage based on olfactory visualization sensor technology. Sensors Actuators B Chem, 2020; 309:127816. CrossRef
Kasno, A. Peanuts: technological Innovation and product development. Research Institute for Various Nuts and Tubers, Malang, Indonesia, 2015.
Kaya-Celiker H, Mallikarjunan PK, Schmale D, Christie ME. Discrimination of moldy peanuts with reference to aflatoxin using FTIR-ATR system. Food Control, 2014; 44:64–71. CrossRef
Kaya-Celiker H, Mallikarjunan PK, Kaaya A. Mid-infrared spectroscopy for discrimination and classification of Aspergillus spp. contamination in peanuts. Food Control, 2015; 52:103–11. CrossRef
Kos G, Sieger M, McMullin D, Zahradnik C, Sulyok M, Öner T, Mizaikoff B, Krska R. A novel chemometric classification for FTIR spectra of mycotoxin-contaminated maize and peanuts at regulatory limits. Food Addit Contam – Part A Chem Anal Control Expo Risk Assess, 2016; 33:1596–607. CrossRef
Miller JN, Miller JC. Chemometrics for analytical. Pearson Educ Limited, London, UK, pp 215–7, 2005.
Mirghani MES, Che Man YB, Jinap S, Baharin BS, Bakar J. A new method for determining aflatoxins in groundnut and groundnut cake using Fourier transform infrared spectroscopy with attenuated total reflectance. JAOCS, J Am Oil Chem Soc, 2001; 78:985–92. CrossRef
Norlia M, Nor-Khaizura M, Selamat J, Bakar FA, Radu S, Chin CK. Evaluation of aflatoxin and Aspergillus sp. contamination in raw peanuts and peanut-based products along this supply chain in Malaysia. Food Addit Contam Part A, 2018; 35:1787–802. CrossRef
Oplatowska-Stachowiak M, Sajic N, Xu Y, Haughey SA, Mooney M, Gong YY, Verheijen R, Elliott CT. Fast and sensitive aflatoxin B1 and total aflatoxins ELISAs for analysis of peanuts, maize and feed ingredients. Food Control, 2016; 63:239–45. CrossRef
Porter DM, Wright FS, Steele JL. Relationship to microscopic shell damage to colonization of peanut by Aspergillus flavus. Oleagneux, 1986; 41:23–7.
Riordan MJ, Wilkinson MG. A survey of the incidence and level of aflatoxin contamination in a range of imported spice preparations on the Irish retail market. Food Chem, 2007; 107:1429–35. CrossRef
Rohman A. Basic statistics and chemometrics in pharmaceutical analysis. Pustaka Pelajar, Yogyakarta, Indonesia, pp 20–2, 2014.
Sholihah SN. Outlook for agricultural commodities food crops sub-sector peanut. Center for Agricultural Data and Information Systems, Ministry of Agriculture. perpustakaan.bappenas.go.id. Jakarta, Indonesia, pp 1–94, 2016.
Thanushree MP, Sailendri D, Yoha KS, Moses JA, Anandharamakrishnan C. Mycotoxin contamination in food: an exposition on spices. Trends Food Sci Technol, 2019; 93:69–80. CrossRef
Wang Q, Han F, Wu Z, Lan T, Wu W. Estimation of free fatty acids in stored paddy rice using multiple-kernel support vector regression. Appl Sci, 2020; 10:6555. CrossRef
Wen-Lien K, Wang X, Pan M. Assessing aflatoxin exposure risk from peanuts and peanut products imported to Taiwan. Toxins (Basel), 2019; 1–9. CrossRef
WHO. Aflatoxin. Food safety digest. Department of Food Safety and Zoonoses, WHO, Geneva, Switzerland, p 18.1, 2018.
Wolf K, Schweigert FJ. Mycotoxin analysis: a focus on rapid methods. Partnership Aflatoxin Control Africa. African Union Commission, Addis Ababa, Ethiopia, pp 1–46, 2018.