INTRODUCTION
Dissolution testing of oral solid dosage forms has been employed for several decades for developing new drug products and formulation and/or process development and ensuring batch-to-batch quality, consistency, and final product performance (Bredael et al., 2015). Moreover, it serves as a tool for determining long-term stability, shelf life, and impact of postapproval changes during the manufacturing process of a specific drug product (Khan et al., 2013).
In vitro dissolution testing serves as a powerful means to predict in vivo behavior of drug products. The procedures of connecting in vitro/in vivo release profiles are regularly recognized as in vitro/in vivo correlation (IVIVC). The main goal of an IVIVC is to help as a surrogate for in vivo bioavailability and/or to support biowaiver (Emara et al., 2000; Taha et al., 2020). Hence, instead of costly and time-consuming in vivo trials, a suggestive dissolution methodology could be a safe alternative to predict whether pharmaceutical dosage forms are equivalent or not (Hashem et al., 2019).
The correlation of dissolution results with bioavailability data remains a subject of debate, with intense activity in the pharmaceutical field being considered for establishing satisfactory quantitative correlations. Several drugs were tested for successful IVIVC, e.g., ibuprofen (IBU). (Tamilvanan and Sa, 2006), domperidone (Bose and Wui, 2013), aprepitant and donepezil (Chakraborty et al., 2014), and glyburide (Wei and Löbenberg, 2006). The ability of a certain dissolution testing model to estimate actual in vivo behavior is quite complex, and further investigations on a case-by-case basis are needed to confirm the robustness of the suggested in vitro approach.
In the 1970s, the basket method [United States Pharmacopeia (USP) apparatus I] and paddle method (USP apparatus II) were adopted as official quality control (QC) dissolution tests. These dissolution models usually employ simple experimental conditions, which do not reflect the actual in vivo situation. However, in the 1990s, the flow-through cell dissolution model (FTC) was introduced as the official USP apparatus IV (Todaro et al., 2017). The FTC method has gained recent acceptance into the dissolution world for its advantages over traditional methods (basket and paddle). It is possible to maintain sink conditions; the intraluminal hydrodynamics are more efficiently simulated, making the development of IVIVC easier, especially for poorly soluble drugs. Therefore, FTC is more reliable, reproducible, and discriminative than other methods (Emara et al., 2009, 2014b; Forrest et al., 2018).
IBU, a chiral nonsteroidal anti-inflammatory drug, is recommended to treat moderate and acute pain. It probably ranks after acetaminophen and paracetamol as nonprescriptive over-the-counter drugs. The normal daily (IR) oral dose ranges from 200 to 600 mg every 6 hours. IBU bioavailability is over 80% after oral administration (Higgins et al., 2001), and its biological half-life is 2 hours (Rainsford, 2009). IBU is classified according to the Biopharmaceutics Classification System as a Class II drug, which exhibits low solubility and good permeability characteristics; thus, its absorption depends on dissolution (Reddy and Karunakar, 2011). Therefore, employing a well-designed in vitro dissolution test that mimics the gastrointestinal physiology allows for a reliable IVIVC (Emara et al., 2000).
The USP recommends performing dissolution testing for IBU IR tablets in a compendial paddle apparatus (USP II) at 50 rpm, using 900 mL of phosphate buffer media of pH 7.2 (USP-32, 2009), with few studies published in the literature assessing the dissolution performance of IBU products worldwide (Chevalier et al., 2009; Medina et al., 2017; Lu and Fassihi, 2017).
The main objective of the present investigation was to assess the importance of different in vitro compendial dissolution models in developing IVIVC for IBU IR commercial products (tablets) obtained from Egyptian (Brufen®, Abbott), European (Nurofen®, Reckitt Benckiser Healthcare), and American (Advil®, Pfizer) markets. In order to figure out the early dissolution of IBU, a multipoint sampling scheme was conducted, instead of a single point analysis stated by USP, using the USP I, II, and IV models. The deconvolution approach, employing the back-calculation of the Wagner–Nelson (WN) method, was utilized for estimating the in vivo pharmacokinetic parameters. The predicted drug plasma concentration–time profiles calculated from dissolution results were compared with the actual Cmax and AUCs parameters obtained from well-authenticated published literature to come to terms with the ideal USP model which could accurately predict IBU in vivo performance.
MATERIALS AND METHODS
Materials
Pure IBU powder was donated by Sigma Pharma, Egypt. Potassium dihydrogen orthophosphate and sodium hydroxide pellets were obtained from Rasayan Laboratories, India. Methanol and acetonitrile (HPLC grade, Prolabo, France) were used for the preparation of stock solutions. Purified Milli-Q water (Millipore Corp., Billerica, MA) was used for the preparation of the dissolution medium.
IBU IR commercial products (each contains 200 mg IBU/tablet):
Brufen® tablets (Abbott, Egypt) (Batch No. 04228), excipients composition, as listed: “starch corn, magnesium stearate, opaglos regular (NA-7150), acacia, sucrose, calcium sulfate, sodium CMC, opalux pink as-1537, hard paraffin, talcum powder, and opacode S-1-2779 black.”
Advil® tablets (Pfizer, USA) (Batch No. CJ3334), excipients composition, as listed: “acetylated monoglycerides, colloidal silicone dioxide, corn starch, croscarmellose sodium, methylparaben, microcrystalline cellulose, pharmaceutical glaze, pharmaceutical ink, povidone, pregelatinized starch, propylparaben, sodium benzoate, sodium lauryl sulfate, stearic acid, sucrose, synthetic iron oxide, titanium dioxide, and white wax.”
Nurofen® tablets (Reckitt Benckiser Healthcare, Belgium) (Batch No. JJ060), excipients composition, as listed: “sucrose, sodium citrate, talc, croscarmellose sodium, stearic acid, titanium dioxide, silicon dioxide, acacia, carmellose sodium, sodium lauryl sulfate, marcogol, and black ink [contains shellac, iron oxide black (E172), and propylene glycol].”
Methods
Characterization of IBU IR commercial products
Full tablet characterization was carried out using a 3-in-1 hardness, diameter, and thickness tablet tester (Sotax-MT 50 MultiTest 50, Switzerland). The uniformity of weight for each product was calculated using electric balance. The mean of 20 tablets for each product was calculated.
Content uniformity
The assay of IBU in different IR commercial products was assessed by the UV spectrophotometric method (DU–650 UV-Vis Spectrophotometer, Beckman, USA) at λmax of 221 nm (Emara et al., 2014a). Briefly, 20 tablets of each product were weighed and ground, and the weight equivalent to one tablet was dissolved in methanol, then vortexed, and filtered (Millex, 0.45 um). The filtrate was diluted with phosphate buffer of pH 7.2 and analyzed for drug content.
Comparative in vitro dissolution studies of IBU products
In vitro dissolution (n = 6) of IBU IR commercial products (200 mg IBU/tablet) was carried out in filtered, degassed 900 mL phosphate buffer of pH 7.2 (as recommended by USP, USP-32, 2009) at 37°C ± 0.2°C employing the three compendial dissolution apparatuses as described below:
USP I (basket) and USP II (paddle, pharmacopeial) methods
IBU dissolution profiles were determined in an automated dissolution USP apparatus I (basket method) and USP apparatus II (paddle method) dissolution tester (AT8-Xtend, Sotax, Switzerland), with a rotation speed of 50 rpm and an autocontrolled multichannel pump employed.
USP IV (flow-through cell) method
IBU dissolution profiles were carried out in the FTC, USP apparatus IV (Dissotest CE-6 equipped with a CY 7-50 piston pump, Sotax, Switzerland). In all experiments, a tablet was loaded in the 22.6 mm dissolution cell, with a ruby bead located at the cone entry and no glass beads present to ensure a turbulent flow pattern. Built-in filtration of 0.7 μm Whatman glass microfiber, followed by GF/F and GF/D and then glass wool, was employed, with pump speed set at 8 ± 0.2 ml/minute.
For all dissolution testing, samples were withdrawn from dissolution media at predetermined time intervals and replaced with fresh media. Collected samples were analyzed spectrophotometrically at λmax of 221 nm against a blank buffer (Emara et al., 2014a).
Comparison and analysis of in vitro dissolution data
An independent model was applied for comparison among different dissolution profiles of IBU IR commercial products.
The model-independent approaches provide a direct comparison of dissolution profiles. Fit factors (f1 and f2) (Moore and Flanner, 1996), mean dissolution time (MDT) (Costa and Lobo, 2001), and dissolution efficiency (DE) (Emara et al., 2014b) were employed.
Fit factors
The difference factor f1 evaluates the percentage difference between the two curves: f1 values ranging from 0 to 15 indicate similar dissolution profiles, while values >15 indicate dissimilar profiles, according to the following equation:
where Rt and Tt represent the percent of drug dissolved for reference and test, respectively, at each sample point t and n is the number of time intervals.
On the other hand, the similarity factor f2 is a measurement of the similarity of any two dissolution curves according to the following equation:
f2 values ranging from 50 to 100 indicate similar dissolution profiles, while values ≤50 indicate dissimilar dissolution profiles (Costa and Lobo, 2001; Moore and Flanner, 1996; Shah et al., 1997). As stated by the FDA guidelines, f1 and f2 values of ≤15 and ≥50, respectively, ensure equivalence in the dissolution profiles (Shah et al., 1997).
Mean dissolution time (MDT)
MDT was calculated, as described by Costa and Lobo (2001), as follows:
where j represents sample number, n is the number of dissolution sample times, t^j represents the time at the midpoint between tj and tj−1, and ΔMj is the additional amount of drug dissolved between tj and tj−1.
Dissolution efficiency (DE)
Percent dissolution efficiency (%DE) was also calculated to evaluate the relative performance of IBU IR commercial products (Emara et al., 2014b). The value of %DE at 60 minutes (%DE60) for each tablet was quantified as % ratio of area under the dissolution curve till 60 minutes relative to the area of the rectangle defined by 100% dissolution at the same time, as follows:
Statistical significance was determined for MDT and %DE60 minutes using Student’s t-test in the comparison between means of two groups. Data analysis was carried out using SPSS software (version 17.0). Differences were considered significant when p < 0.05.
Prediction of in vivo plasma response
The deconvolution approach was employed for the prediction of IBU in vivo plasma response. The in vitro dissolution data of different IBU IR commercial products, in different USP apparatuses, were converted into predicted plasma concentration–time curves, based on the back-calculation of the WN equation (Ostrowski et al., 2010), according to the following equation:
where D is dose, ΔFa = Fa(t+1) – Fa(t), and Δt = t(t+1) – t(t).
Validity of prediction
FDA guidance specifies the importance of assessment of internal and/or external predictability/validity as a requirement for the employment of IVIVC models for official regulatory submissions (Ostrowski et al., 2010).
The %prediction error (PE%) for AUC0-t and Cmax was calculated according to the following equation:
%PE = [Observed Parameter – Predicted parameter) / Observed Parameter] × 100.
The IVIVC model is assumed to be valid if %PE is equal to or less than 10, while %PE between 10% and 20% suggests inconclusive predictability, which requires additional data. %PE greater than 20% indicates inadequate or lack of predictability/validity of the IVIVC model (Ostrowski et al., 2010).
RESULTS AND DISCUSSION
Tablet characterization
Table 1 shows the tablet characterization and drug content for IBU products. The three IBU products (200 mg IBU/tablet) under investigation showed acceptable weight variations, thickness, diameter, and hardness characteristics. The content uniformity of all IBU products met the assay specifications in the USP, where the percentages of IBU were between 90 and 110% (USP-32, 2009).
 | Table 1. Tablet characterization and content uniformity of IBU commercial products (200 mg/tablet). Data represent mean ± SD (n = 20). [Click here to view] |
 | Figure 1. Dissolution profiles of IBU IR commercial products (200 mg) employing different USP models in phosphate buffer of pH 7.2 at 37°C. Data represent mean ± SD (n = 6). [Click here to view] |
In vitro dissolution results
Figure 1 shows the dissolution profiles of IBU products using different dissolution models (USP I, USP II, and USP IV). Table 2 presents IBU multipoints percent dissolved along the 60- minutes dissolution.
As evident from Figure 1 and Table 2, the dissolution of IBU was highly influenced by different dissolution models employed and the manufacturing sites and/or excipient compositions exhibited by various IBU products.
As shown in Figure 1, upon employing the USP I model (basket method), all products showed the lowest percentage of IBU dissolved. Table 2 shows that Q60 minutes ranged from 45% to 76%.
However, upon employing the USP II model (paddle method, the official dissolution model), all IBU products complied with the pharmacopeial dissolution criterion [not less than 80% (Q) of IBU dissolved within 60 minutes] (USP-32, 2009). As observed in Table 2, Advil showed the fastest dissolution profile [80% (Q) in 10 minutes], followed by Nurofen [80% (Q) in 30 minutes], which might result in a rapid onset of action (Emam et al., 2020).
These vast differences in the dissolution patterns among IBU IR products in USP I and USP II could be attributed to the fact that the hydrodynamic environment below the basket in USP I is not as well mixed as that of the paddle in USP II (Todaro et al., 2017), which might cause the product to stick to the basket mesh, hence affecting the dissolution uniformity. In addition, the high agitation force exhibited by the paddle shaft in USP II could cause the higher dissolution of IBU in this model when compared to USP I (Hashem et al., 2019).
On the other hand, Figure 1 and Table 2 show that upon using the USP IV model (FTC method), all IBU products gave fast dissolution results, where more than 80% of IBU dissolved at 30 minutes with the lowest SD values indicating higher reproducibility and uniformity. Previously (Yoshida et al., 2016), the FTC method proved to mimic ideal hydrodynamic conditions for homogenous and mild agitation in contrast to other dissolution models (basket and paddle). FTC uses a piston pump that produces a sinusoidal or semisinusoidal flow, which in turns allows a continuous, uniform flow of the dissolution medium around the dosage form that mimics the natural environment in the GIT (Medina et al., 2017), in addition to maintaining perfect sink conditions which is important for the in vitro dissolution study of poorly soluble drugs such as IBU (Emara et al., 2014b; Forrest et al., 2018).
A previous study compared the in vitro dissolution performance of two IBU generic suspensions available in Mexico against the reference (Advil® suspension, 2 g/100 ml), employing both the USP II and IV models (Medina et al., 2017). They concluded that the FTC method under the proposed setup (i.e., open system, 22.6 mm cells, laminar flow pattern at a flow rate of 16 ml/min) was suitable for studying the in vitro dissolution of IBU suspensions. They recommended carrying out future in vivo studies to estimate the proposed dissolution methodology (Medina et al., 2017).
 | Table 2 Percent IBU dissolved after 5 (Q5 minutes), 10 (Q10 minutes), 15 (Q15 minutes), 30 (Q30 minutes), and 60 (Q60 minutes) minutes from IR products in different dissolution models. Data represent mean ± SD (n = 6). [Click here to view] |
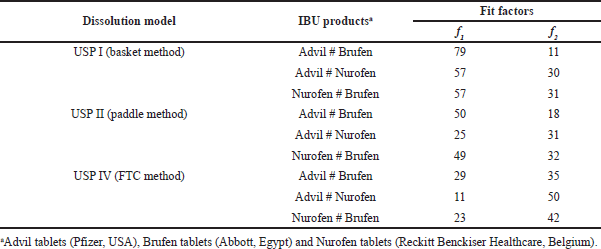 | Table 3. Fit factors’ values comparing the dissolution profiles of IBU commercial products in each dissolution model. [Click here to view] |
Lu and Fassihi studied the dissolution of commercial IBU IR 200 mg tablets available in the United States using both apparatuses (USP I and II) in phosphate buffer pH 7.2 at rotation speeds of 50 and 100. Their results confirmed comparable dissolution profiles among the studied IBU products in both USP models, proposing the capability of apparatus interchangeability (Lu and Fassihi, 2017).
Comparative evaluation of in vitro dissolution data
Table 3 shows the fit factor values (f1 and f2) upon comparing the dissolution profiles of IBU products with each other in each dissolution model. Fit factors data showed dissimilar dissolution profiles of IBU products employing USP I and II models. For USP IV, only Advil and Nurofen exhibited similar dissolution profiles (with f1 and f2 values of 11 and 50, respectively).
From another perspective, Table 4 shows the values of the fit factors comparing the dissolution profiles of each IBU product upon employing different dissolution models with each other. Fit factors’ data revealed dissimilar dissolution profiles for each IBU product among the three USP methods.
Overall results concluded from Tables 3 and 4 emphasize that varying the in vitro dissolution testing model, and variations related to changes in the manufacturing sites and/or formulation differences within the tested products, led to the changes in dissolution profiles of IBU products.
In addition to fit factors, Table 5 presents the MDT and DE at 60 minutes (%DE60 minutes) mean values for comparing dissolution profiles of IBU products in different dissolution models. Significant differences were found in MDT and %DE60 minutes values (p? 0.05) for all IBU products using the USP I, II, and IV models.
Prediction of IBU in vivo plasma concentration-time profile from in vitro data
Inspection of the above dissolution results showed the possibilities of generating IVIVC for the three commercial products due to the effect seen upon changing the dissolution model employed as well as product manufacturing site and/or formulation variables.
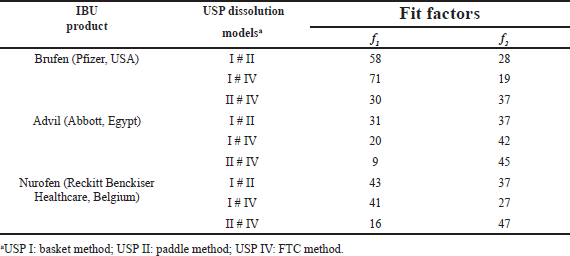 | Table 4. Fit factors’ values comparing dissolution profiles of each IBU commercial product using different dissolution models. [Click here to view] |
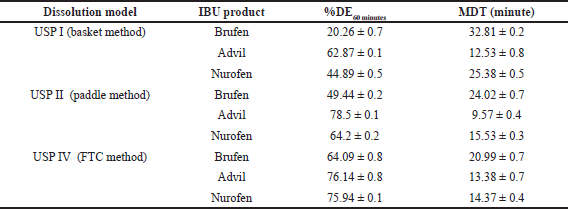 | Table 5. Dissolution parameters calculated with mean dissolution time (MDT) and dissolution efficiency at 60 minutes (%DE60 minutes). Data represent mean ± SD (n = 6). [Click here to view] |
For the establishment of the IVIVC approach, simple spreadsheet software was employed for data calculation and conversion, with the in vitro dissolution data used as the input function. The actual PK data of the IBU IR commercial product (200 mg) were obtained from a previously published study (Shin et al., 2017), where the bioavailability of the IBU IR tablet (Brufen, 200 mg) was investigated in 36 healthy human volunteers under fasting conditions. The maximum observed plasma concentration (Cmax) was 24.1±4.10 mg/L. The area under the plasma concentration–time curve AUC0-12 and AUC0-∞ were 79.60 ± 13.90 and 80.70 ± 15 mg.hour/L, respectively. These data were used for IVIVC purposes.
Figure 2 shows the corresponding predicted IBU plasma concentrations for the three commercial products in the USP I, II, and IV apparatuses. The observed results indicated that drug in vitro input data variations were well reflected on the predicted in vivo profiles. The observed high predicted plasma profiles for the IBU commercial products in USP II and IV were well reflected with their corresponding in vitro results, where more than 80% of the drug was dissolved within 60 minutes (Figures 1 and 2). On the other hand, USP I represented a scenario in which less than 80% of the drug dissolved (Figure 1), which was well reflected in the in vivo results (Figure 2).
Figure 3 shows IVIVC models plotted between the predicted plasma concentrations in different dissolution apparatuses against actual plasma concentrations obtained from (Shin et al., 2017) to determine which USP model provided the best correlation with the in vivo results. The suggested in vitro/in vivo relationships are described by linear regression and presented by R2, slope, and intercept, with the results tabulated in Table 6.
Good correlation, with R2 values ≥ 0.96, could be observed for all IBU products in the USP II and IV models (Figure 3 and Table 6). The best IVIVC models with R2 values ≥ 0.99 and intercept values close to zero were observed in the following cases: Advil product in the USP II and IV models as well as Brufen and Nurofen in the USP IV model.
Validation of the IVIVC
Table 7 presents predicted pharmacokinetic parameters, Cmax, AUC0-12, and AUC0-∞ and the percentages prediction error (%PE), of the IBU IR products in the studied USP models. In the USP I dissolution model, the %PE between the actual and predicted Cmax, AUC0-12, and AUC0-∞ values were >20% for the three commercial products (Table 7), which is indicative of the lack of validity of the suggested IVIVC model (Ostrowski et al., 2010).
 | Figure 2. Plasma profiles of IBU IR commercial products in different dissolution models predicted by back-calculation of the Wagner-Nelson method. Results are presented as mean ± SD (n = 6). [Click here to view] |
 | Figure 3. Predicted concentration against observed concentration for IBU IR commercial products using deconvolution approach, dotted lines represent the best linear regression for each IBU product. [Click here to view] |
On the other hand, in the USP II dissolution model, %PE regarding Cmax values was >20%. However, %PE of AUC0-12 and AUC0-∞ values for Brufen and Nurofen ranged from 10.72 to 13.03%, indicating inconclusive validation, and hence, additional data is preferably needed. Only the Advil product exhibited %PE values of 6.21% and 5.22% for AUC0-12 and AUC0-∞, respectively (Table 7).
Yet, upon employing the USP IV model, %PE regarding Cmax values were 10%–20%; also, %PE for AUC0-12 and AUC0-∞ were ≤10%, which met the US-FDA acceptance limit (i.e., the ideal IVIVC model is assumed if %PE equals or is less than 10) (Ostrowski et al., 2010). Low prediction error values observed for the USP IV dissolution model strongly confirm the validity of the IVIVC model and its predictive ability to estimate IBU in vivo performance from IR commercial products.
It is worth mentioning that the FDA requirements for IR products focus on a single-point sampling approach, where a single sample at one specified time point (60 minutes) is required to meet an acceptance criterion (≥80% Q). This approach is usually employed for QC purposes. Yet, such an approach is not appropriate during product and/or method development stages or minor changes of excipients after product approval, which should be better reflected by the multipoint sampling approach (Zhang et al., 2007). Hence, for a more discriminating dissolution method and reducing the incidence of unexpected results, multiple sampling time points and sample withdrawals are preferred (Zhang et al., 2007).
The present study outlined the differences observed among commercially available IBU products during the early, mid, and late stages of dissolution employing different USP dissolution models. Both USP II and IV succeeded as single-point dissolution assays in yielding around 80% of IBU dissolved in 60 minutes. However, actual differences related to formulation variables or changing manufacturing sites were better explained by sampling at several discrete time points.
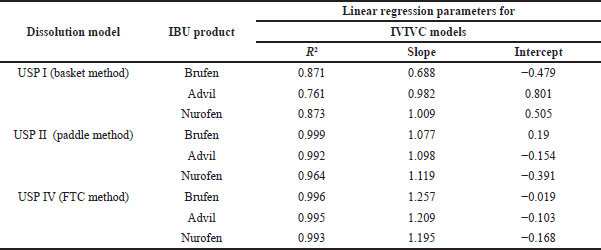 | Table 6. The obtained R2, slope, and intercept values for the IVIVC models applied for IBU commercial products. [Click here to view] |
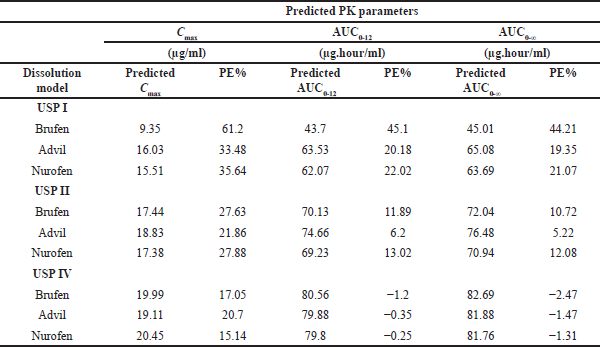 | Table 7. Predicted pharmacokinetics parameters and percentage prediction error (%PE) of IBU IR commercial product (200 mg) in different USP dissolution models. Actual PK parameters were obtained from Shin et al. (2017). [Click here to view] |
To date, the ability of a certain dissolution model to predict the bioavailability of commercial products is still under investigation. The present study pointed out the ability of the FTC model (USP IV) to simulate more adequately the in vivo performance of IBU and hence could reflect the bioavailability of the drug from IR tablets. The effective use of such a simple predictive approach could support in saving valuable resources in terms of budgets and increased costs associated with drug development within pharmaceutical industries.
CONCLUSION
The discriminatory power of different compendial dissolution models on IBU release behavior from IR commercially available products was established, with dissolution curves comparison carried out using a model-independent approach. Also, the back-calculation of the Wagner–Nelson method was tested for establishing the IVIVC between IBU in vitro data in different dissolution models and previously well-authenticated drug in vivo performance. Based on the results, the dissolution of IBU tablets (200 mg) was highly influenced by different dissolution models employed and the manufacturing sites and/or formulation variables among IR products available in different markets. The FTC method (USP IV) provided the highest IVIVC with in vivo pharmacokinetic data of the IBU IR commercial products. The dissolution criteria suggested could be utilized to develop an in vitro approach that would be predictive of drug products in vivo behavior and hence might serve as a surrogate for carrying out clinical bioequivalence studies for IBU IR tablets.
AUTHOR CONTRIBUTIONS
All authors made substantial contributions to conception and design, acquisition of data, or analysis and interpretation of data; took part in drafting the article or revising it critically for important intellectual content; agreed to submit to the current journal; gave final approval of the version to be published; and agree to be accountable for all aspects of the work. All the authors are eligible to be an author as per the international committee of medical journal editors (ICMJE) requirements/guidelines.
FUNDING
There is no funding to report.
CONFLICTS OF INTEREST
The authors report no financial or any other conflicts of interest in this work.
ETHICAL APPROVALS
This study does not involve experiments on animals or human subjects.
DATA AVAILABILITY
All data generated and analyzed are included within this research article.
PUBLISHER’S NOTE
This journal remains neutral with regard to jurisdictional claims in published institutional affiliation.
REFERENCES
Bose A, Wui WT. Convolution and validation of in vitro–in-vivo correlation of water-insoluble sustained-release drug (domperidone) by first-order pharmacokinetic one-compartmental model fitting equation. Eur J Drug Metab Pharmacokinet, 2013; 38(3):191–200. CrossRef
Bredael GM, Liang S, Hahn D. A strategy for quality control dissolution method development for immediate-release solid oral dosage forms. Dissolution Technol, 2015; 22:10–6. CrossRef
Chakraborty S, Pandya K, Aggarwal D. Establishing prospective IVIVC for generic pharmaceuticals: methodologies assessment. Drug Deliv, 2014; 5(1). CrossRef
Chevalier E, Viana M, Artaud A, Chomette L, Haddouchi S, Devidts G, Chulia D. Comparison of three dissolution apparatuses for testing calcium phosphate pellets used as ibuprofen delivery systems. AAPS PharmSciTech, 2009; 10(2):597–605. CrossRef
Costa P, Lobo JMS. Modeling and comparison of dissolution profiles. Eur J Pharm Sci, 2001; 13(2):123–33. CrossRef
Emam MF, Taha NF, Mursi NM, Emara LH. Preparation, characterization and in-vitro/in-vivo evaluation of meloxicam extruded pellets with enhanced bioavailability and stability. Drug Dev Ind Pharm. 2021; 47(1):163–75. CrossRef
Emara L, El-Menshawi B, Estefan M. In vitro-in-vivocorrelation and comparative bioavailablity of vincamine in prolonged-release preparations. Drug Dev Ind Pharm, 2000; 26(3):243–51. CrossRef
Emara LH, Taha NF, Mursi NM. Investigation of the effect of different flow-through cell designs on the release of diclofenac sodium SR tablets. Dissolution Technol, 2009; 16(2):23–31. CrossRef
Emara LH, Abdelfattah FM, Taha NF, El-Ashmawy AA, Mursi NM. In-vitroevaluation of ibuprofen hot-melt extruded pellets employing different designs of the flow through cell. Int J Pharm Pharm Sci, 2014a; 6:192–7.
Emara LH, Emam MF, Taha NF, El-ashmawy AA, Mursi NM. In-vitro dissolution study of meloxicam immediate release products using flow through cell (USP apparatus 4) under different operational conditions. Int J Pharm Pharmaceutic Sci, 2014b; 6(11):254–60.
Forrest WP, Reuter KG, Shah V, Kazakevich I, Heslinga M, Dudhat S, Patel S, Neri C, Mao Y. USP apparatus 4: a valuable in-vitrotool to enable formulation development of long-acting parenteral (LAP) nanosuspension formulations of poorly water-soluble compounds. AAPS PharmSciTech, 2018; 19(1):413–24. CrossRef
Hashem HM, Abdou AR, Mursi NM, Emara LH. Comparative in-vitrodissolution study on metformin market products using different dissolution apparatuses. Int J Pharm Pharm Sci, 2019; 11(9):65–72. CrossRef
Higgins JD, Gilmor TP, Martellucci SA, Bruce RD, Brittain HG. Ibuprofen. In: Harry GB (eds.). Analytical profiles of drug substances and excipients, vol. 27. Academic Press, Cambridge, MA, pp 265–300, 2001. CrossRef
Khan F, Li M, Schlindwein W. Comparison of in-vitrodissolution tests for commercially available aspirin tablets. Dissolution Technol, 2013; 20(1):48–58. CrossRef
Lu Z, Fassihi R. Mechanistic approach to understanding the influence of USP apparatus I and II on dissolution kinetics of tablets with different operating release mechanisms. AAPS PharmSciTech, 2017; 18(2):462–72. CrossRef
Medina JR, Cortes M, Romo E. Comparison of the USP apparatus 2 and 4 for testing the in-vitrorelease performance of ibuprofen generic suspensions. Int J Appl Pharm, 2017; 9(4):90–5. CrossRef
Moore JW, Flanner HH. Mathematical comparison of dissolution profiles. Pharm Technol, 1996; 20(6):64–74.
Ostrowski M, Baczek T, Wilkowska E. The influence of averaging procedure on the accuracy of IVIVC predictions: immediate release dosage form case study. J Pharm Sci, 2010; 99(12):5040–5. CrossRef
Rainsford K. Ibuprofen: pharmacology, efficacy and safety. Inflammopharmacology, 2009; 17(6):275–342. CrossRef
Reddy BBK, Karunakar A. Biopharmaceutics classification system: a regulatory approach. Dissolution Technol, 2011; 18(1):31–7. CrossRef
Shah VP, Lesko L, Fan J, Fleischer N, Handerson J, Malinowski H, Makary M, Ouderkirk L, Roy S, Sathe P. FDA guidance for industry: dissolution testing of immediate release solid oral dosage forms. Dissolution Technol, 1997; 4(4):15–22. CrossRef
Shin D, Lee SJ, Ha Y-M, Choi Y-S, Kim J-W, Park S-R, Park MK. Pharmacokinetic and pharmacodynamic evaluation according to absorption differences in three formulations of ibuprofen. Drug Des Devel Ther, 2017; 11:135–41. CrossRef
Taha NF, Emam MF, Emara LH. A novel combination of Soluplus®/Poloxamer for Meloxicam solid dispersions via hot melt extrusion for rapid onset of action. Part 2: comparative bioavailability and IVIVC. Drug Dev Ind Pharm., 2020; 46(8):1362–72. CrossRef
Tamilvanan S, Sa B. In-vitroand in-vivoevaluation of single-unit commercial conventional tablet and sustained-release capsules compared with multiple-unit polystyrene microparticle dosage forms of ibuprofen. AAPS PharmSciTech, 2006; 7(3):E126–34. CrossRef
Todaro V, Persoons T, Grove G, Healy AM, D’Arcy DM. Characterization and simulation of hydrodynamics in the paddle, basket and flow-through dissolution testing apparatuses-a review. Dissolution Technol, 2017; 24:24–36. CrossRef
USP-32. United State Pharmacopeia and National Formulary USP 32-NF 27; The United States Pharmacopeial Convention. Inc, Rockville MD, 2009
Wei H, Löbenberg R. Biorelevant dissolution media as a predictive tool for glyburide a class II drug. Eur J Pharm Sci, 2006; 29(1):45–52. CrossRef
Yoshida H, Kuwana A, Shibata H, Izutsu K-i, Goda Y. Effects of pump pulsation on hydrodynamic properties and dissolution profiles in flow-through dissolution systems (USP 4). Pharm Res, 2016; 33(6):1327–36. CrossRef
Zhang L, Ha K, Kleintop B, Phillips S, Scheer B. Differences in in-vitrodissolution rates using single-point and multi-point sampling. Dissolution Technol, 2007; 14(4):27–31. CrossRef