
INTRODUCTION
Cyclin-dependent kinases (CDKs) are members of the serine/threonine protein kinases family and are important modulators of the cell cycle process. Targeting the CDKs for the treatment of various types of cancer has been shown to be a valid and promising therapeutic approach (Wenzel and Singh, 2018). The CDK4 enzyme is involved in controlling the progression of the cell cycle’s G1 phase and inhibiting this enzyme prevents cell division. As the CDK4 has been observed to be overexpressed in several types of cancer, it has gained attention as a target for small molecules anticancer agents, in particular for the treatment of breast cancer (Bendris et al., 2015; Brown et al., 2015; Pandey et al., 2019). Derivatives of the pyrido[2,3-d]pyrimidin-7-one scaffold (shown in Table 1) have been shown to have CDK4 inhibitory activity with modest selectivity towards other kinases (Barvian et al., 2000). However, very limited computational studies have been applied to this class of CDK4 inhibitors. In this study, computer-aided drug design (CADD) methods have been applied to a dataset of CDK4 inhibitors to gain a better understanding and insights into the binding process and the structural requirements for achieving high activity. Ligand-based CADD methods including 2D- and 3D-quantitative structure-activity relationship (QSAR) were used to develop quantitative models that can be used for predicting the activity of novel compounds as well as for demonstrating the important physicochemical properties that affect the activity of the compounds (Kubinyi et al., 2006; Lewis and Wood, 2014). Also, molecular docking, which is a structure-based CADD method, was used to elaborate the binding interactions of the compounds inside the active site of the CDK4 enzyme (Pinzi and Rastelli, 2019; Torres et al., 2019). Finally, virtual screening was carried out on the ChEMBL database by applying the developed and validated QSAR model and the molecular docking to identify potentially active novel CDK4 inhibitors with improved pharmacokinetic properties (Gaulton et al., 2017; Guedes et al., 2018; Neves et al., 2018).
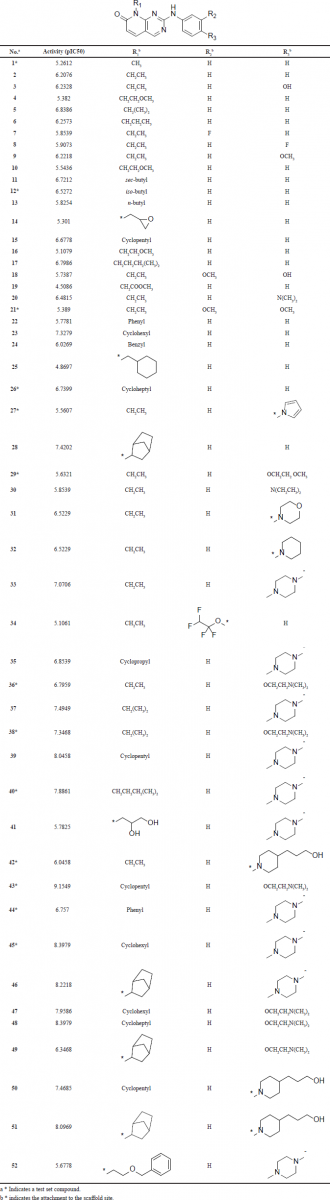 | Table 1. The structures of the dataset compounds and their reported pIC50 values. [Click here to view] |
MATERIALS AND METHODS
Dataset
The dataset selected for molecular modeling studies compromises 52 CDK4 inhibitors based on the pyrido[2,3-d]pyrimidin-7-one scaffold (Table 1) that has a phenyl ring attached to secondary amine (Barvian et al., 2000). The structures of the dataset and their reported pIC50 values are listed in Table 1. All the compounds have been assayed using the same method and conditions. The activity of the compounds spans a wide range of more than three orders of magnitude with a good activity distribution. These properties make the dataset suitable for molecular modeling studies, in particular for QSAR analysis (Tropsha, 2010).
2D-QSAR modeling
The 2D-QSAR method uses molecular descriptors that are based on the graph of the structure (i.e., 2D information) and correlates those descriptors with the activity (Lewis and Wood, 2014). In this study, the PaDEL-Descriptor software was used to calculate a total of 1,444 2D-descriptors (Yap, 2011). The dataset was divided into a training set (75%, 39 compounds) and a test set (25%, 13 compounds) using the Kennard--Stone algorithm (Puzyn et al., 2011). Table 1 indicates the training and test set compounds. A common pretreatment process was applied on the calculated descriptors, including the removal of descriptors with constant or near-constant values (a variance cutoff of 0.001 was used) and the removal of highly intercorrelated descriptors (a correlation cutoff of 0.6 was used). The remaining descriptors were used to develop the 2D-QSAR model using multiple linear regression (MLR). A genetic algorithm (GA) was used as a variable selection method (Ambure et al., 2015). The developed model was validated internally and externally using common validation procedures. Internal validation included leave-one-out (LOO) cross-validation (CV), as well as calculation of common parameters such as the root mean square error (RMSE) and correlation coefficient of CV (Q2LOO). The test set was used for external validation to assess the predictive ability of the model (Roy et al., 2016; Veerasamy et al., 2011).
3D-QSAR modeling
Alignment
The alignment of structures is a crucial step in the process of 3D-QSAR modeling. In this study, two different alignment methods implemented in the Open3DAlign software were used, namely, the atom-based and the pharmacophore-based methods (Tosco et al., 2011). Both methods require a template for aligning the other structures onto it. Compound 43 was used as the alignment template as it is the most active compound. The atom-based method operates by attempting to match the atoms of the template structure and the atoms of the probe structure (i.e., the structure to be aligned). The matching of the atoms is based on the properties of the atoms such as the partial charge (Tosco et al., 2011). The pharmacophore-based method represents the structures by their pharmacophore features only, and then it attempts to align the structures in a way that maximizes the overlap of their pharmacophore features that are of the same type (Taminau et al., 2008). Both methods were applied to generate two alignments. The alignment with the higher score was selected for developing the 3D-QSAR model.
Model development
The aligned structures were used for developing 3D-QSAR models. The Open3DQSAR software was used for calculating the molecular interactions fields (MIFs) as well as for partial least squares regression (PLS) analysis (Tosco and Balle, 2011). Electrostatic and steric MIFs were calculated and the common procedure for variables pretreatment was carried out including the truncation of grid points with extreme energy values (cut off = 30.0 kJ/mol) and the exclusion of variables with constant or near-constant values. Following the variables pretreatment processes, PLS regression was used to develop the statistical models (Kubinyi et al., 2006). The number of PLS components was determined based on the value of the Q2. The models were validated internally and externally in a similar manner as described for the 2D-QSAR model.
Molecular docking
Molecular docking is an essential tool in the drug design and discovery process. In this study, docking was used to understand the ligand–protein interactions as well as in virtual screening to identify novel CDK4 inhibitors (Torres et al., 2019). The AutoDock Vina software was used for docking the structures (Trott and Olson, 2010). Although several crystal structures of the CDK4 enzyme are available in the Protein Data Bank (PDB) database, none of them has a cocrystallized ligand, and they are in an inactive state. In this study, a hybrid model of the CDK4 enzyme constructed by Shafiq et al. (2012) was used for the docking experiment. Briefly, the model is constructed using a homology modeling approach from both a CDK4 crystal structure (inactive state) and a CDK2 crystal structure (in the active state) to produce a CDK4 hybrid model in the active state. The model was further refined and validated using molecular dynamics simulation.
Although the CDK4 hybrid model is in the active state, it lacks a ligand in the active site. To do a redocking experiment and validate the docking procedure, the CDK4 hybrid model was superimposed onto a crystal structure of a CDK6 (PDB-ID: 2EUF) enzyme that has a cocrystallized ligand, and then the protein of the CDK6 was removed, leaving the ligand in the hybrid model active site as a ligand–protein complex. The sequence identity between the CDK4 and CDK6 is 68%. This strategy has been successfully used by Al-Warhi et al. (2020). Redocking of the ligand and measurement of the root mean square deviation (RMSD) was carried out to assess the accuracy of the docking procedure.
Virtual screening
To discover novel potentially active CDK4 inhibitors with improved drug-like properties, virtual screening of the ChEMBL database compounds was carried out. The ChEMBL database is widely used in drug discovery as it contains a large number of curated drug-like compounds (Gaulton et al., 2017). Initially, a substructure search was carried out to retrieve compounds from the database that have the general scaffold of the compounds used in the study. In the next step, the compounds were filtered using the Lipinski rule of five to retain only the compounds with good absorption, distribution, metabolism, and excretion (ADME) profile (Pollastri, 2010). The activities of the remaining compounds were predicted using the 3D-QSAR model; initially, the alignment was carried out onto the template structure, and then the developed model was applied to predict the activities. Compounds with submicromolar predicted activities were retained while others were removed. In the final step, the remaining compounds were docked into the target enzyme using the validated docking procedure, and compounds that were successfully docked were visually inspected and selected as potential novel CDK4 inhibitors.
RESULTS AND DISCUSSION
2D-QSAR modeling
A total of five descriptors were selected by the GA-MLR method, the descriptors alongside their contribution and description are shown in Table 2. The equation of the model is as follows:
pIC50 = 5.617(±0.279) +2.081(±0.414)AVP_2 -0.635(±0.543)VR1_Dt–1.602(±0.621) MATS5s –0.018(±0.567) MDEO_12+1.378(±0.410) VE1_Dzv
The initial term in the equation corresponds to the Y-intercept and the standard deviation values are in the parenthesis. The statistical parameters of the obtained 2D-QSAR model via GA-MLR are presented in Table 3. The model exhibited significant internal and external validation parameters, as demonstrated by a Q2-value of 0.629, which is higher than the threshold value (0.5) for considering the model predictive. Similarly, the coefficient of determination (R2(test)) value of 0.697 is higher than the threshold value (0.6) for considering the model predictivity (Golbraikh and Tropsha, 2002). Also, both the RMSE and RMSE(test) have relatively low values, indicating the validity of the model (Wenzel and Singh, 2018). Figure 1 shows the plot of the predicted activity by the model and the observed activity of the compounds.
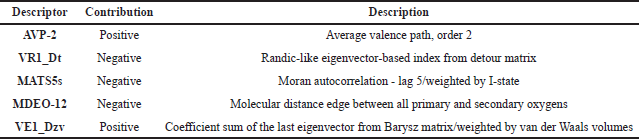 | Table 2. The molecular descriptors selected by the GA-MLR method. [Click here to view] |
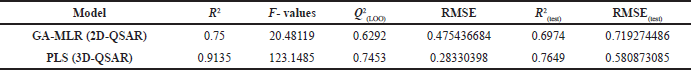 | Table 3. The statistical parameters of the developed QSAR models. [Click here to view] |
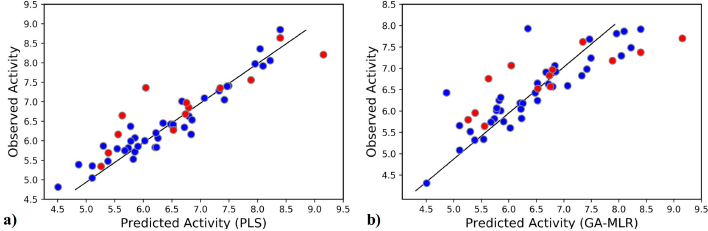 | Figure 1. The observed activity against the predicted activity plot: (a) the 3D-QSAR model and (b) the 2D-QSAR model (blue points indicate training set and red points indicate test set). [Click here to view] |
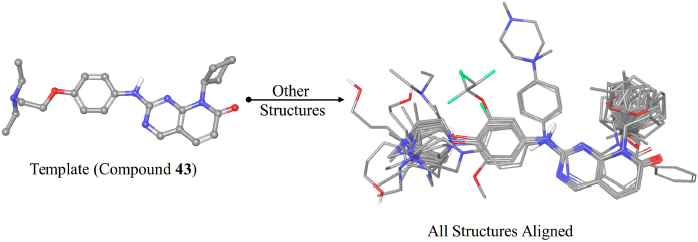 | Figure 2. The alignment of the structures used for 3D-QSAR modeling aligned onto compound 43. [Click here to view] |
3D-QSAR modeling
The pharmacophore-based alignment of the compounds was used for 3D-QSAR modeling as it demonstrated a higher score than the atom-based alignment methods. The aligned structures are shown in Figure 2. The 3D-QSAR model exhibited more statistically significant parameters compared to the 2D-QSAR model. In terms of internal validation, the 3D-QSAR model showed a higher value of R2, F-value, and Q2 while the RMSE was lower than the 2D-QSAR model. Also, the external validation parameter R2(test) is higher, and the RMSE(test) value was lower, indicating a more predictive model. In general, the improved validation parameters of the 3D-QSAR model indicate the importance of the 3D conformations of the structures in the binding process to the target protein. As the 3D-QSAR model was validated internally and externally and demonstrated predictive ability, the contour maps of the steric and electrostatic fields were visualized onto the most active compound (43).
3D-QSAR visualization
Visualization of the contour maps of the 3D-QSAR model allows for the identification of regions where electrostatic or steric substituents improve or reduce the activity. Figure 3a shows the visualization of the electrostatic field onto compound 43. The red contours represent regions where negatively charged substituents or hydrogen bond acceptors are favorable for high activity. The most significant region is near the phenyl ring, which can be explained by the partially negative nature of the aromatic ring due to the cloud of pi-electrons. Also, the partial negative charge of the oxygen directly attached to the phenyl ring which can act as a hydrogen bond acceptor in compound 43 contributes to this region. The blue areas represent regions where negatively charged groups or hydrogen bond acceptors reduce the activity. The most significant areas are positioned near the R1 group. They can be explained as the compounds with low activity contain substituents with negative partial charges; for instance, compound 19 which is the least active compound contains an ester substituent; similarly, compounds 16, 4, and 14 contain substituents with partially negative ether groups.
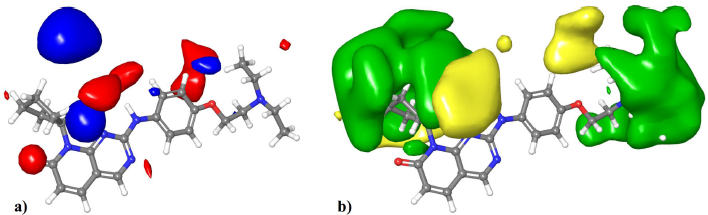 | Figure 3. Visualization of the 3D-QSAR contour maps. (a) The electrostatic field (red regions: negatively charged groups and hydrogen bond acceptors are favorable; blue regions: negatively charged groups and hydrogen bond acceptors are unfavorable). (b) The steric field (green regions: bulky substituents are favorable; yellow regions: bulky substituents are unfavorable). [Click here to view] |
Figure 3b shows the visualization of the steric field’s contour map onto compound 43. The green regions indicate areas where bulky substituents can increase the activity. The most significant contour region is around the R1 substituent. They can be seen as the most active compounds of the series that have a cycloalkyl group at this position. For instance, the three highest active compounds 43, 45, and 48 contain cyclopentyl, cyclohexyl, and cycloheptyl substituents at this position, respectively. On the other hand, most compounds with moderate to low activity have methyl or polar substituents at this position. Also, a similarly significant area extended from the R2 position is present. This indicates that analogs with extended R2 substituents can be beneficial for activity, as in compounds 43 and 48. The yellow regions indicate areas where bulky substituents decrease the activity. The most significant region is extended near the R1 position; this shows that substituents with high extension from the R1 position can be detrimental to the activity. The least active compounds 19, 25, and 16 have a substituent with an alkyl chain from this position. Overall, a cycloalkyl group directly attached to the R1 without extension is the optimum substituent for high activity.
Molecular docking
The redocking experiment of the ligand in the CDK4 hybrid model successfully reproduced a close conformation with an RMSD value of 1.292 Å, indicating the validity of the docking accuracy. The cocrystallized ligand in the 2EUF PDB record is highly similar to the structures of this study. Figure 4 shows the superimposed docked ligand on the original one.
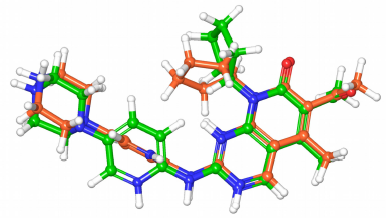 | Figure 4. The docked ligand (green) conformation with the redocked ligand (orange) conformation superimposed. The RMSD value is 1.292 Å. [Click here to view] |
The binding interactions between compound 43 and the residues of the active site are shown in Figure 5. The amine N acts as a hydrogen bond donor forming a hydrogen bond with VAL96; the distance of the interaction was determined to be 2.7 Å, which makes it in the optimum range for a strong hydrogen bond interaction. The other hydrogen bond is formed between the side chain of HIS95 and the ring N at a distance of 3.0 Å (Fabiola et al., 2002). The bi-ring system is stabilized in the binding pocked via several hydrophobic and pi-alkyl interactions with the hydrophobic residues including ALA33, LEU147, VAL72, and ALA157. Those hydrophobic interactions seem to have a crucial role in positioning the structure inside the active site. The cyclopentyl ring is extended in the hydrophobic pocket making favorable hydrophobic interactions with VAL20. The phenyl ring is positioned feasibly to form amide–pi stacked interaction with a backbone amide group of ASP97. Also, the hydrophobic side chain of ILE12 is positioned at a close distance to the phenyl ring for the formation of hydrophobic interactions.
Figure 6 summarizes the effects of the different groups on the activity of the compounds deduced from the 3D-QSAR interpretation. Also, the interactions of different parts of the structure elaborated from the molecular docking are shown on the most active compound (43).
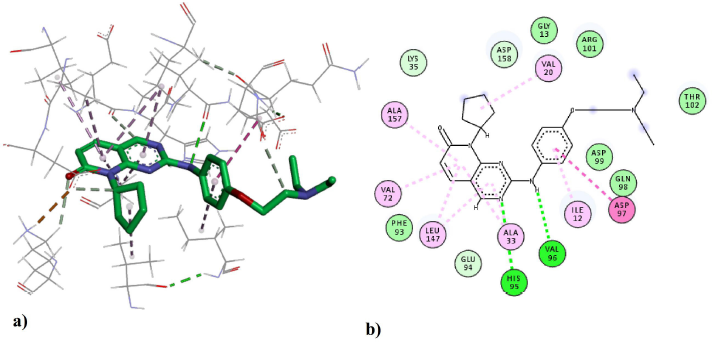 | Figure 5. The ligand–protein interactions of the docked compound 43 in the active site of the CDK4 enzyme: (a) the 3D-pose and interactions with the residues in the active site and (b) the 2D-depiction of the interactions. Green dashed lines indicate hydrogen bonds and pink dashed lines indicate hydrophobic interactions. [Click here to view] |
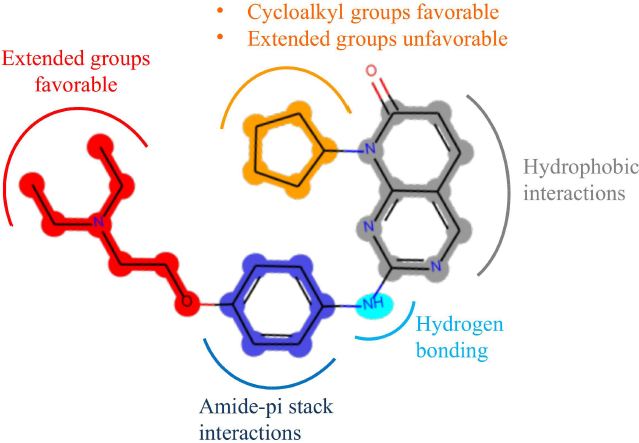 | Figure 6. Summary of the favorable type of groups as well as the important interactions visualized on compound 43. [Click here to view] |
Virtual screening
The substructure query of the ChEMBL database using the general scaffold of the studied compounds retrieved a total of 445 matching structures. These structures were preprocessed and filtered using the Lipinski rule of five to only retain compounds with good ADME properties. A total of 226 compounds were retrieved after this step. Those remaining compounds were aligned onto the template compound (43) and the 3D-QSAR model was applied to predict their activities. The 3D-QSAR model was used because it demonstrated a better predictive ability and more statistically significant validation parameters. A total of 90 compounds with submicromolar predicted activity were found. The final stage of the virtual screening involved docking and visual inspection of compounds to select the best lead-like structures. A total of six novel compounds were selected as potential CDK4 inhibitors with good ADME properties. Table 4 shows a list of the chemical structures of the compounds with their respective QSAR-predicted activity and the binding energy calculated by docking. The calculated docking binding energies of the compounds indicate potentially good binding affinity, which is consistent with the predicted activity by the QSAR model. Compound 1 has the highest activity predicted by the QSAR model and the second highest binding affinity calculated by docking, making it the best candidate lead compound. On the other hand, compound 6 has the lowest activity predicted by the QSAR model as well as the least binding affinity calculated by the docking, indicating a lower probability of being highly active. The Lipinski rule of five properties of the identified compounds is reported in Table 5. Overall, all these derivatives have not been previously reported as CDK4 inhibitors and are promising lead-like compounds.
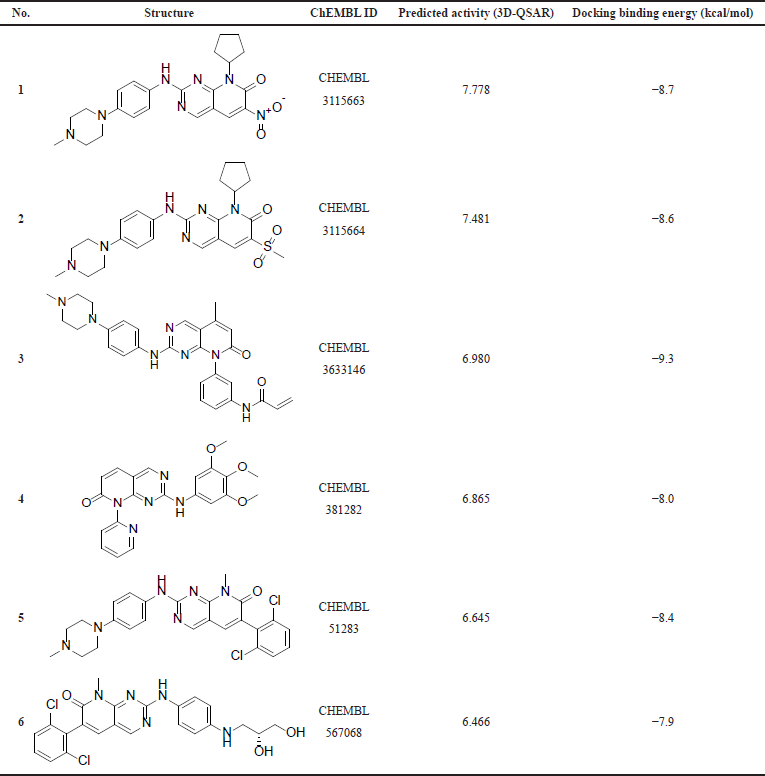 | Table 4. The compounds identified by virtual screening. [Click here to view] |
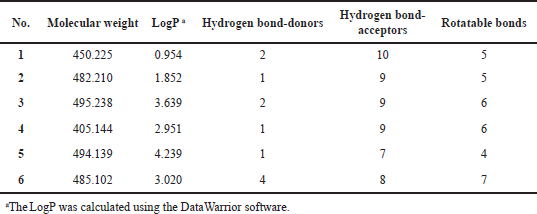 | Table 5. The Lipinski rule of five properties of the identified virtual screening compounds. [Click here to view] |
CONCLUSION
Structure-based and ligand-based CADD methods were applied on a dataset of CDK4 inhibitors to gain a better understanding and insights into the physicochemical properties required for activity. Validated 2D- and 3D-QSAR models were developed using GA-MLR and PLS methods, respectively. The 3D-QSAR model possessed more statically significant validation parameters and predictive power. Also, contour maps of the 3D-QSAR model were visualized and revealed the important regions in terms of electrostatic and steric properties that affect the activity. Molecular docking was carried out and revealed the important binding interactions between the compounds and the residues at the active site of the target enzyme. The developed 3D-QSAR model and the validated docking procedure were used in virtual screening of the ChEMBL database and six novel compounds were identified as potential CDK4 inhibitors with drug-like properties.
ACKNOWLEDGMENTS
The authors acknowledge the Drug Theoretics and Cheminformatics Laboratory (DTC Lab) for providing freely accessible QSAR development and validation tools that were used in parts of this work.
LIST OF ABBREVIATIONS
ADME: Absorption, distribution, metabolism, and excretion; ALA: Alanine; Å: Angstrom; ASP: Aspartate; CADD: Computer-aided drug design; CDK: Cyclin-dependent kinase; GA: Genetic algorithm; HIS: Histidine; ILE: Isoleucine; LEU: Leucine; LOO: Leave-one out; MIF: Molecular interaction field; MLR: Multiple linear regression; PDB: Protein Data Bank; PLS: Partial least squares; Q2: Correlation coefficient of cross-validation; QSAR: Quantitative structure-activity relationship; R2:Coefficient of determination; RMSD: Root mean square deviation; RMSE: Root mean square error; VAL: Valine.
AUTHOR CONTRIBUTIONS
All authors made substantial contributions to conception and design, acquisition of data, or analysis and interpretation of data; took part in drafting the article or revising it critically for important intellectual content; agreed to submit to the current journal; gave final approval of the version to be published; and agree to be accountable for all aspects of the work. All the authors are eligible to be an author as per the international committee of medical journal editors (ICMJE) requirements/guidelines.
FUNDING
There is no funding to report.
CONFLICTS OF INTEREST
The authors report no financial or any other conflicts of interest in this work.
ETHICAL APPROVALS
This study does not involve experiments on animals or human subjects.
PUBLISHER’S NOTE
This journal remains neutral with regard to jurisdictional claims in published institutional affiliation.
REFERENCES
Al-Warhi T, El Kerdawy AM, Aljaeed N, Ismael OE, Ayyad RR, Eldehna WM, Abdel-Aziz HA, Al-Ansary GH. Synthesis, biological evaluation and in silico studies of certain oxindole–indole conjugates as anticancer CDK inhibitors. Molecules, 2020; 25(9):2031. CrossRef
Ambure P, Aher RB, Gajewicz A, Puzyn T, Roy K. “NanoBRIDGES” software: open access tools to perform QSAR and nano-QSAR modeling. Chemom Intell Lab Syst, 2015; 147:1–13. CrossRef
Barvian M, Boschelli DH, Cossrow J, Dobrusin E, Fattaey A, Fritsch A, Fry D, Harvey P, Keller P, Garrett M, La F. Pyrido [2, 3-d] pyrimidin-7-one inhibitors of cyclin-dependent kinases. J Med Chem, 2000; 43(24):4606–16. CrossRef
Bendris N, Lemmers B, Blanchard JM. Cell cycle, cytoskeleton dynamics and beyond: the many functions of cyclins and CDK inhibitors. Cell Cycle, 2015; 14(12):1786–98. CrossRef
Brown NR, Korolchuk S, Martin MP, Stanley WA, Moukhametzianov R, Noble ME, Endicott JA. CDK1 structures reveal conserved and unique features of the essential cell cycle CDK. Nat Commun, 2015; 6(1):1–12. CrossRef
Fabiola F, Bertram R, Korostelev A, Chapman MS. An improved hydrogen bond potential: impact on medium resolution protein structures. Protein Sci, 2002; 11(6):1415–23. CrossRef
Gaulton A, Hersey A, Nowotka M, Bento AP, Chambers J, Mendez D, Mutowo P, Atkinson F, Bellis LJ, Cibrián-Uhalte E, Davies M. The ChEMBL database in 2017. Nucleic Acids Res, 2017; 45(D1):D945–54. CrossRef
Golbraikh A, Tropsha A. Beware of q2! J Mol Graphics Modell, 2002; 20(4):269–76. CrossRef
Guedes IA, Pereira FS, Dardenne LE. Empirical scoring functions for structure-based virtual screening: applications, critical aspects, and challenges. Front Pharmacol, 2018; 9:1089. CrossRef
Kubinyi H, Folkers G, Martin YC. 3D QSAR in drug design: recent advances. New York, USA: Springer Science & Business Media. Springer Science & Business Media, 2006.
Lewis RA, Wood D. Modern 2D QSAR for drug discovery. Wiley Interdiscip Rev Comput Mol Sci, 2014; 4(6):505–22. CrossRef
Neves BJ, Braga RC, Melo-Filho CC, Moreira-Filho JT, Muratov EN, Andrade CH. QSAR-based virtual screening: advances and applications in drug discovery. Front Pharmacol, 2018; 9:1275. CrossRef
Pandey K, An HJ, Kim SK, Lee SA, Kim S, Lim SM, Kim GM, Sohn J, Moon YW. Molecular mechanisms of resistance to CDK4/6 inhibitors in breast cancer: a review. Int J Cancer, 2019; 145(5):1179–88. CrossRef
Pinzi L, Rastelli G. Molecular docking: shifting paradigms in drug discovery. Int J Mol Sci, 2019; 20(18):4331. CrossRef
Pollastri MP. Overview on the rule of five. Curr Protoc Pharmacol, 2010; 49(1):9–12. CrossRef
Puzyn T, Mostrag-Szlichtyng A, Gajewicz A, Skrzy?ski M, Worth AP. Investigating the influence of data splitting on the predictive ability of QSAR/QSPR models. Struct Chem, 2011; 22(4):795–804. CrossRef
Roy K, Das RN, Ambure P, Aher RB. Be aware of error measures. Further studies on validation of predictive QSAR models. Chemom Intell Lab Syst, 2016; 152:18–33. CrossRef
Shafiq MI, Steinbrecher T, Schmid R. Fascaplysin as a specific inhibitor for CDK4: insights from molecular modelling. PLoS One, 2012; 7(8):e42612. CrossRef
Taminau J, Thijs G, De Winter H. Pharao: pharmacophore alignment and optimization. J Mol Graphics Modell, 2008; 27(2):161–9. CrossRef
Torres PH, Sodero AC, Jofily P, Silva-Jr FP. Key topics in molecular docking for drug design. Int J Mol Sci, 2019; 20(18):4574. CrossRef
Tosco P, Balle T, Shiri F. Open3DALIGN: an open-source software aimed at unsupervised ligand alignment. J Comput Aided Mol Des, 2011; 25(8):777. CrossRef
Tosco P, Balle T. Open3DQSAR: a new open-source software aimed at high-throughput chemometric analysis of molecular interaction fields. J Mol Model, 2011; 17(1):201–8. CrossRef
Tropsha A. Best practices for QSAR model development, validation, and exploitation. Mol Inf, 2010; 29(6–7):476–88. CrossRef
Trott O, Olson AJ. AutoDock Vina: improving the speed and accuracy of docking with a new scoring function, efficient optimization, and multithreading. J Comput Chem, 2010; 31(2):455–61. CrossRef
Veerasamy R, Rajak H, Jain A, Sivadasan S, Varghese CP, Agrawal RK. Validation of QSAR models-strategies and importance. Int J Drug Des Discov, 2011; 3:511–9.
Wenzel ES, Singh AT. Cell-cycle checkpoints and aneuploidy on the path to cancer. In Vivo, 2018; 32(1):1–5. CrossRef
Yap CW. PaDEL-descriptor: an open source software to calculate molecular descriptors and fingerprints. J Comput Chem, 2011; 32(7):1466–74. CrossRef