INTRODUCTION
Sidaguri (Sida rhombifolia) is one of the famous Sida species among 200 others, belonging to the Malvaceae family. This species is widely distributed in tropical and subtropical regions and has been used to treat many diseases such as headaches, tuberculosis, diabetes, malaria, hemorrhoids, wounds, rheumatic, cardiac disease, diarrhea, and skin diseases for thousands of years (Ferro et al., 2019; Rohman et al., 2020). The studies of Sidaguri have been conducted for the past 50 years. Many studies reported that Sidaguri extract provides potent free radical scavenging activity toward 2,2′-diphenil-1-picrylhydrazyl (DPPH) radical, 2,2′-azinobis-3-ethylbenzothiazoline-6-sulfonic acid (ABTS•+) radical, reducing power, superoxide scavenging activity, antibacterial activity, and anti-inflammatory activities (Ferro et al., 2019; Mah et al., 2017). These biological activities are manifestation of the secondary metabolites which are bioactive compounds produced by Sidaguri. The production of the bioactive compound was significantly affected by extrinsic factors such as climate, temperature, sun exposure, rainfall, and soil type (Kumar et al., 2017). The fact that Sidaguri produced various metabolites which are beneficial to human health makes it necessary to analyze those metabolites and bioactive compounds expressed by antioxidant activities for controlling their quality comprehensively.
Extraction is a critical analytical step to evaluate those bioactive compounds from solid samples prior to their analytical determination. However, the extraction using conventional method is time-consuming and needs more solvent leading to the massive production of the waste of organic solvents which are harmful to human health and environment (Khoddami et al., 2013). The combination of these facts with the recent trends of increasing awareness in environmental, economic, and safety considerations make the extraction techniques move to use green extraction techniques to be used in food, cosmetics, and pharmaceutical industries (Irnawati et al., 2021).
Several novel extraction techniques have been developed, such as ultrasound-assisted extraction (UAE), microwave-assisted extraction (MAE), and pressured liquid extraction, in order to obtain a higher concentration of phenolic compounds from their sources in a shorter time with a lower volume of solvent. UAE is more considered over other novel extraction methods due to its lower cost and comfort to operate (Tao et al., 2014). The use of UAE is not limited by a solvent, contrary to MAE that should use solvents that are transparent to microwaves. Therefore, UAE could be run for a wide range of targeted compounds. In addition, the application of UAE also inhibits the degradation of the bioactive compounds (Wang et al., 2016).
The mechanism of UAE is based on the cavitation effect, which leads to cell wall rupture generating the solvent to penetrate into the plant material to wash out the desired compounds efficiently (Wu et al., 2019). The formation of the cavitation bubble is related to the power of ultrasound employed. Aside from the power of ultrasound, there are some other factors affecting the extraction efficiency, including the concentration of solvent, extraction temperature, and ratio of solvent to solid (Setyaningsih et al., 2019). Therefore, those factors require optimization to obtain extract with the optimum antioxidant activity.
The optimization of extraction could be conducted using Box–Behnken design (BBD) to describe the optimum condition of those selected factors. The BBD is selected due to the fact that BBD can predict the parameters of the quadratic model, build sequential designs, and detect lack of fit, thus making it suitable for response surface methodology (RSM) (Ferreira et al., 2007). From literature studies, the extraction of Sidaguri was carried out using one variable at one time which neglected the interaction among factors contributing to the extraction efficiency; therefore, experimental design-based extraction is needed to overcome this problem. In addition, there are no reports regarding the antioxidant activities and phenolics contents from Indonesian Sidaguri; therefore, the objectives of this study were (1) to optimize the extraction of Sidaguri having antioxidant activities, (2) to evaluate the antioxidant activities of extracts resulting from the optimized condition using DPPH radical scavenging assay and Trolox equivalent antioxidant capacity (TEAC) assay, and (3) to evaluate the total phenolic contents (TPCs) using Folin–Ciocalteu method.
MATERIALS AND METHODS
Materials
The leaves of Sidaguri were harvested from several regions in Daerah Istimewa Yogyakarta (Depok, Imogiri, Kretek, Cangkringan, and Ngempak) and Central Java (Manisrenggo, Borobudur, and Mungkid) in the morning, during the stages of flower appearance. Distilled water and purified water were purchased from PT, Ikapharmindo Putramas, Indonesia. The identification of plant material was carried out in the Department of Pharmaceutical Biology, Faculty of Pharmacy, Universitas Gadjah Mada, under the supervision of botanist Dr. Djoko Santosa. Methanol for analysis, Na2Co3, and Folin–Ciocalteu reagent were purchased from E. Merck (Darmstadt, Germany); DPPH, ABTS, potassium persulfate, 6-hydroxy-2,5,7,8-tetramethylchroman-2-carboxylic acid (Trolox), and gallic acid 97.5% were purchased from Sigma (Aldrich, USA).
Sample preparation
The preparation of powder from leaves was carried out according to Rafi et al. (2020) with slight modification. The leaves of Sidaguri from different regions were sorted from the herb and then dried using the heating method using an oven at a temperature of 60°C for 24 hours. The size reduction of the dried leaves is carried out using a coffee grinder that is available on the market and the homogenization is carried out using a household sieve. The dried leaves of Sidaguri were then pulverized into powder using a disk mill and the obtained powder was used for further analytical steps.
Optimization of UAE
The Sidaguri leave powder is weighed as much as 0.5 g, placed in a 30 ml vial, and extracted using UAE. The UAE used in this study is ultrasound probe Hielcher UP200ST with ultrasonic frequency of 24 kHz. The optimum condition of UAE was obtained by evaluating four factors, namely (1) solvent to solid ratio, (2) temperature of extraction, (3) MeOH concentration (in distilled water), and (4) sonication power using BBD based on response to radical DPPH activity (Table 1). The extraction time was evaluated subsequently of 5, 10, 15, 20, and 25 minutes. The optimum UAE condition was subsequently used for extraction of Sidaguri leave powder and the extracts obtained were subjected to its antioxidant activities and total phenolic contents.
Experimental design
Box–Behnken randomized block design is employed to obtain the optimum extraction condition by evaluating the four aforementioned factors. Twenty-seven experiments with three repetitions of center points along with responses were statistically analyzed using Statgraphics Centurion XVII (Statpoint Technique, Inc., Warrenton, VA). The experimental design used along with responses obtained was compiled in Table 2.
Antioxidant activity using DPPH radical scavenging assay
DPPH radical scavenging assay was performed according to Muritala et al. (2018) with slight modification. A 0.5 g of dried Sidaguri powder is extracted with 5, 10, and 15 ml of 0%, 50%, and 100% methanol/distilled water mixture solvent (according to experimental design) and 100 µl was taken and was added to 2.9 ml DPPH (91.296 µmol dissolved in methanol) in a test tube. The solution is incubated for 50 minutes in a dark place at room temperature. The absorbance of the solution is measured using spectrophotometer (Genesys 10S UV-Vis, Japan) at a maximum wavelength of 516 nm. The percentage of radical scavenging activity radical scavenging activities (% RSA) is calculated as
| Table 1. Codes of independent variables and their actual levels. |
| Table 2. Experimental design of Box–Behnken for four factors along with responses. |
The blank used was 2.9 ml DPPH 100 µl of methanol/water mixture and treated the same as the sampling procedure and recorded at 516 nm.
ABTS radical cation decolorization assay
ABTS•+ assay was performed according to Prommuak et al. (2008) with slight modification. This assay was carried out by reacting 7 mM ABTS solution with 2.45 mM potassium persulfate solution and allowing the mixture to stand in dark at room temperature for 12–16 hours before use. The procedure is carried out by adding 30 µl of extracted dried Sidaguri powder that the extraction condition obtained from the optimization of extraction and 3 ml of the ABTS•+ radical cation solution which was diluted with methanol at a ratio of 1:10 and the absorbance was recorded at 731 nm against blank after 6 minutes. The standard curve is prepared using seven different concentrations of Trolox (2, 5, 7, 10, 12, 15, and 17 mg/l) and treated the same as the sampling procedure. The results were expressed as mg Trolox Equivalent per gram Sidaguri powder (mg TE/g sample).
Total phenolic content assay
Determination of phenolics content was carried out according to Chun et al. (2003) with slight modification. A 0.1 ml of sample (extracted dried Sidaguri powder that the extraction condition obtained from optimization of extraction) is placed to 10 ml volumetric flask and added to 0.4 ml of Folin–Ciocalteu reagent, 4 ml of Na2CO3 7% (w/v), and 5.5 ml of purified water. The solution is incubated for 2 hours and the absorbance of the solution is recorded at 765 nm. The standard curve is prepared using different concentrations of gallic acid (2–8 mg/l dissolved in purified water), treated the same as the sampling procedure, and recorded at 765 nm. The equation obtained from the standard curve regression (R2 ≥ 0.99) was employed to calculate the concentration of TPC in extracted Sidaguri powder. The levels of TPC were expressed as mg gallic acid equivalent/kg samples.
Data analysis
BBD used as the design of experiment for the optimization of UAE was created and analyzed using Statgraphics Centurion XVII (Statpoint Technique, Inc., Warrenton, VA) with RSA as the response. The confidence interval was set at 95%.
RESULTS AND DISCUSSION
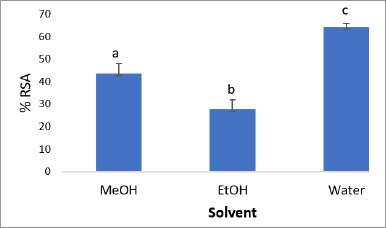
The preliminary study of extraction optimization is carried out by screening the suitable solvent mixture to be one of the optimization variables. Three types of solvents that have been examined in this study were methanol, ethanol, and water. The antioxidant activity was evaluated using RSA toward DPPH radical. The result in Figure 1 shows that the best solvent for extracting the active compounds as antioxidants is water, followed by methanol and ethanol. The significance of effects was determined by analysis of variance (ANOVA) single factor, followed by least significant difference (LSD) since they showed a significantly different result. Therefore, in this study, the mixture of methanol/water was employed as a variable in optimizing extraction condition to provide high antioxidant activity.
Optimization of UAE
Several factors affecting the efficiency of antioxidant extraction from Sidaguri such as solvent to solid ratio (X1), temperature of extraction (X2), methanol concentration (X3), and power of sonication (X4) were evaluated. The optimization was facilitated by BBD. Fifty-four extractions were finished based on the experimental design, including three center points and one repetition (Table 2).
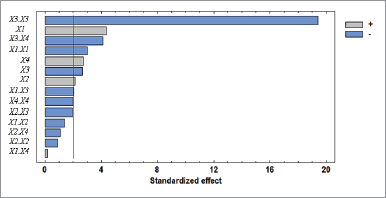
Standardized Pareto charts were employed to obtain the significant variables for antioxidant activity. The length of each bar of the Pareto chart is proportional to the value of a t-statistic calculated by dividing the corresponding estimated effect by its standard error. The bars that exceed the vertical line demonstrate the factors or combination of factors that possess a significant effect on the response (p-values < 0.05) sorted from the highest to the least contribution.
| Figure 1. Comparison of three types of solvent for extracting Sidaguri using response of antioxidant activity. RSA: radical scavenging activities using DPPH radicals. |
Based on the Pareto chart, the factors provide significant effects to the response, namely sample to solvent ratio, extraction time, methanol concentration, power, and other combination factors (Fig. 2).
RSM results were calculated based on the BBD as the experimental design in order to create a regression model for response. The obtained mathematical quadratic model was used to estimate a predictive equation for the RSA by only considering the significant factors. Only the significant factors (p < 0.05) were considered for the optimization to avoid variability if the number of factors for an optimized design is higher. The second-order polynomial equation for the model obtained for RSA is as follows:
RSA (%) = 85.5947 + 6.71709x1 + 3.26771x2 − 4.08682x3 + 4.23048x4 − 6.93621x1² − 45.0591x3² − 10.9595x3x4
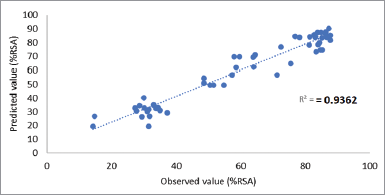
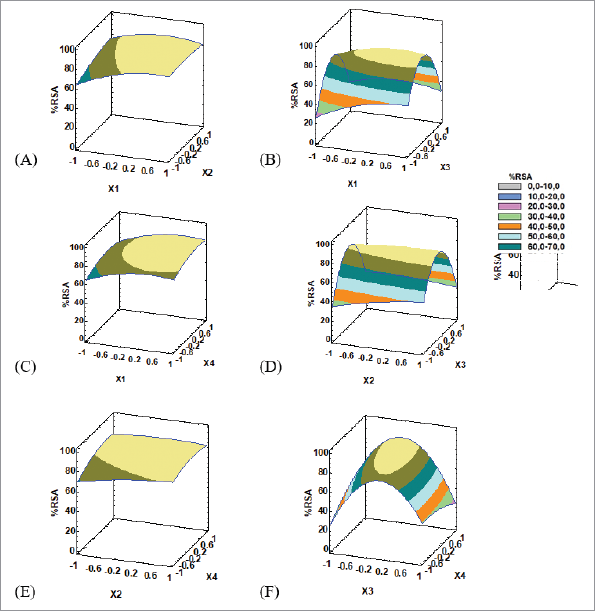
The predictive capability of the regression model was 0.9362 which was obtained from evaluating the observed versus predicted values (Fig. 3). The high slope values demonstrate that the model equations are convenient to represent the response surface. Table 3 describes the optimum point that is in the range of the studied level of each factor with RSM results that are shown in Figure 4.
The optimum solvent to solid ratio is located at a coordinate of 0.5466, which is 26:1. The positive value indicates that the higher the solvent to solid ratio, the higher the obtained response. This is complying with the statement that gradient of concentration is considered to be the driving force of mass transfer, which was greater when a higher solvent to solid ratio was used, resulting in an increase in the diffusion rate until the equilibrium has reached (Nour et al., 2016). Even though too much solvent usage could extract the majority of bioactive compounds, it can make the extract too dilute which requires additional concentration step and not enough solvent can lead to an insufficient extraction (Jakobek et al., 2015). From those statements, it is confirmed that optimum solvent to solid ratio (26:1) is the equilibrium point; thus, it could wash out the compounds responsible for antioxidant activity effectively.
| Figure 2. Standardized Pareto chart for the studied variables. |
| Figure 3. Prediction capability of the regression model (the correlation between observed and predicted values of RSA) of Sidaguri. |
| Table 3. Optimum coordinate points of each factor. |
Extraction temperature leads to softening the plant tissues, decreasing the viscosity of the solvent, increasing the diffusion coefficient of the substance, breaking down certain chemical bonds, and increasing the solubility of biochemical compounds; thus, it can help to release subjected compounds from the evaluated samples (Al-Farsi and Lee, 2008; Dai and Mumper, 2010; Setford et al., 2017). Nevertheless, cavitation is reduced at higher extraction temperatures because voids are filled with solvent vapors, leading to less violent collapse. It can be concluded that the optimized extraction temperature (45.45°C) could extract the subjected compounds in Sidaguri and it also produces optimum cavitation.
The optimum methanol concentration of 42% is located at the coordinate of −0.1615 which negatively affects the response. The negative coordinate indicates that, before reaching the optimum methanol concentration, the lower the methanol concentration is, the more the compounds responsible for antioxidant activities are extracted. At this optimum methanol concentration, the optimum antioxidant level produces the highest antioxidant activities. Thus, in accordance with the principle of like dissolve like, the result shows that the polarity of 42% methanol in water is similar to the polarity of the majority of compounds that possess antioxidant
| Figure 4. RSM plot of the antioxidant optimization: (A) X1 versus X2, (B) X1 versus X3, (C) X1 versus X4, (D) X2 versus X3, (E) X2 versus X4, and (F) X3 versus X4. |
The optimum sonication power is located at the coordinates of 0.6596 which is 86% and has a positive effect. The use of high sonication power would create a great cavitation effect. At this level, the cavitation effect could rupture the plant wall entirely but not break the subjected compounds. This result agrees with other studies conducted by Saifullah et al. (2020) reporting that higher power is more suitable for the extraction of bioactive compound.
The interaction between variables of methanol concentration and power of ultrasound (X3X4) was found significant (p < 0.05), with a negative effect. Meanwhile, quadratic effects, which are methanol concentration (X3X3) and solvent to solid ratio (X1X1), are also found significant (p < 0.05) and provide a negative effect on the response.
Extraction time is considered one of the influencing factors to extraction efficiency; thus, the optimization of extraction time is necessary to be conducted. A kinetic study was used to obtain the optimum extraction time by applying five different extraction times, which are 5, 10, 15, 20, and 25 minutes, under the optimized condition. The longer the extraction time is, the longer the sample and solvent exposed to high temperature would be; it would cause a loss of solvent due to vaporization, which affects the solvent to solid ratio and leads to antioxidant losses through oxidation. Based on this result, the optimum UAE conditions obtained were solvent to solid ratio of 26:1, temperature of extraction of 45.45°C, methanol concentration of 42%, power of sonication of 86%, and time of extraction of 5 minutes.
Antioxidant activities of Sidaguri
The optimum extraction condition was applied to extract antioxidant compounds contained in Sidaguri leaves from several different regions, including the Special Region of Yogyakarta (Depok, Imogiri, Kretek, Cangkringan, and Ngemplak) and Central Java (Manisrenggo, Borobudur, and Mungkid). Another antioxidant activity assay that was used to evaluate antioxidant compounds in Sidaguri aside from RSA toward DPPH radical was the TEAC method known as ABTS radical cation decolorization assay. The mechanism of those two assays is pretty similar; the antioxidant compound in Sidaguri would donate the hydrogen atom to the DPPH and ABTS radicals; therefore, the radicals become stable and the oxidation chain reaction would be stopped.
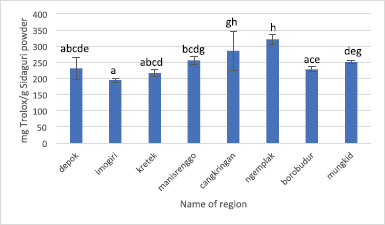
The result of RSA toward DPPH radical and TEAC of Sidaguri from eight regions evaluated its significance by ANOVA single factor, followed by LSD. The RSA values of Sidaguri from eight regions are 65.58% ± 1.38% to 83.698% ± 0.30%. Imogiri possesses the lowest RSA value; meanwhile, Kretek and Ngemplak are having the highest RSA value accounting for 83.69% ± 0.30% and 82.95% ± 0.49%, as shown in Figure 5. The different annotation of the bar indicates that the RSA is significantly different. The correlation between RSA using DPPH radical and TPC yielded coefficient of determination (R2) of 0.3805, which means that TPC does not really contribute to the RSA toward DPPH radical. The antioxidant activity using ABTS assay as expressed by TEAC of Sidaguri from eight regions is shown in Figure 6. The highest TEAC value was obtained from regions of Cangkringan and Ngemplak, accounting for 285.04 ± 59.35 and 320.81 ± 15.09 mg TEAC/g Sidaguri powder, respectively. The correlation between TEAC and TPC, as expressed by R2-value, is 0.5923.
| Figure 5. RSA using DPPH radicals of Sidaguri extract extracted using the optimized condition of UAE. Different letters indicate significant difference (p < 0.05). |
| Figure 6. RSA using ABTS radicals of Sidaguri extract extracted using the optimized condition of UAE. Different letters indicate significant difference (p < 0.05). |
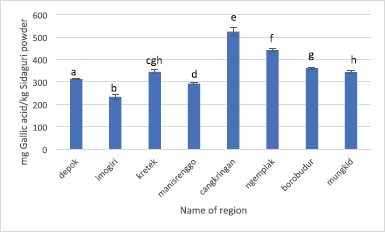
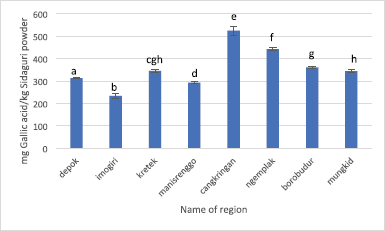
| Figure 7. TPC of Sidaguri extract extracted using the optimized condition of UAE. Different letters indicate significant difference (p < 0.05). |
Total phenolic content
The TPC result of Sidaguri obtained from eight regions is demonstrated in Figure 7. It can be seen that the TPC value ranges from 233.34 ± 10.76 to 525.06 ± 19.61 mg gallic acid/kg Sidaguri powder. The lowest TPC value belongs to Imogiri, while the highest TPC value is possessed by Cangkringan. It is clear that the TPC value of Sidaguri from eight regions has a wide range, shown by the TPC value of Cangkringan which is more than twice higher than Imogiri.
CONCLUSION
The factors affecting the efficiency of UAE were solvent to solid ratio, temperature of extraction, amplitude extraction, and methanol concentration. Solvent to solid ratio, temperature of extraction, and amplitude extraction gave the positive effect on the response, while methanol concentration exhibited gave the negative effect. The optimum conditions were solvent to solid ratio of 26:1, temperature of extraction of 45.45°C, methanol concentration of 42%, amplitude of extraction of 86%, and extraction time of 5 minutes. The RSA of Sidaguri extract extracted from the optimum condition of UAE condition were 65.5 ± 1.38% to 82 ± 0.47% (using DPPH radicals) and 194.60 ± 6.51 to 320.81 ± 15.09 mg Trolox/g Sidaguri powder (ABTS assay).
ACKNOWLEDGMENT
This study was supported by the Program of Riset Kolaborasi Indonesia (RKI), Directorate of Research, Universitas Gadjah Mada, Indonesia, 2021.
AUTHOR CONTRIBUTIONS
All authors made substantial contributions to conception and design, acquisition of data, or analysis and interpretation of data; took part in drafting the article or revising it critically for important intellectual content; agreed to submit to the current journal; gave final approval of the version to be published; and agree to be accountable for all aspects of the work. All the authors are eligible to be an author as per the international committee of medical journal editors (ICMJE) requirements/guidelines.
CONFLICTS OF INTEREST
The authors report no financial or any other conflicts of interest in this work.
ETHICAL APPROVALS
This study does not involve experiments on animals or human subjects.
PUBLISHER’S NOTE
This journal remains neutral with regard to jurisdictional claims in published institutional affiliation.
Wu Z, Ferreira DF, Crudo D, Bosco V, Stevanato L, Costale A, Cravotto G. Plant and biomass extraction and valorisation under hydrodynamic cavitation. Processes, 2019; 7(12):965. CrossRef
Wang W, Jung J, Tomasino E, Zhao Y. Optimization of solvent and ultrasound-assisted extraction for different anthocyanin rich fruit and their effects on anthocyanin compositions. Lwt-Food Sci Technol, 2016; 72: 229–38. CrossRef
Tao Y, Wu D, Zhang Q. Ultrasound-assisted extraction of phenolics from wine lees: modeling, optimization and stability of extracts during storage. Ultrason Sonochem, 2014; 21(2):706–15. CrossRef
Setyaningsih W, Saputro IE, Carrera CA, Palma M. Optimisation of an ultrasound-assisted extraction method for the simultaneous determination of phenolics in rice grains. Food Chem, 2019; 288:221–7. CrossRef
Setford PC, Jeffery DW, Grbin PR, Muhlack RA. Factors affecting extraction and evolution of phenolic compounds during red wine maceration and the role of process modelling. Trends Food Sci Technol, 2017; 69:106–17. CrossRef
Saifullah M, McCullum R, McCluskey A, Vuong Q. Comparison of conventional extraction technique with ultrasound assisted extraction on recovery of phenolic compounds from lemon scented tea tree (Leptospermum petersonii) leaves. Heliyon. 2020; 6(4): 3666. CrossRef
Rohman A, Ikhtiarini AN, Setyaningsih W, Rafi M, Aminah NS, Insanu M, Irnawati Windarsih A. Sida rhombifolia Linn: phytochemicals composition and biological activities. Int J Pharm Res, 2020; 12(Suppl. 2):2950–8. CrossRef
Rafi M, Meitary M, Septaningsih DA, Bintang M. Phytochemical profile and antioxidant activity of Guazuma ulmifolia leaves extracts using different solvent extraction. Indones J Pharm, 2020; 31(3):171–80. CrossRef
Prommuak C, De-Eknamkul W, Shotipruk A. Extraction of flavonoids and carotenoids from Thai silk waste and antioxidant activity of extracts. Sep Purif Technol, 2008; 62(2):444–8. CrossRef
Nour V, Trandafir I, Cosmolescu S. Optimization of ultrasound-assisted hydroalcoholic extraction of phenolic compounds from walnut leaves using response surface methodology. Pharm Biol, 2016; 54(10):2176–87. CrossRef
Muritala HF, Akolade JO, Akande SA, Abdulazeez AT, Aladodo RA, Bello AB. Antioxidant and alpha-amylase inhibitory potentials of Cocos nucifera husk. Food Sci. Nutr. 2018;6(6):1676–1683. CrossRef
Mah SH, Teh SS, Ee GCL. Anti-inflammatory, anti-cholinergic and cytotoxic effects of Sida rhombifolia. Pharm Bio, 2017; 55: 920–8. CrossRef
Kumar S, Yadav A, Yadav M, Yadav JP. Effect of climate change on phytochemical diversity, total phenolic content and in vitro antioxidant activity of Aloe vera (L.) Burm.f. BMC Res Notes, 2017; 10(1):1–12. CrossRef
Khoddami A, Wilkes MA, Roberts TH. Techniques for analysis of plant phenolic compounds. Molecules, 2013; 18(2):2328–75. CrossRef
Jakobek L, Boc M, Barron AR. Optimization of Ultrasonic-Assisted Extraction of Phenolic Compounds from Apples. Food Anal. Methods. 2015;8(10):2612–2625. CrossRef
Irnawati, Riyanto S, Martono S, Rohman A. The optimization of ultrasonic method for the extraction of Pumpkin seed (Cucurbita maxima). Indones J Chemom Pharm Anal, 2021; 1:43–52. CrossRef
Ferro MD, Mazzutti S, Vitali L, Muller CMO, Ferreira SRS. Integrated extraction approach to increase the recovery of antioxidant compounds from Sida rhombifolia leaves. J Supercrit Fluids, 2019; 149:10–19. CrossRef
Ferreira SLC, Bruns RE, Ferreira HS, Matos GD, David JM, Brandao GC, da Silva EGP, Portugal LA, dos Reis PS, Souza AS, dos Santos WNL. Box-Behnken design: an alternative for the optimization of analytical methods. Anal Chim Acta, 2007; 597:179–86. CrossRef
Dai J, Mumper RJ. Plant phenolics: Extraction, analysis and their antioxidant and anticancer properties. Molecules, 2010;15(10):7313–7352. CrossRef
Chun OK, Kim DO, Lee CY. Superoxide radical scavenging activity of the major polyphenols in fresh plums. J Agric Food Chem, 2003; 51: 8067-72. CrossRef
Al-Farsi MA, Lee CY. Optimization of phenolics and dietary fibre extraction from date seeds. Food Chem, 2008; 108(3):977–85. CrossRef
REFERENCES


