
INTRODUCTION
Ras genes are an ubiquitous gene family identified in both animals and plants with a fair degree of conservation. H-ras, K-ras, and N-ras, which encode highly similar proteins with molecular weights of 21,000 (Barbacid, 1987), are extensively studied and are involved in fundamental cellular processes, including survival, differentiation, motility, proliferation, and transcription (Cox and Der, 2010; Giehl, 2005). The extensive studies on the RAS pathway arise from the fact that it is commonly deregulated in human cancers and RAS-associated mutations occur in nearly 30% of human tumors (Maertens and Cichowski, 2014).
RAS constitutes molecular switches that cycle between ‘on’ and ‘off’ conformations caused by the binding of guanosine 5'-triphosphate (GTP) or guanosine diphosphate, respectively, through two major regulators – guanine nucleotide exchange factors and GTPaseactivating proteins (Díez et al., 2011). RAS GTPase-activating proteins (RASGAPs) normally catalyze the RAS–GTP hydrolysis, thereby regulating RAS and have emerged as a class of tumor suppressors that upon inactivation provide an alternative mechanism of activating RAS. RASGAPs are also involved in several other functions. RASGAP has been shown to play important roles in T-cell development and functions. Neurofibromin1, another RASGAP, is shown to promote the positive selection of T cells in the thymus (Oliver et al., 2013; Qiao et al., 2012). Another prototypical RasGap, well expressed in T cells, is p120 RasGap (RASA1). RASA1 is shown to be a regulator of Ras activation in T cells (Downward et al., 1990). However, non-conditional RASA1-deficient mice are shown to succumb at an early phase in embryonic development (Henkemeyer et al., 1995).
RASA1 has a COOH-terminal catalytic domain and NH2-terminal part with a proline-rich sequence, PH domain, SH2 and SH3 domains, and other noncatalytic domains, involved in the regulation of several proteins (Pamonsinlapatham et al., 2009). RasGap can act as both a downregulator and effector for Ras (Ekman et al., 1999; Kazlauskas et al., 1990; Klinghoffer et al., 1996). Ras-independent directional cell movement requires the association of RasGap and p190 Rho-GAP (Kulkarni et al., 2000), while inhibition of kinase activity is observed when RasGap binds to Aurora kinase domain (Gigoux et al., 2002). Other roles of RasGap include apoptosis regulation (Pamonsinlapatham et al., 2008; Yang et al., 2001), angiogenesis (Kunath et al., 2003), and protein synthesis (Panasyuk et al., 2008). However, the regulation of catalytic activity of RasGap is yet to be understood completely and positive regulators for the activity are still to be understood. The RasGap PH domain attenuates the activity of the catalytic domain (Drugan et al., 2000), while SH2/SH3 domain-containing proteins Nck1 and Nck2 mediate cytoskeletal rearrangement via membrane–receptor signaling (Blasutig et al., 2008; Buday et al., 2002). Both these adaptor proteins need to be investigated further to understand their interactions with RasGap.
In view of the selective advantages of computational methods, in this study, we have tried to gain insight into the conformational changes in the tertiary structure of human RASGAP employing molecular modeling and dynamics studies. The lack of x-ray crystallographic data for the human RasGap protein indicates the utility of computational methods for structure prediction through homology modeling, fragments-based modeling, fold recognition, and threading (Kuhlman and Bradley, 2019; Shah and Gupta, 2014). The objective of the study is to model the three-dimensional (3D) structure of RASA1 and explore its conformational-based analysis.
METHODOLOGY
RASA1_Human sequence
The amino acid sequences of RASA1_Human [AccessionP20936] is 1,047 amino acids long and were retrieved from the UniProtKB public repository database and used for 3D structure modeling and analysis in the current study.
Secondary structure prediction
The first step in studying the protein structure both experimentally as well as computationally is the identification of the protein secondary structure it includes the conserved structural features such as α-helix, extended strand, random coil, ambiguous states, and other states. The prediction of RASA1 secondary structure is carried out using the Garnier–Osguthorpe–Robson (GOR) method (Garnier et al., 1996) and self-optimized prediction method with alignment (SOPMA) (Frishman and Argos, 1997).
Tertiary structure prediction
Template selection
In the protein 3D structure prediction and modeling under the homology-based concept, selecting a suitable template is a backbone of model. Finding out a suitable template for modeling position-specific iterative (PSI)-basic local alignment search tool (BLAST) is carried out with a RASA1 protein sequence as a query and protein data bank (PDB) database as a reference (Altschul et al., 1990, 1997).
Protein structure modeling and prediction
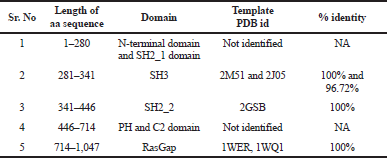
As the protein sequence of Ras1_Human showed a distinct homology with multiple templates, where amino acid residue 281–341 SH3 domain identifies a template protein PDB id: 2J05 (Ross et al., 2007), 2M51 (Dutta et al., s. d.; Kurosaki et al., s. d.), residue 341–446 SH2_2 domain identifies a template protein PDB id: 2GSB (Kurosaki et al.), residue from 714–1,047 RasGap domain identifies a template protein PDB id: 1WER and 1WQ1 (Scheffzek et al., 1996, 1997), residue 1–281 is an N-terminal and SH2_1 domain and 446–714 PH and C2 domain resembles no homology template. Hence, multiple approaches were implemented to model the entire Ras1_Human protein.
Fragment-based Homology modeling
The homology model for SH3, SH2_2, and RasGap domain is carried out using the SWISS-MODEL servers electing template protein PDB id: 2M51, 2GSB, and 1WER. SWISS-MODEL is a fully automated protein structure homology modeling server, which generates a refined 3D homology model, i.e., taking a protein sequence as a query or input, identifying the optimum aligned template structure using inbuilt BLAST algorithm, and generating a high-quality 3D structure as per the selected template structure. The quality of the model may be lost due to poor sequence-based identity between the target and the template, mostly when it falls below 20%.
Modeling of RASA1 N-Terminal domain 1–280 aa
No structural homology for the N-terminal domain of RASA1 protein led us to predict the structure from online knowledge-based sources such as Robetta and Phyre2 (Kelley et al., 2015; Kim et al., 2004). With poor 3D prediction results, we the adopted fragment-based homology modeling and short fragments ranging from three to five amino acid regular expression patterns were searched in the protein data bank using Jena Library of Biological Macromolecule (Reichert and Sühnel, 2002). Using Jena library’s regular expression pattern search algorithm, we identified 59 structural homologs/templates similar to the N-terminal region of RASA1. The templates are listed in Table 1: Supplementary data 1.
Homology and other methods
SWISS-MODEL server
Using the SWISS-MODEL homology server input, we have modeled two structures using 5M6U.pdb as a template with an identity of 24.90% to a sequence length of 178–445 aa representing the domains SH2_1, SH3, and SH2_2. Template 1WER.pdb with 100% identity to sequence length 714–1,047 is a RasGap domain.
SCRATCH
SCRATCH is an online server for the predicting protein tertiary structure and the structural features are available at http://www.igb.uci.edu/servers/psss.html (Cheng et al., 2005). The suite combines an evolutionary information in the form of profiles, fragment libraries derived from PDB, and energy functions, and adopts a machine learning algorithm to predict protein structural features and protein tertiary structures (Berman, 2000; Cheng et al., 2005). The suite includes SSpro: three-class secondary structure; SSpro8: eight-class secondary structure; ACCpro: relative solvent accessibility; CONpro: contacts with other residues compared to average; DOMpro: domain boundaries; DISpro: disordered regions; MUpro: effect of single amino acid mutation on stability; DIpro: disulfide bridges; CMAPpro: residue–residue contact maps; and 3Dpro: tertiary structure (Baldi and Cheng, 2004; Cheng et al., 2005; Pollastri and Baldi, 2002; Pollastri and Baldi, 2002). Since SCRATCH server predicts 3D structures for only 400 amino acids, we have modeled for fragments 1–280 and 447–713 using SCRATCH.
Phyre2
Phyre2 is the advanced version of Phyre, which determines the evolutionary profiles using HHblits that calculates the secondary structure from PSI-blast based secondary structure PREDiction (PSIPRED) and is scanned against a database of hidden Markov models of fold library of known structures. Indels are handled by the fragment library of a known protein structure that varies in length from 2 to 225 amino acids (Kelley et al., 2015), and fragments are fitted to the crude model using cyclic coordinate descent method (Canutescu and Dunbrack, 2003) which uses a fast graph-based technique and a side-chain rotamer library to model the side chains in their most appropriate rotamer while passing up the steric clashes (Canutescu and Dunbrack, 2003; Kelley et al., 2015; Xie and Sahinidis, 2006). The 3D structure model for RASA1 was developed using Phyre2 for predicting the protein structure by homology modeling under the ‘intensive’ mode. Using Phyre2, here we have successfully generated two model, model-1 02–1,046 length of protein sequence and model-2 181–446 amino acid sequence length with high confidence.
I-TASSER
I-TASSER executes TASSER method by predicting a secondary structure using PSIPRED and define secondary structure of proteins as a scoring function. Calculating the backbone, hydrogen bonds, short and long range correlation, and predicted surface area is carried out via the artificial neural network method (Dorn et al., 2014; Roy et al., 2010). Using I-TASSER, we have modeled a full length of sequence 1–1,047 and sequence length from 546 to 1,047 amino acids with high confidence.
Comparative model assembly
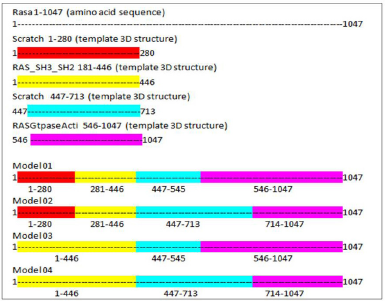
It is difficult to predict a protein structure when homology is discrete and minimum. As stated above, the automated modeling tools have generated only one full-length structure from I-TASSER. Hence, here we have adopted a comparative and fragment-based modeling approach by compiling all the fragments and full-length structure as a template to the target sequence for deriving a 3D structure model. A comparative model can be assembled from a framework of small rigid bodies or specific domain 3D structure. The approach is based on the dissection of the protein structure into conserved core regions. In this study, we have made four possible combinations to assemble the entire length of the protein sequence into the 3D structure (Figure 1). We have used Modeler 9.2 version tool from Sali Lab (Webb and Sali, 2014).
 | Figure 1. Comparative model assembly. [Click here to view] |
Model evaluation and simulation
All 3D models were qualitatively estimated by ProSA (Sippl, 1993, 2007) and Rampage (Lovell et al., 2003). Finally, all the six models were subjected to MD simulations using Nanoscale Molecular Dynamics (NAMD, formerly Not Another Molecular Dynamics Program) (Phillips et al., 2005) and visualized in VMD 9.2 (Humphrey et al., 1996). The modeled 3D structures were considered as a starting point for MD simulation. A TIP3P water box was applied by using CHARMM force field wherein 22 parameter files for proteins and lipids were utilized for proteins with similar chemical structures. The protein preliminary energy was minimized via 1,000 steps at constant temperature (37°C), followed by the simulation of 1,50,00,000 steps (2 fs) at each run is equal to 30 ns with Langevin dynamics and restart frequency at 500 steps to regulate the dynamic energy, temperature, and pressure of the system.
Impact of the proline-rich region on SH2_1, SH3, and SH2_2 domains of RasGap
A hydropathy index was calculated using Kyte and Dolittle, the method in Protscale, ExPASy website (Gasteiger et al., 2005). A high hydrophobic region was calculated in all the three domains and the distance was calculated for the before and after simulations of the modeled protein using PYMOL (Schrödinger, 2017).
RESULTS AND DISCUSSION
The RasGTPase-activating protein 1 sequence with 1,047 residues was saved in FASTA format. RasGTPase-activating protein 1 holds a specific seven-functional domain reported in Table 1 with a compositional bias of polyglycine, polyproline, and polyglutamic acid sequence in Table 2. The query protein sequences for PSI-BLAST produced a set of sequences with the highest and lowest similar sequences. The secondary structure of the proteins was predicted by GOR and SOPMA. The derived results will annotate the structural features like helix, coil, or strands which would constitute the protein secondary structure and can be used for validation of protein tertiary structure. Attribution of the secondary structure components in the proteins is summarized in Table 3 and supplementary file. Although helices and coils are dominant over the sheets, they could be identified in all sequences length, in both the results.
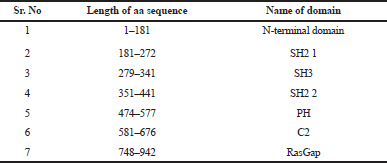 | Table 1. Protein domain in RasGap. [Click here to view] |
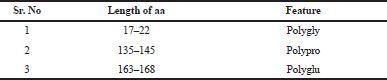 | Table 2. Special features. [Click here to view] |
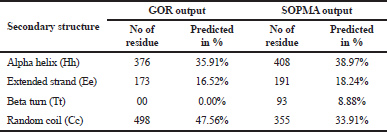 | Table 3. Secondary structure. [Click here to view] |
 | Table 4. Selected templates. [Click here to view] |
3D structure modeling
When discussing the model building step within comparative protein structure modeling, it is useful to distinguish between dependent templates and independent templates modeling. Model building without the aid of any template corresponds to the GAPs or no-structural template to the target sequence. Comparing the BLAST results, three regions were mapped with structural templates, i.e., SH3, SH2_2, and RasGap domains, which are listed in Table 4 and shown in Figure 2.
Implementing the knowledge from Jena library’s regular expression pattern search algorithm, we identified 59 structural homologs/templates similar to the N-terminal region of RASA1 for sequence length 1–280. A list of templates can be found in the supplementary data 1; these short fragments of 3D crystallized data were varied from three to five amino acids in length and served as structural templates for the comparative multiple template homology modeling. The outcome was not appropriate, and structures are deeply strangulated to each other (Figure 3).
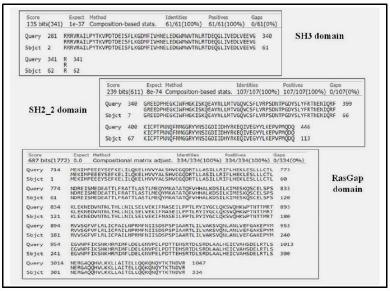 | Figure 2. Domain alignments. [Click here to view] |
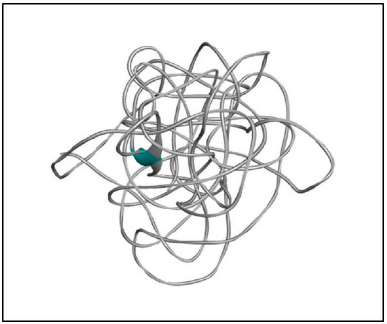 | Figure 3. 3D model of the N-terminal region of RASA1 for sequence length 1–280. [Click here to view] |
Using the SWISS-MODEL server, we have modeled the 02 structure for sequence length 178–445 aa with 24.90% identities (template 5M6U) and 714–1,047 with 100% identity (template 1WER). Intensive modeling method using Phyre2 exhibited confidence of 858 residues (82%) modeled at >90% accuracy to 1,047 total length of sequence (Figure 4). A full-length protein structure was predicted by I-Tasser with a c-Score of 0.2 (Figure 5). Two fragments were modeled using the Scratch server from length 1 to 280, possessing the N-terminal and Sh2_1 domain and 446–713 amino acid length possessing PH2 and C domain. RAS_SH3_SH2 181–446 (template 3D structure) was modeled using Phyre2 and RASGtpaseActi 546–1,047 (template 3D structure) was modeled using I-Tasser.
 | Figure 4. RASA model from Phyre2. [Click here to view] |
 | Figure 5. RASA model from I-Tasser. [Click here to view] |
Model assembly
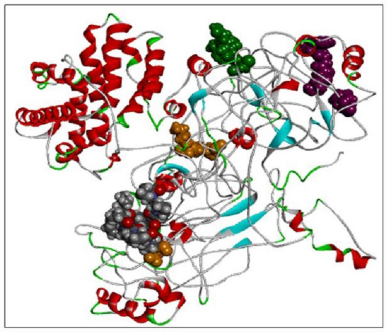
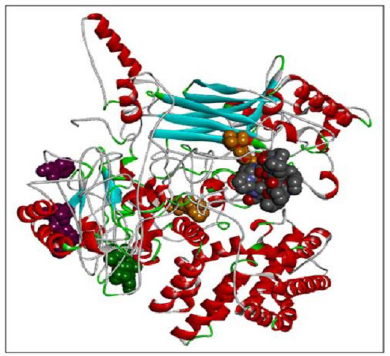
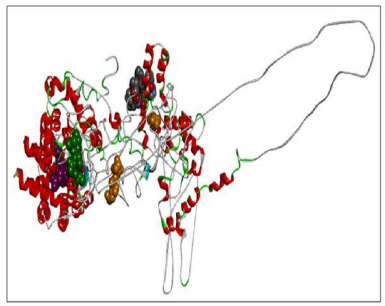
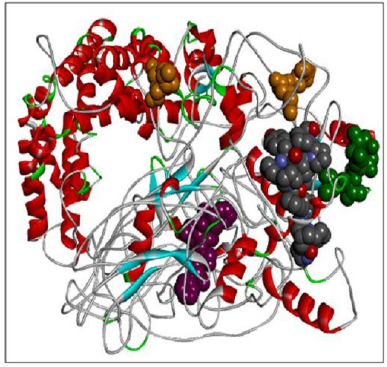
Here we have considered four templates: (1) 3D structure (length 1–280 aa.); (2) RAS_SH3_SH2 domain (length 181–446); (3) 3D structure (length 447–713 aa), and (4) RASGtpaseActi (length 546–1,047 aa). By implementing the assembly modeling concept, here we have model four distinct 3D structures for RasGTPase-activating protein 1 from four distinct fragments; the structures are evaluated with a dope score given in Table 5 and are shown in Figures 6–9. The outcome of Modeler multiple template modeling approach resulted in five optimum 3D structures for all the individual input. According to lowest dope score, the four optimum 3D structures of modeled RasGap proteins are as follows: RASA.model-01-04 (Figure 6), RASA.model-02-02 (Figure 7), RASA.model-03-04 (Figure 8), and RASA-model-04-01 (Figure 9), which were selected and subjected for further analysis and study (Table 5).
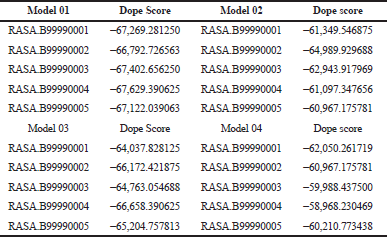 | Table 5. 3D model with their dope scores. [Click here to view] |
 | Figure 6. RASA.model-01-04. [Click here to view] |
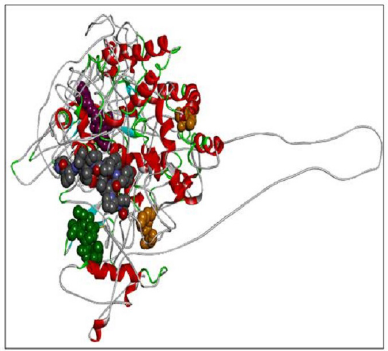
When compared all the six modeled 3d structure of Rasa protein, i.e., 01 model from Phyre2 (Fig. 4) and I-Tasser (Fig. 5) and 04 models from Modeller (Figs. 6–9), model 02 from Modeller (Figure 7—RASA.model-02-02) and model 04 from Modeller (Fig. 9—RASA-model-04-01) exhibited an extended loop. The extended loop region were occurred in model 2 from amino acid GLU 429 to ASP 521 and in model 4 an extended loop region has occurred from amino acid LEU 691 to SER 795. Whereas, the 3D structure models 01 model from Phyre2 (Fig. 4) and I-Tasser (Fig. 5) and 02 models (model 1 and 3) from Modeller (Fig. 6—RASA.model-01-04; Fig. 8—RASA.model-03-04) exhibited a compact 3D structure.
 | Figure 7. RASA.model-02-02. [Click here to view] |
 | Figure 8. RASA.model-03-04. [Click here to view] |
Model evaluation
The 3D model was estimated qualitatively by two various independent servers. To recognize the error in the generated structure, the PDB format coordinate file is uploaded in the ProSA web. The z-score indicates the overall model quality by comparing the structure to all the experimentally determined protein chains in the current Protein data bank. In the second method, we used geometrical validation by comparing the phi, psi, and omega angles using the Ramchandran plot analysis in RAMPAGE (Table 6).
Comparing the outcomes of all the six subjected 3D structures of RasGap to 30 nanoseconds simulation, the root mean square deviation (RMSD) of all the six models exhibited a linear form (Fig. 10) in the generated molecular dynamics trajectories and the log output indicated a linear form of representation in the deviation of bonds, angle, dihedral, and improper evidence of the stability of dynamic behavior of our generated protein 3D structural models (Fig. 11A–F). The total energy for all the models are as follows: from Phyre2 model: −361,664.5830 kcal/mol, I-Tasser model: −526,179.3060 kcal/mol, RASA.model-01-04: −205,558.8301 kcal/mol, RASA.model-02-02: −416,929.6108 kcal/mol, RASA.model-03-04: −166,721.6885 kcal/mol, and RASA-model-04-01: −286,464.8161 kcal/mol.
 | Figure 9. RASA-model-04-01. [Click here to view] |
Impact of the proline-rich region on SH2_1, SH3, and SH2_2 domains of RasGap
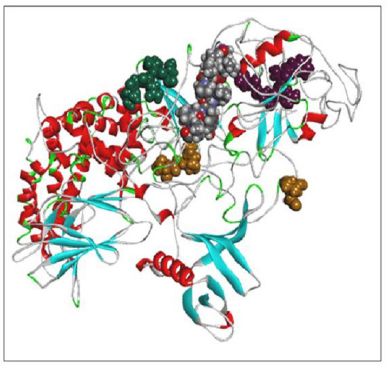
The highlighted peaks in Figures 12 and 13 show the hydrophobic regions in the SH2_1, SH3, SH2_2, and polyproline region at the N-terminal domain of RasGap protein. The hydrophobic scores are listed in Table 8. As the polyproline region acts as a gateway for the NCK1 protein to interact with the SH2_1, SH3, and SH2_2 domain of RasGap receptor protein, we have calculated the distance between the polyproline region (grey and red color) and SH2_1 (purple color), SH3 (yellow color), and SH2_2 (green color) domain of RasGap receptor protein depicted in CPK view form. The average difference between all four regions before and after the simulation results depicts an opening of the cavity. As the distance is increased between the polyproline region and SH2_1, SH3, and SH2_2 domains of RasGap receptor protein, the distance value is listed in the supplementary data and is shown in Figs. 4–9.
Protein structure prediction is a growing field in which best methods vary only by a minor percent value in performance as per the recent critical assessment of protein structure prediction standards. Template-based protein structure prediction can be upgraded by advances in techniques specific to remote homology detection, alignment, and model quality assessment (Meier and Söding, 2015). In this study, we have shown how to generate a protein 3D structure model from multiple approaches, including fragment-based and multi-template modeling, when very little or no structural homology is reported. The other factors we have described here is the role of the proline-rich region with respect to SH2_1, SH3, and SH2_2 domains within the RasGap receptor protein responsible to interact with NCK1 protein (Ger et al., 2011).
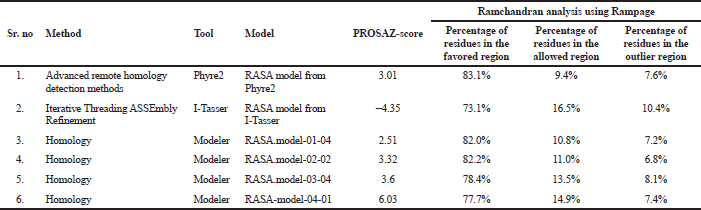 | Table 6. Results from PROSA and RAMPAGE. [Click here to view] |
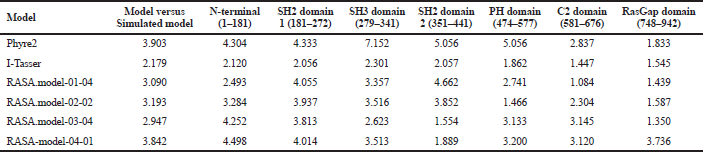 | Table 7. RMSD difference before and after simulation. [Click here to view] |
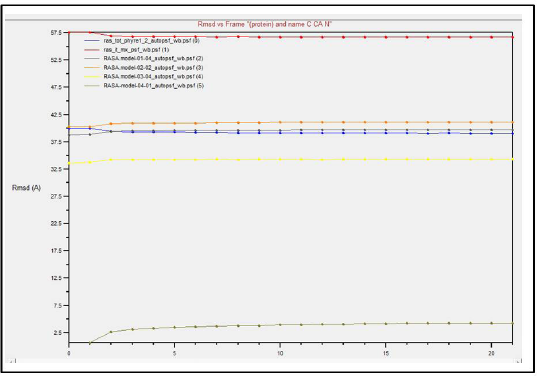 | Figure 10. Dynamic simulations result. [Click here to view] |
The 3D model of 1–280 residues has widely failed due to the highly coined region predicted by fragment-based modeling and therefore the modeling followed the multiple template-based modeling. The fragments predicted by the SCRATCH server, Phyre2, I-Tasser, and SWISS-MODEL server served as a good template input to the multiple template modeling. During the molecular dynamic simulation, we noted that the polyproline region from 135 to 145 marks an outbound deviation from the SH2_1, SH3, and SH2_2 domains within the RasGap receptor protein. This opening leads to opening a cavity of the RasGap protein which holds a strong connection in interaction with NCK1 protein.
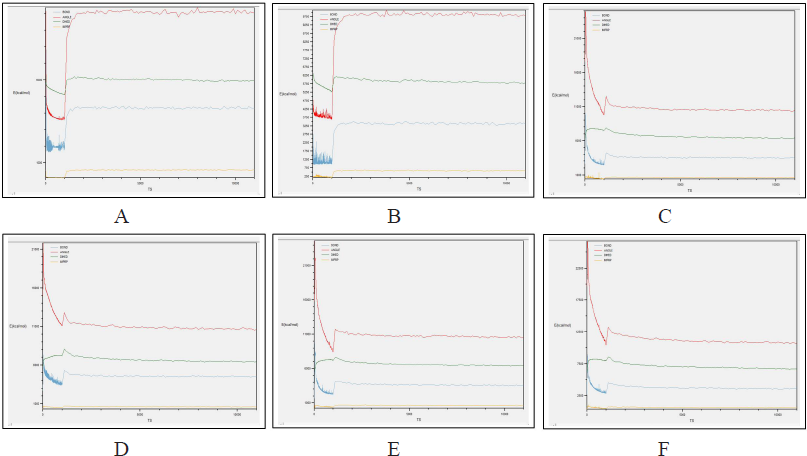 | Figure 11. (A) Phyre2 model; (B) I-Tasser model; (C) RASA.model-01-04; (D) RASA.model-02-02; (E) RASA.model-03-04; and (F) RASA-model-04-01. [Click here to view] |
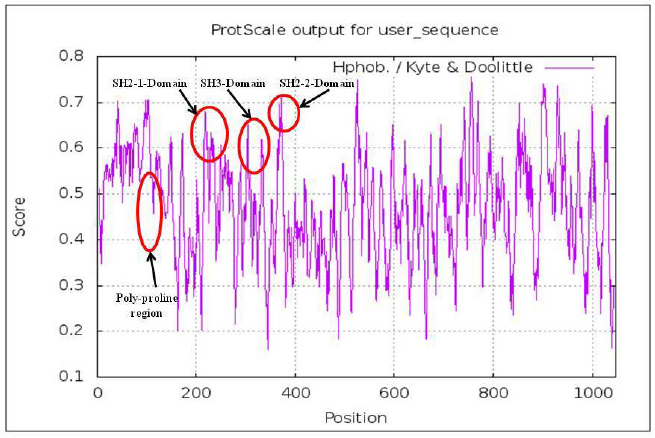 | Figure 12. Hydrophobic domains. [Click here to view] |
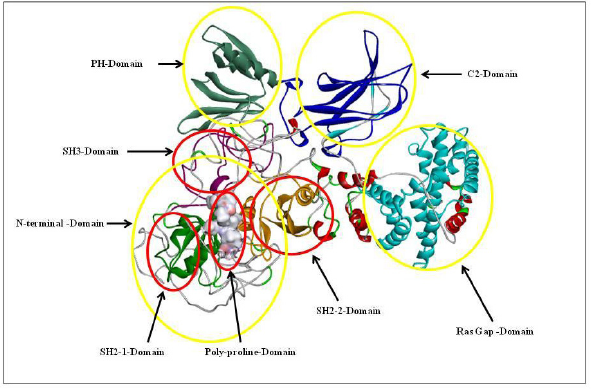 | Figure 13. 3D model of RasGap with its domains. [Click here to view] |
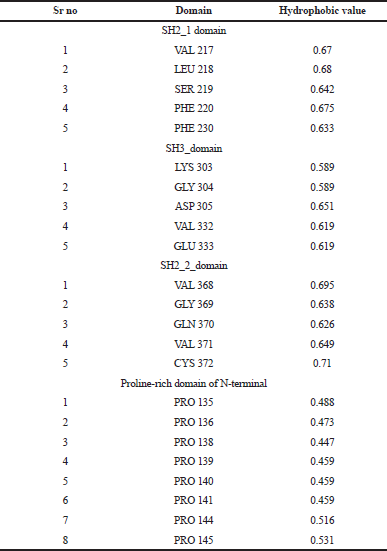 | Table 8. Hydrophophobic values for domains. [Click here to view] |
CONCLUSION
The current work presents a 3D structural model of RasGap constructed by multiple homologs and ab initio methods. The model was refined by molecular dynamics simulations in a water solvent environment. The suitability of the model is indicated by numerous model quality evaluations through PROSA and the Ramachandran plot. The exploration of active site was restricted to the SH2_1, SH3, and SH2_2 domains where NCK1 enzyme interacts. The constructed model provides an alternative to explore the structural characteristics of RasGap at the molecular level. To study its mechanism and interaction, the projected model provides a platform for exploring the residues that play important roles in the catalytic activity with their substrates.
AUTHORS’ CONTRIBUTION
Bastikar, VA, Bastikar, VA, and Gupta, PP made an active contribution to the conception and design. Bastikar, VA, Bastikar, A, Gupta, PP, Kumar, P, and Chhajed, SS, carried out the analysis and interpretation of the data and the drafting of the paper. All authors have critically reviewed its content and have approved the final version submitted for publication.
ACKNOWLEDGMENTS
The authors are thankful to:
(1) Amity Institute of Biotechnology, Amity University Maharashtra, Mumbai-Pune Expressway, Panvel, Maharashtra, India.
(2) School of Biotechnology and Bioinformatics, D Y Patil Deemed to be University, Navi Mumbai, Maharashtra, India.
AUTHOR CONTRIBUTIONS
All authors made substantial contributions to conception and design, acquisition of data, or analysis and interpretation of data; took part in drafting the article or revising it critically for important intellectual content; agreed to submit to the current journal; gave final approval of the version to be published; and agree to be accountable for all aspects of the work. All the authors are eligible to be an author as per the international committee of medical journal editors (ICMJE) requirements/guidelines.
FUNDING
There is no funding to report.
CONFLICTS OF INTEREST
The authors report no financial or any other conflicts of interest in this work.
ETHICAL APPROVALS
This study does not involve experiments on animals or human subjects.
PUBLISHER’S NOTE
This journal remains neutral with regard to jurisdictional claims in published institutional affiliation.
REFERENCES
Altschul SF, Gish W, Miller W, Myers EW, Lipman DJ. Basic local alignment search tool. J Mol Biol, 1990; 215(3):403–10. CrossRef
Altschul SF, Madden TL, Schäffer AA, Zhang J, Zhang Z, Miller W, Lipman DJ. Gapped BLAST and PSI-BLAST: a new generation of protein database search programs. Nucleic Acids Res, 1997; 25(17):3389–402. CrossRef
Baldi P, Cheng JVA. Large-scale prediction of disulphide bond connectivity. Adv Neural Inf Process Syst, 2004; 17:97–104.
Barbacid M. ras genes. Annu Rev Biochem, 1987; 56:779–827. CrossRef
Berman HM. The protein data bank. Nucleic Acids Res, 2000; 28(1):235–42. CrossRef
Blasutig IM, New LA, Thanabalasuriar A, Dayarathna TK, Goudreault M, Quaggin SE, Li SSC, Gruenheid S, Jones N, Pawson T. Phosphorylated YDXV motifs and Nck SH2/SH3 adaptors act cooperatively to induce actin reorganization. Mol Cell Biol, 2008; 28(6):2035–46. CrossRef
Buday L, Wunderlich L, Tamás P. The Nck family of adapter proteins: regulators of actin cytoskeleton. Cell Signal, 2002; 14(9):723–31. CrossRef
Canutescu AA, Dunbrack RL. Cyclic coordinate descent: a robotics algorithm for protein loop closure. Protein Sci, 2003; 12(5):963–72. CrossRef
Cheng J, Randall AZ, Sweredoski MJ, Baldi P. SCRATCH: a protein structure and structural feature prediction server. Nucleic Acids Res, 2005; 33(Web Server issue):W72–6. CrossRef
Cox AD, Der CJ. Ras history: the saga continues. Small GTPases, 2010; 1(1):2–27. CrossRef
Díez D, Sánchez-Jiménez F, Ranea JAG. Evolutionary expansion of the Ras switch regulatory module in eukaryotes. Nucleic Acids Res, 2011; 39(13):5526–37. CrossRef
Dorn M, E Silva MB, Buriol LS, Lamb LC. Three-dimensional protein structure prediction: Methods and computational strategies. Comput Biol Chem, 2014; 53PB:251–76. CrossRef
Downward J, Graves JD, Warne PH, Rayter S, Cantrell DA. Stimulation of p21ras upon T-cell activation. Nature, 1990; 346(6286):719–23. CrossRef
Drugan JK, Rogers-Graham K, Gilmer T, Campbell S, Clark GJ. The Ras/p120 GTPase-activating protein (GAP) interaction is regulated by the p120 GAP pleckstrin homology domain. J Biol Chem, 2000; 275(45):35021–7. CrossRef
Dutta S, Serrano P, Geralt M, Wuthrich K. NMR structure of the SH3 domain of human RAS p21 protein activator (GTPase activating protein) 1. Available via https://www.rcsb.org/structure/2M51
Ekman S, Thuresson ER, Heldin CH, Rönnstrand L. Increased mitogenicity of an alphabeta heterodimeric PDGF receptor complex correlates with lack of RasGAP binding. Oncogene, 1999; 18(15):2481–8. CrossRef
Frishman D, Argos P. The future of protein secondary structure prediction accuracy. Fold Des 1997;2(3):159-62. CrossRef
Garnier J, Gibrat JF, Robson B. GOR method for predicting protein secondary structure from amino acid sequence. Methods Enzymol, 1996; 266:540–53. CrossRef
Gasteiger E, Hoogland C, Gattiker A, Duvaud S, Wilkins MR, Appel RD, Bairoch A. Protein identification and analysis tools on the ExPASy server. In: Walker JM (ed.). The proteomics protocols handbook. Humana Press, Totowa, NJ, pp 571–604, 2005. CrossRef
Ger M, Zitkus Z, Valius M. Adaptor protein Nck1 interacts with p120 Ras GTPase-activating protein and regulates its activity. Cell Signal, 2011; 23(10):1651–8. CrossRef
Giehl K. Oncogenic Ras in tumour progression and metastasis. Biol Chem, 2005; 386(3):193–205. CrossRef
Gigoux V, L’Hoste S, Raynaud F, Camonis J, Garbay C. Identification of aurora kinases as RasGAP Src homology 3 domain-binding proteins. J Biol Chem, 2002; 277(26):23742–6. CrossRef
Henkemeyer M, Rossi DJ, Holmyard DP, Puri MC, Mbamalu G, Harpal K, Shih TS, Jacks T, Pawson T. Vascular system defects and neuronal apoptosis in mice lacking ras GTPase-activating protein. Nature, 1995; 377(6551):695–701. CrossRef
Humphrey W, Dalke A, Schulten K. VMD: visual molecular dynamics. J Mol Graph, 1996; 14(1):33–8, 27–8. CrossRef
Kazlauskas A, Ellis C, Pawson T, Cooper JA. Binding of GAP to activated PDGF receptors. Science, 1990; 247(4950):1578–81. CrossRef
Kelley LA, Mezulis S, Yates CM, Wass MN, Sternberg MJE. The Phyre2 web portal for protein modeling, prediction and analysis. Nat Protoc, 2015; 10(6):845–58. CrossRef
Kim DE, Chivian D, Baker D. Protein structure prediction and analysis using the Robetta server. Nucleic Acids Res, 2004; 32(Web Server issue):W526–31. CrossRef
Klinghoffer RA, Duckworth B, Valius M, Cantley L, Kazlauskas A. Platelet-derived growth factor-dependent activation of phosphatidylinositol 3-kinase is regulated by receptor binding of SH2-domain-containing proteins which influence Ras activity. Mol Cell Biol, 1996; 16(10):5905–14. CrossRef
Kuhlman B, Bradley P. Advances in protein structure prediction and design. Nat Rev Mol Cell Biol, 2019; 20(11):681–97. CrossRef
Kulkarni SV, Gish G, van der Geer P, Henkemeyer M, Pawson T. Role of p120 Ras-GAP in directed cell movement. J Cell Biol, 2000; 149(2):457–70. CrossRef
Kunath T, Gish G, Lickert H, Jones N, Pawson T, Rossant J. Transgenic RNA interference in ES cell-derived embryos recapitulates a genetic null phenotype. Nat Biotechnol, 2003; 21(5):559–61. CrossRef
Kurosaki C, Suetake T, Yoshida M, Hayashi F, Yokoyma S. Solution structure of the second SH2 domain of human Ras GTPase-activating protein 1. Available via https://www.rcsb.org/structure/2GSB
Lovell SC, Davis IW, Arendall WB, de Bakker PIW, Word JM, Prisant MG, Richardson JS, Richardson DC. Structure validation by calpha geometry: phi,psi and Cbeta deviation. Proteins, 2003; 50(3):437–50. CrossRef
Maertens O, Cichowski K. An expanding role for RAS GTPase activating proteins (RAS GAPs) in cancer. Adv Biol Regul, 2014; 55:1–14. CrossRef
Meier A, Söding J. Automatic prediction of protein 3D structures by probabilistic multi-template homology modeling. PLoS Comput Biol, 2015; 11(10):e1004343. CrossRef
Oliver JA, Lapinski PE, Lubeck BA, Turner JS, Parada LF, Zhu Y, King PD. The Ras GTPase-activating protein neurofibromin 1 promotes the positive selection of thymocytes. Mol Immunol, 2013; 55(3–4):292–302. CrossRef
Pamonsinlapatham P, Hadj-Slimane R, Lepelletier Y, Allain B, Toccafondi M, Garbay C, Raynaud F. p120-Ras GTPase activating protein (RasGAP): a multi-interacting protein in downstream signaling. Biochimie, 2009; 91(3):320–8. CrossRef
Pamonsinlapatham P, Hadj-Slimane R, Raynaud F, Bickle M, Corneloup C, Barthelaix A, Lepelletier Y, Mercier P, Schapira M, Samson J, Mathieu AL, Hugo N, Moncorgé O, Mikaelian I, Dufour S, Garbay C, Colas P. A RasGAP SH3 peptide aptamer inhibits RasGAP-Aurora interaction and induces caspase-independent tumor cell death. PLoS One, 2008; 3(8):e2902. CrossRef
Panasyuk G, Nemazanyy I, Filonenko V, Negrutskii B, El’skaya AV. A2 isoform of mammalian translation factor eEF1A displays increased tyrosine phosphorylation and ability to interact with different signalling molecules. Int J Biochem Cell Biol, 2008; 40(1):63–71. CrossRef
Phillips JC, Braun R, Wang W, Gumbart J, Tajkhorshid E, Villa E, Chipot C, Skeel RD, Kalé L, Schulten K. Scalable molecular dynamics with NAMD. J Comput Chem, 2005; 26(16):1781–802. CrossRef
Pollastri G, Baldi P. Prediction of contact maps by GIOHMMs and recurrent neural networks using lateral propagation from all four cardinal corners. Bioinformatics, 2002a; 18(Suppl 1):S62–70. CrossRef
Pollastri G, Przybylski D, Rost B, Baldi P. Improving the prediction of protein secondary structure in three and eight classes using recurrent neural networks and profiles. Proteins, 2002b; 47(2):228–35. CrossRef
Qiao Y, Zhu L, Sofi H, Lapinski PE, Horai R, Mueller K, Stritesky GL, He X, The HS, Wiest DL, Kappes DJ, King PD, Hogquist KA, Schwartzberg PL, Sant'Angelo DB, Chang CH. Development of promyelocytic leukemia zinc finger-expressing innate CD4 T cells requires stronger T-cell receptor signals than conventional CD4 T cells. Proc Natl Acad Sci U S A, 2012; 109(40):16264–9. CrossRef
Reichert J, Sühnel J. The IMB jena image library of biological macromolecules: 2002 update. Nucleic Acids Res, 2002; 30(1):253–4. CrossRef
Ross B, Kristensen O, Favre D, Walicki J, Kastrup JS, Widmann C, Gajhede M. High resolution crystal structures of the p120 RasGAP SH3 domain. Biochem Biophys Res Commun, 2007; 353(2):463–8. CrossRef
Roy A, Kucukural A, Zhang Y. I-TASSER: a unified platform for automated protein structure and function prediction. Nat Protoc, 2010; 5(4):725–38. CrossRef
Scheffzek K, Ahmadian MR, Kabsch W, Wiesmüller L, Lautwein A, Schmitz F, Wittinghofer A. The Ras-RasGAP complex: structural basis for GTPase activation and its loss in oncogenic Ras mutants. Science, 1997; 277(5324):333–8. CrossRef
Scheffzek K, Lautwein A, Kabsch W, Ahmadian MR, Wittinghofer A. Crystal structure of the GTPase-activating domain of human p120GAP and implications for the interaction with Ras. Nature, 1996; 384(6609):591–6. CrossRef
Schrödinger L. The PyMOL molecular graphics system [En ligne]. 2017. Available via https://www.pymol.org/citing
Shah B, Gupta PP. Fragment based homology modeling and simulation based study of endoglin (CD-105) from Homo sapiens. Int J Biosci, 2014; 5(12):374–89. CrossRef
Sippl MJ. Recognition of errors in three-dimensional structures of proteins. Proteins, 1993; 17(4):355–62. CrossRef
Sippl MWMJ. ProSA-web: interactive web service for the recognition of errors in three-dimensional structures of proteins. Nucleic Acids Res, 2007; 35(2):W407–10. CrossRef
Webb B, Sali A. Comparative protein structure modeling using MODELLER. Curr Protoc Bioinformatics, 2014; 47:5.6.1–32. CrossRef
Xie W, Sahinidis NV. Residue-rotamer-reduction algorithm for the protein side-chain conformation problem. Bioinformatics, 2006; 22(2):188–94. CrossRef
Yang JY, Widmann C. Antiapoptotic signaling generated by caspase-induced cleavage of RasGAP. Mol Cell Biol, 2001; 21(16):5346–58. CrossRef