
INTRODUCTION
The superficial fungal infections are major challenges in the field of dermatology, pediatric care, and primary care (Cohn, 1992; Drake et al., 1996). According to the survey of National Centre for Health Statistics, fungal infections were considered the most prevalent topical disease in patients of age between 1 and 74 years (Pfaller and Sutton, 2006). However, only the conventional formulations, such as creams, pessaries, foams, and gels, are available for topical delivery of antifungal agents that remain adhered to the target site for a relatively short period of time (Samein, 2014). The skin possesses a barrier for permeation of drugs because of stratum corneum lipids and epidermal cell cohesion. Thus, an efficient drug delivery is required to cross this barrier (Gupta et al., 2013).
Novel drug delivery systems (NDDS) emerged as having potential control over the release and permeation of drugs into the skin (Kreilgaard, 2002). Solid lipid nanoparticles (SLN) are established as one of the particulate carrier systems that have many merits over other NDDS (Zhang et al., 2006). Liposomes have problems of physical stability, leakage of drug, and difficulties in upscaling (Wissing et al., 2004). Polymeric nanoparticles, i.e., nanospheres and nanocapsules, require diffusion of drugs through the rigid matrix as they maintain their structure for a prolonged time when applied topically (Gupta et al., 2013). SLN are surfactant-stabilized colloidal systems made of lipids that remain solids at both body and room temperatures (Wissing et al., 2004). They range in size from 50 to 1,000 nm. The small size of SLN permits close contact with the horny layer of stratum corneum and, therefore, allows greater partitioning of the drug into the skin (Müller et al., 2002). However, nanostructured lipid carriers are more suitable for systemic delivery owing to their enhanced drug permeation through the skin, rather than localization of drugs into the skin (Zhang et al., 2006).
SLN have minimal skin irritation, release the drug at a controlled rate, and protect the incorporated drug as they are made up of physiologically tolerable, non-irritant, and non-toxic lipids and surfactants (Gupta and Kar, 2015; Pradhan et al., 2015) which have a generally-recognized-as-safe status (Jain et al., 2010). Several techniques for SLN preparation have been developed such as high pressure homogenization, microemulsion method, solvent emulsification–evaporation or –diffusion, w/o/w double emulsion method, and high speed stirring and/or ultrasonication (Wissing et al., 2004).
Miconazole nitrate (MCN) is an imidazole broad spectrum antifungal agent used in the treatment of superficial mycoses, dermatophytoses, mixed infections, and cutaneous mycoses (Jain et al., 2010; Sanap and Mohanta, 2013). MCN is poorly soluble in water (1.03 μg/ml) (Jain et al., 2010) and its octanol–water partition coefficient value is 6.25 (Bhalekar et al., 2009). The treatment of cutaneous disease by topical delivery of MCN possesses a problem due to poor skin permeation capability of MCN as the drug must be delivered to the infection site in high concentration to completely eradicate the fungi (Gossel, 1985; Sanap and Mohanta, 2013). Development of SLN of MCN could be promising in increasing its concentration in the skin. The aim of our research work was to develop MCN-loaded SLN by hot high shear homogenization method (HSHM) and to optimize the formulations based on its in vitro characterizations by Box–Behnken design (BBD) and its stability study.
MATERIALS AND METHODS
Materials
MCN was obtained as a gift sample from Pranami Drugs Private Limited, Ankleshwar, Bharuch, Gujarat, India. Tristearin was purchased from Arrow Chemicals, Mumbai, India. Tween 80 and dialysis membrane (molecular weight cut off 12,000) was purchased from Himedia, Mumbai, India. Glyceryl monostearate, cetostearyl alcohol, hard paraffin wax, beeswax, stearic acid, and methanol were purchased from Central Drug House, New Delhi, India. All solvents used were of analytical grades. The double distilled water was used throughout the experiments.
Screening of solid lipids
Solubility study was carried out according to the method reported by Shah et al. (2007). Glyceryl monostearate, cetostearyl alcohol, hard paraffin wax, beeswax, stearic acid, and tristearin were screened for solid lipid excipient to solubilize MCN. The solubility of MCN in molten lipids was assessed visually by observing the presence or absence of drug crystals. Ten mg of MCN was taken in a tared wide mouth screw-capped vial. Ten grams of various lipids were melted separately and added in small portions to the weighed amount of MCN with continuous stirring and observed for the absence of drug in the molten lipid. Then the tared vial was again weighed to calculate the solubility of drugs in the molten lipid.
Formulation of MCN-loaded SLN
Twenty-seven batches of SLN formulations were prepared by using hot HSHM as reported by Gaspar et al. (2017) with slight modifications. Tristearin was melted at 80°C and weighed amount of MCN in various concentrations was dissolved in it. Simultaneously, aqueous Tween 80 solutions in distilled water was heated to the same temperature and added to the molten lipid phase; and the mixture was homogenized while heating at the same temperature at various rpm using a high speed homogenizer (Heidolph Silent Crusher M, Germany) for various intervals of time. The SLN dispersions were cooled in ice baths with gentle stirring for 5 minutes. The prepared SLN dispersions were kept in sterile screw-capped glass vials and kept at 5°C ± 3°C for later use.
Characterization of MCN-loaded SLN
Determination of particle size (PS), polydispersity index (PDI), and zeta potential (ZP)
PS and PDI of the samples were determined by photon correlation spectroscopy by changes in the intensity of light scattered using Malvern Zetasizer Ver.7.11 (Malvern Instruments Ltd., Malvern, UK). Samples were kept in disposable sizing cuvettes and measurements were made at 25°C after 1:100 dilutions in filtered distilled water as dispersant. Refractive index (1.33), viscosity (0.8872 cP), and dielectric constant were kept constant for all measurements. Apparent ZP and surface charge were determined using the Zeta SizerVer.7.11 (Malvern Instruments Ltd., Malvern, UK). Samples were placed in a clear disposable zeta cells after suitable dilution in filtered distilled water at 25°C.
Determination of percent encapsulation efficiency (EE) and drug loading (DL)
EE and DL were determined by the centrifugation method (Kumar et al., 2013; Sanap and Mohanta, 2013; Vardhan et al., 2017) with slight modifications. Two milliliters of MCN-loaded SLN dispersion samples were taken and centrifuged by refrigerated centrifuge (Kubota 3500, Fukuoka, Japan) at 15,000 rpm (20,630 × g) for 20 minutes at 4°C to get an off-white mass of lipid in the supernatant layer. The supernatant liquid containing lipid mass was decanted and the underlying liquid sample was taken with the help of micropipette, diluted with methanol, and free drug content was determined spectrophotometrically using UV-visible spectrophotometer (Shimadzu-1700, Kyoto, Japan) at 270 nm. The EE and DL capacities of SLN were calculated by the following equations:
EE = {(W0−WS)/W0} ×100 (1)
DL = {(W0−WS)/(W0 + WL−WS)} × 100 (2)
where W0 is the theoretical weight of drug added, WS is the analytical weight of drug in the liquid after centrifugation and decantation, and WL is the weight of lipid added in the system.
Optimization and statistical analysis
BBD was employed to optimize the formulations of MCN-loaded SLN which consisted of three levels, four factors (Table 1), and three center points. The design matrix of BBD (Table 2) consisted of 27 runs by employing Minitab statistical software which has five dependent variables (responses), i.e., PS, PDI, ZP, EE, and DL.
Using four factors, i.e., A = drug: tristearin (% w/w), B = Tween 80 (%w/v), C = homogenization speed (rpm), and D = homogenization time (minute); 27 batches of MCN-loaded SLN were formulated by hot HSHM utilizing BBD. The results of the experimental design were evaluated employing Minitab statistical software (Minitab® LLC). An analysis of variance was carried out at 95% confidence interval (p ≤ 0.05) to identify the significance of each variable and interaction between variables. A suitable mathematical model (regression equation) was generated for each response to quantify the effect of independent variables on it. Statistical parameters like regression coefficient (R2), and p-value helped in selecting a suitable model. Contour plots and 3D response surface plots were generated to establish the interaction and correlation between factors and dependent variables.
 | Table 1. Independent variables with their levels and codes in BBD. [Click here to view] |
 | Table 2. BBD of the study and their observed responses. [Click here to view] |
Differential scanning calorimetry (DSC) study
DSC scans of MCN drug, tristearin, physical mixture of tristearin and drug, and optimized MCN-loaded tristearin SLN were carried out on a calorimeter (DSC 131 EVO, Setaram Instrumentation KEP Technologies, Caluire-et-Cuire, France) capable of working in temperature range of −170°C–700°C using Calisto software. The materials were accurately weighed onto aluminum pans and heat flow was measured against an empty reference pan. DSC scans were recorded at a heating rate of 10°C/minute in temperature range of 30°C–300°C (Gaspar et al., 2016).
Fourier transform infrared (FTIR) spectroscopy
FTIR study was conducted to reveal any physicochemical interactions between different components of the formulation. FTIR study of MCN drug, tristearin, physical mixture of tristearin and drug, and optimized MCN-loaded tristearin SLN was conducted using FTIR instrument (Perkin Elmer Spectrum Version 10.03.02, Waltham, MA) using KBr pellet and FTIR spectra was scanned over the range of 4,000 cm−1 −650 cm−1 wave number at room temperature (Bhalekar et al., 2009; Sharma et al., 2020).
Field emission scanning electron microscopy (FESEM)
The shape and surface morphology of optimized formulation of tristearin SLN were visualized by FESEM. A drop of diluted sample (1:4 in distilled water) was placed on 1 cm2 microscopic slide to form a thin film and air-dried. The sample was sputter coated with gold to protect from high energy electron beam and examined by FESEM (Nova Nano FE-SEM, FEI Company, Japan) in an accelerating voltage of 15 kV that gives a resolution of 1 nm (Sharma et al., 2020).
In vitro MCN release study
The dialysis bag method was used to carry out the in vitro release study of MCN from SLN dispersion. Two milliliter of MCN-loaded SLN dispersion was placed in a pretreated dialysis tubing (molecular weight cut off 12,000) with pore size of 2.4 nm (Himedia, Mumbai, India). The tube was tied at both ends to form a dialysis bag. The dialysis bag was immersed in 50 ml mixture of phosphate buffer saline (PBS), pH 6.4, and methanol in the ratio of 7:3 in a 100 ml beaker. The PBS pH 6.4 was used as release medium since the SLN formulation was for topical application and 30% v/v methanol was added to provide the sink condition throughout the study. The beaker was placed over a magnetic stirrer and temperature of the release medium was maintained at 37°C and stirred magnetically at 100 rpm (Jain et al., 2010; Vardhan et al., 2017). Aliquots of 2 ml were withdrawn at definite time interval from the release medium and replaced with same amount of fresh mixture of PBS, pH 6.4, and methanol (7:3). The samples were analyzed for MCN at λmax of 272 nm in UV visible spectrophotometer.
Drug release kinetics study
The drug release kinetics of optimized SLN formulation was characterized using four models including zero order, first order, Higuchi’s equation, and Korsmeyer–Peppas model. According to the regression coefficient value (R2), the best fit model was selected (Gaspar et al., 2016). The trial version of GraphPadPrism software (Version 9) was used for construction of graph. The excel software was used to calculate the R2 and other model parameters.
Stability study
The stability study was carried out on optimized formulation of MCN-loaded SLN dispersion for a period of 6 months according to the International Council for Harmonisation of Technical Requirements for Pharmaceuticals for Human Use guideline (Q1AR2) at 5°C ± 3°C for long term condition and 25°C ± 2°C/60% RH ± 5% RH for accelerated condition (ICHQ1A(R2), 2003). 20 ml of SLN dispersion of MCN-loaded tristearin was kept in three sterile screw-capped glass vials for each stability condition. The samples were withdrawn at 0, 3, and 6 months and analyzed for clarity, PS, PDI, ZP, EE, and DL
RESULTS AND DISCUSSION
Screening of solid lipids
The solubility of MCN in molten lipids was assessed visually in six solid lipid candidates, i.e., glyceryl monostearate, cetostearyl alcohol, hard paraffin wax, beeswax, stearic acid, and tristearin. Maximum solubility of MCN was found in tristearin (Table 3). Based on this, tristearin was selected as a solid lipid candidate to formulate SLN of MCN.
Experimental design
BBD was employed to optimize the formulations of MCN-loaded SLN. The design matrix of BBD consisted of 27 runs (Table 2) by employing Minitab software (Minitab® LLC) which has five dependent variables. The statistically analyzed quadratic model revealed a significant p-value for all responses. The regression equation was generated for all the responses and the effects of various factors on responses are summarized.
 | Table 3. Solubility study of MCN in various solid lipids. [Click here to view] |
Effects of independent variables on PS (R1)
The average PS of MCN-loaded SLN was found to vary between 92.71 and 406.32 nm for various factor-level combinations. The influence of independent variables on PS can be quantified by the following regression equation:
R1 = 1772−0.79 A−20.9 B−0.1178 C−42.2 D + 0.204 B × B + 0.000002 C×C + 0.002844 C×D (3)
The quadratic model was best fitted for PS as suggested by lower p-value of Ë‚ 0.0001. The regression coefficient value (R2) of Equation 3 was found to be 93.28%, revealing a good fit between experimental values and predicted values. Among the four factors, the effect of Tween 80 concentrations and the homogenization speed was found to be significant as p-value in both cases was found to be Ë‚ 0.0001. PS was found to decrease significantly with the increase in Tween 80 concentrations due to lowering of interfacial tension and better stabilization of molten lipid dispersion. Bhalekar et al. (2009) also reported the decrease in PS of SLN on increasing the Tween 80 concentrations. This result was also confirmed by Jain et al. (2010). Similarly, PS decreased significantly with an increase in homogenization speed from 10,000 to 20,000 rpm, which facilitated the breakdown of molten lipid droplets. Mai et al. (2018) also demonstrated the decrease in PS of SLN prepared by hot HSHM with the increase in homogenization speed due to the high energy supplied by the homogenizer. However, the PS of SLN tends to increase significantly with the increase in homogenization speed to 20,000 rpm along with the homogenization time of 20 minutes (Fig. 1b and d) as evident by p Ë‚ 0.05 for the interaction factors C and D (Table 4). The coefficient for the quadratic term, C × C, was found statistically significant (p Ë‚ 0.05), explaining the curvature of response surface (Fig. 1d). The effect of other factors, i.e., drug: tristearin ratio and homogenization time were found to be insignificant (p ˃ 0.05) as shown Table 4. Contour plots (Fig. 1a and b) and 3D response surface plots (Fig. 1c and d) representing the effect of Tween 80 concentration and homogenization speed on PS were generated.
Effects of independent variables on PDI (R2)
PDI of MCN-loaded SLN was found to vary between 0.124 and 0.482 for various levels of factors. The influence of independent variables on PDI can be quantified by the following regression equation:
R2 = 1.657 + 0.00053 A − 0.14138 B − 0.000081 C − 0.00665 D + 0.006393 B × B 0.000000 C × C + 0.000000 C × D (4)
The p-value of quadratic model was found to be Ë‚ 0.0001. So, the mathematical model was best fitted for PDI. The regression coefficient value (R2) of Equation 4 was found to be 95.41%, revealing a good fit between experimental values and predicted values.
Among the four factors, the effect of Tween 80 concentrations and the homogenization time was found to be most significant as p-value in both cases was Ë‚ 0.0001. PDI was found to be decreased significantly with the increase in Tween 80 concentrations as indicated by higher coefficient value of −0.06758 (Table 4) as increased Tween 80 concentrations resulted in stabilization of SLN. Also, PDI was found to be decreased significantly with increase in homogenization time (p Ë‚ 0.05). This might be due to the prolonged application of shearing stress which produces homogenous dispersion of nanoparticles.
Also, PDI was significantly decreased with an increase in homogenization speed as indicated by p-value of Ë‚ 0.05. Low speed of homogenization was found to broaden the size range as low speed of 10,000 rpm may not be sufficient to homogenize the SLN dispersion well. The coefficient for the quadratic term, B × B, was found to be statistically significant (p Ë‚ 0.05), explaining the curvature of response surface (Fig. 2c). Similarly, the coefficient for the quadratic term, C × C, was also found to be statistically significant (p Ë‚ 0.05), concluding that the response surface contained curvature (Fig. 2d). Drug:tristearin ratio has no significant effect on PDI (p ˃ 0.05). Similarly, the coefficient for an interaction between the factors, C and D, was found to be statistically insignificant for PDI (p ˃ 0.05). Contour plots (Fig. 2a and b) and 3D response surface plots (Fig. 2c and d) representing the effect of Tween 80 concentrations, homogenization time, and homogenization speed on PDI were plotted.
 | Figure 1. Effect of independent variables on PS: (a and b) contour plots and (c and d) 3D response surface plots. [Click here to view] |
Effects of independent variables on ZP (R3)
The ZP of MCN-loaded SLN was found to vary between −25.61 and −6.51 mV for various factor-level combinations. The ZP for certain levels of variables in SLN formulations was above −13 mV, suggesting a homogenous distribution with prolong stability (Vardhan et al., 2017). The influence of factors on ZP can be quantified by the following regression equation:
R3 = 8.89 + 0.025 A − 1.711 B − 0.000567 C − 0.300 D + 0.0233 B × B + 0.000000 C × C − 0.000007 C × D (5)
The quadratic model was best fitted for ZP as revealed by p-value of Ë‚ 0.0001. The regression coefficient value (R2) of Equation 5 was found to be 97.17%, suggesting a good fit between experimental values and predicted values.
Out of the four factors, the effect of Tween 80 concentrations and homogenization time on ZP was found to be significant as p-value in both cases was found to be ˂ 0.0001. Negative ZP was found to be decreased significantly with the increase in Tween 80 concentrations which may be due to lowering of interfacial tension (Vardhan et al., 2017). Also, marked decrease in negative ZP was observed with increase in homogenization time. Probably, the increase in homogenization time would have decreased the PS to such an extent that Tween 80 concentrations was not sufficient to stabilize it and thus the particles would have aggregated over time to become bigger in size and more stabilized. Now, the Tween 80 concentration might be sufficient to stabilize the larger particles. The effects of other factors, i.e., drug:tristearin ratio and homogenization speed, were found to be insignificant (p ˃ 0.05). Contour plots (Fig. 3a) and 3D response surface plots (Fig. 3b and c) represents the effect of Tween 80 concentration and homogenization time on ZP.
 | Table 4. Coded coefficient and p-value for that coefficient between experimental factors or its combinations and responses. [Click here to view] |
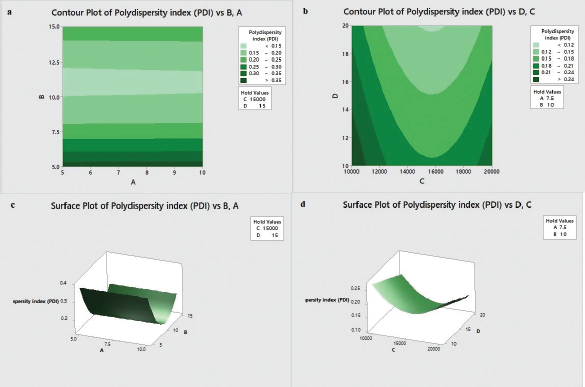 | Figure 2. Effect of independent variables on PDI: (a and b) contour plots and (c and d) 3D response surface plots. [Click here to view] |
Effects of independent variables on EE (R4)
The EE of MCN-loaded SLN was found in the range of 71.92%–98.32% for various factor-level combinations. The effects of factors on EE can be assessed by the following regression equation:
R4 = 143.9 − 4.725 A − 1.680 B − 0.00201 C + 0.108 D + 0.0849 B × B + 0.000000 C × C −0.000003 C × D (6)
The quadratic model was best fitted for EE as suggested by p-value of Ë‚ 0.0001. The regression coefficient value (R2) of Equation 6 was found to be 91.50%, revealing a good fit between experimental values and predicted values.
Out of the four factors, only the effect of drug:tristearin ratio on EE was found to be significant as coefficient p-value was found to be Ë‚ 0.0001. The negative correlation exists between drug:tristearin ratio and EE as indicated by coefficient value of −11.813 (Table 4). The EE decreased significantly with the increase in drug:tristearin ratio because of a decrease in tristearin content. The effect of other factors, i.e., Tween 80 concentration, homogenization speed, and homogenization time, were not found significant (p ˃ 0.05 in all cases). Contour plots and 3D response surface plots representing the effect of drug: tristearin ratio on EE are shown in Figure 4a and b, respectively.
 | Figure 3. Effect of independent variables on ZP: (a) contour plots and (b and c) 3D response surface plots. [Click here to view] |
 | Figure 4. Effect of independent variables on EE: (a) contour plots and (b) 3D response surface plots. [Click here to view] |
Effects of independent variables on DL (R5)
The DL of MCN-loaded SLN was found to vary from 4.76% to 7.56% for various factor-level combinations. The effects of factors on DL can be assessed by the following regression equation:
R5 = 7.21 + 0.4700 A − 0.254 B − 0.000393 C − 0.015 D + 0.0132 B × B + 0.000000 C × C + 0.000001 C × D (7)
The p-value of quadratic model was found to be Ë‚ 0.0001. Thus, the mathematical polynomial model was best fitted for DL. Also, the regression coefficient value (R2) of Equation 7 was found to be 83.85%. It shows that the model explains 83.85% of the variance in DL which indicates that the model fitted the data adequately.
Out of the four factors, only the effect of drug:tristearin ratio on DL was found to be significant as coefficient p-value was found to be ˂ 0.0001. The direct correlation exists between drug:tristearin ratio and DL. The DL was found increasing with increase in drug: tristearin ratio, which might be due to subsaturation solubility of MCN in lipid component, tristearin, and its less water solubility, which causes non leakage of drug from the lipid matrix. The effects of other factors, i.e., Tween 80 concentration, homogenization speed, and homogenization time, were found insignificant (p ˃ 0.05 in all cases). Contour plots and 3D response surface plots representing the effect of drug:tristearin ratio on DL are shown in Figure 5a and b, respectively.
Optimization of experimental model
The numerical optimization technique was applied for optimization via the optimization plot by assigning the goal (numerical constraints) and targets for all responses giving equal importance and weight to each response to achieve the targeted response (Table 5). The desirability function was investigated using Minitab’s response optimizer to predict the optimized formulation. Minitab calculated the optimal settings for the variables along with desirability values to identify how well those settings achieve the response targets. Individual desirabilities of all the responses were found between 0.75590 and 0.92562, which were closer to 1. The composite desirability of the predicted solution was found to be 0.8373 which was also close to 1. These values gave the indication of meeting the response targets. The factors setting found by BBD to give the optimized formulation with predicted responses is shown in Table 6.
 | Figure 5. Effect of independent variables on DL: (a) contour plots and (b) 3D response surface plots. [Click here to view] |
 | Table 5. Parameters for optimization of MCN-loaded SLN by BBD. [Click here to view] |
 | Table 6. Optimized solution by BBD. [Click here to view] |
Validation of experimental model
A new batch of MCN-loaded SLN involving predicted settings of factors (Table 7) was formulated and percentage bias with the experimental responses was calculated to validate the optimized solution. Bias examines the difference between the observed average measurement and predicted value. The results showed a low percentage bias for PS, PDI, ZP, EE, and DL. Thus, the results confirm the validity of the experimental model for various response predictions (Kamel et al., 2017; Vardhan et al., 2017).
DSC study
DSC study was conducted to find out the crystalline or amorphous state of the drug when it is being encapsulated in SLN formulations. The endothermic peak of MCN and tristearin confirm their crystalline form (Fig. 6a and b). The thermogram of pure MCN showed onset melting temperature at 184.47°C. The thermogram of pure lipid (tristearin) showed a melting peak (peak maximum) at 62.35°C. The mixture of MCN and tristearin approximately showed melting peaks of both MCN and tristearin (Fig. 6c), confirming compatibility of MCN and tristearin. The DSC scans of optimized MCN-loaded SLN formulation (Fig. 6d) did not showed the melting peak of MCN which reveals the amorphous or molecularly dispersed structure of MCN in the lipid matrix as reported by Bhalekar et al. (2009) in the case of MCN-loaded compritol 888 ATO SLN.
In the optimized formulation, the melting peak of tristearin was found to be depressed (61.52°C) when compared to the melting peak of bulk lipid (62.33°C). This may be due to the creation of lattice defects onto the lipid matrices of the optimized formulation, followed by a decrease in their crystallinity due to the formation of less ordered crystal in comparison to the bulk tristearin (Bhalekar et al., 2009; Gaspar et al., 2016). The melting peak of the optimized formulation requires quite less energy than their crystalline counterparts to overcome lattice forces due to the formation of amorphous lipids. Another reason for this depression of melting point may be the small PSs which cause the increase in surface area or the presence of surfactants (Bhalekar et al., 2009; Gaspar et al., 2016).
FTIR study
The FTIR spectrum reveals characteristic bands of MCN (Fig. 7a) at 750 and 810 cm−1; 1,010 and 1,090 cm−1; 1,320, 1,450, 3,040 cm−1 of C-Cl stretch, C-O stretch, aromatic C-N stretch, N-O stretch, and aromatic C-H stretch, respectively (Kalsi, 2007; Silverstein and Webster, 2006). Tristearin (Fig. 7b) shows characteristic peaks at 1,150 cm−1; 1,380 and 1,460 cm−1; and 1,715 and 2,925 cm−1 corresponding to ester C-O stretch, C-H2, and C-H3 bending, C=O stretch and C-H stretch, respectively (Kalsi, 2007; Silverstein and Webster, 2006). The overlay of FTIR spectra confirms the absence of drug polymer interactions as no new peaks are seen in either the physical mixture of MCN and tristearin (Fig. 7c) or in the optimized SLN formulation (Fig. 7d). The peak of MCN tends to absent or are embedded in the peaks of tristearin in optimized SLN indicating encapsulation of drug. It might be due to coating of the low melting lipid around the precipitated core of high melting point, MCN. A similar result was earlier reported by Bhalekar et al. (2009) regarding SLN of compritol 888 ATO containing MCN.
 | Table 7. Validation of the experimental model. [Click here to view] |
 | Figure 6. Overlay of DSC thermogram of (a) MCN, (b) tristearin, (c) physical mixture of MCN and tristearin, and (d) optimized formulation of MCN. [Click here to view] |
FESEM study
The FESEM study confirms the shape and surface characteristics of MCN-loaded optimized tristearin SLN. The optimized SLN when scanned at a magnification of 100.000× were found to be more or less spherically shaped nanoparticles with few elongated particles, but all having smooth surfaces (Fig. 8).
 | Figure 7. Overlay of FTIR spectrum of (a) MCN, (b) tristearin, (c) physical mixture of tristearin and MCN, and (d) optimized SLN of MCN. [Click here to view] |
 | Figure 8. FESEM image of optimized MCN-loaded SLN of tristearin. [Click here to view] |
 | Figure 9. Drug release profile of MCN-loaded SLN dispersion. [Click here to view] |
In vitro MCN release study
The drug release profile of MCN-loaded tristearin SLN dispersion was carried out by dialysis bag in mixture of PBS pH 6.4 and methanol (7:3) as the release medium. The drug release profile (Fig. 9) suggests that almost 84.56% drug released from the encapsulated tristearin SLN after 12 hours. The tristearin SLN depicted a biphasic release pattern having two components. An initial burst release of about 30.23% at the first 30 minutes of sampling is observed. This was followed by a slower drug release. The initial burst release was probably due to the presence of drug molecules which were adsorbed on the surface of SLN or in close proximity to its surface as well as due to small volume to surface ratio of the SLN geometry (Bhushan et al., 2013; Gaspar et al., 2016).
The subsequent drug release may be linked to the presence of drug molecules within the core matrix of SLN and its diffusion into the release medium. The better permeation of drug into stratum corneum may be favored by the burst release and the sustained release can favor the supply of drug over a prolong period of time. Both the burst and prolong release of drug from the SLN dispersion can be beneficial for topical drug delivery. This can be corroborated to the drug enriched shell model (Wissing et al., 2004; Zhang et al., 2006).
Drug release kinetics study
The drug release kinetics of MCN-loaded SLN dispersion was evaluated using four models including zero order, first order, Higuchi’s equation, and Korsmeyer–Peppas model. The highest regression coefficient (R2) value of 0.945 (Table 8) was found to be of Korsmeyer–Peppas model which was close to 1, suggesting that the release kinetics follow Korsmeyer–Peppas model. The m (release mechanism exponent) value of 0.32 was found, which is smaller than 0.43. It indicates that the mechanism of drug release was Fickian diffusion, whereby the release of MCN was dependent on the rate of diffusion of MCN through the lipid matrix. This was corroborated to the drug release kinetics evaluated by Gaspar et al. (2016) from tristearin SLN.
 | Table 8. Mathematical models and parameters obtained by fitting the release profile of MCN from SLN dispersion. [Click here to view] |
Stability study
MCN-loaded SLN dispersion was monitored for physicochemical stability for 6 months at a long-term condition (5°C ± 3°C) and accelerated condition (25°C ± 2°C/60% RH ± 5% RH), separately. The results of stability study are shown in Table 9.
After storage for 6 months at refrigerated condition, no change in clarity, and color of SLN dispersion was observed. The 2.67% increase in PS and 4.1% increase in PDI were observed. The almost unchanged results indicate no significant aggregation or coalescence of particles during the storage period. But 2.38% decrease in EE, 2.75% decrease in DL, and 4.84% decrease in ZP were observed. The low decrease in EE and DL was due to low leakage of entrapped drug (Bhushan et al., 2013). Similar result was also noted by Radomska et al. (1999). Thus, the result confirms the stability of SLN dispersion at refrigerated condition for 6 months.
After storage for 6 months at accelerated stability condition, the SLN dispersion was appeared to be white turbid with slight sedimentation, which dictates the aggregations or increase in size of the SLN particles. The PS was increased from 169.45 to 274.67 nm. This increase in PS is supported by the increase in PDI from 0.220 to 0.482 and marked decrease in ZP from −22.88 to −12.65 mV, which is further correlated to particle growth. The results show the effect of increased temperature (kinetic energy) in inducing particle growth as a result of aggregation of particles. The result was also documented by Freitas and Muller (1998).
The EE and DL were reduced from 92.54% to 53.69%, and 7.26%–3.43%, respectively, at accelerated condition. The results confirm the high degree of leakage of drug from the SLN matrix. This may be due to expulsion of drug from the lipid matrix. The production of SLN from hot homogenization technique causes crystallization of lipids at least, partially in higher energy modifications, α and βˈ with high degree of imperfections in crystal lattice (Freitas and Muller, 1999; Hagemann, 1998). These modifications may transform to the low energy, more ordered modification, β. The reduced number of imperfections due to high degree of order in the crystal lattice could be the reason for drug expulsion.
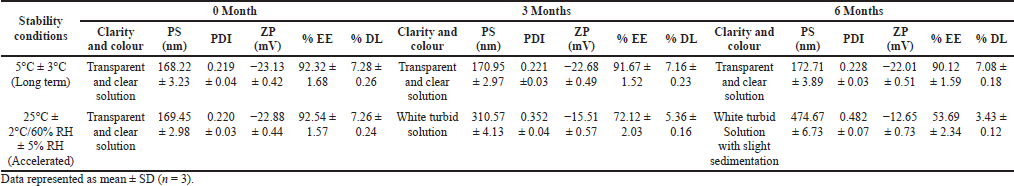 | Table 9. Stability study of MCN-loaded SLN dispersion. [Click here to view] |
CONCLUSION
The MCN-loaded SLN dispersion has been successfully developed by hot HSHM, in vitro characterized and optimized by BBD. The optimized formulation was found stable at refrigerated condition for 6 months, while it was found unstable at accelerated condition. Thus, MCN-loaded SLN dispersion can be safely stored at 5°C ± 3°C. The in vitro drug release study indicates that it can be beneficial for topical delivery of antifungal agent. Furthermore, in vitro permeation and in vivo performance studies need to be carried out to confirm its suitability for faster and complete eradication of fungal growth from skin.
ACKNOWLEDGMENTS
The authors express their sincere gratitude to Pranami Drugs Private Limited, Ankleshwar, Bharuch, Gujarat, India, for providing the gift sample of miconazole nitrate and to the Central Instrumentation Facility, Jamia Millia Islamia University, New Delhi, India, for providing the DSC of the samples. The authors are thankful to the Materials Research Centre, Malaviya National Institute of Technology, Jaipur, India, for analysis and characterization of SLN.
AUTHORS’ CONTRIBUTIONS
All authors made substantial contributions to the conception and design, acquisition of data, or analysis and interpretation of data; took part in drafting the article or revising it critically for important intellectual content; agreed to submit to the current journal; gave final approval of the version to be published; and agree to be accountable for all aspects of the work. All the authors are eligible to be authors as per the International Committee of Medical Journal Editors (ICMJE) requirements/guidelines.
ETHICAL APPROVAL
This study does not involve experiments on animals or human subjects.
CONFLICT OF INTEREST
The authors report no financial or any other conflicts of interest in this work.
FUNDING
There is no funding to report.
PUBLISHER’S NOTE
This journal remains neutral with regard to jurisdictional claims in published institutional affiliation.
REFERENCES
Bhalekar MR, Pokharkar V, Madgulkar A, Patil N, Patil N. Preparation and evaluation of miconazole nitrate-loaded solid lipid nanoparticles for topical delivery. AAPS PharmSciTech, 2009; 10(1):289–96. CrossRef
Bhushan S, Kakkar V, Pal HC, Guru SK, Kumar A, Mondhe DM, Sharma PR, Taneja SC, Kaur IP, Singh J, Saxena AK. Enhanced anticancer potential of encapsulated solid lipid nanoparticles of TPD: a novel triterpenediol from Boswelliaserrata. Mol Pharm, 2013; 10(1):225–35. CrossRef
Cohn MS, Superficial fungal infections. Topical and oral treatment of common types. Postgrad Med, 1992; 91(2):239–44. CrossRef
Drake LA, Dinehart SM, Farmer ER, Goltz RW, Graham GF, Hordinsky MK, Lewis CW, Pariser DM, Skouge JW, Webster SB, Whitaker DC, Butler B, Lowery BJ, Elewski BE, Elgart ML, Jacobs PH, Lesher JL, Scher RK. Guidelines of care for superficial mycotic infections of the skin: Pityriasis (tinea) versicolor. Guidelines/outcomes committee. American academy of dermatology. J Am Acad Dermatol, 1996; 34(2Pt 1):287–9. CrossRef
Freitas C, Muller RH. Correlation between long-term stability of solid lipid nanoparticles (SLN) and crystallinity of the lipid phase. Eur J Pharm Biopharm, 1999; 47(2):125–32. CrossRef
Freitas C, Muller RH. Effect of light and temperature on zeta potential and physical stability in solid lipid nanoparticle (SLN) dispersions. Int J Pharm, 1998; 168(2):221–9. CrossRef
Gaspar DP, Faria V, Gonçalves LM, Taboada P, Remuñán-López C, Almeida AJ, Rifabutin-loaded solid lipid nanoparticles for inhaled antitubercular therapy: physicochemical and in vitro studies. Int J Pharm, 2016; 497(1–2):199–209. CrossRef
Gaspar DP, Gaspar MM, Eleutério CV, Grenha A, Blanco M, Gonçalves LMD, Taboada P, Almeida AJ, Remuñán-López C. Microencapsulated solid lipid nanoparticles as a hybrid platform for pulmonary antibiotic delivery. Mol Pharm, 2017; 14(9):2977–90. CrossRef
Gossel TA, Topical antifungal products. US Pharmacist, 1985; 10:44–6.
Gupta A, Kar HK. Antidermatophytic activity of miconazolenanoformulation against Trichophytonrubrum. Asian Pac J Trop Dis, 2015; 5:707–10. CrossRef
Gupta S, Bansal R, Gupta S, Jindal N, Jindal A. Nanocarriers and nanoparticles for skin care and dermatological treatments. Indian Dermatol Online J, 2013; 4(4):267–72. CrossRef
Hagemann JW. Thermal behavior and polymorphism of acylglycerides. In: Garti N, Sato K, (ed.). Crystallization and polymorphism of fats and fatty acids. Marcel Dekker, New York, NY, pp 9–96, 1998.
ICHQ1A(R2). Stability testing guidelines: stability testing of new drug substances and products. International Council for Harmonisation of Technical Requirements for Pharmaceuticals for Human Use, Geneva, Switzerland, 2003.
Jain S, Jain S, Khare P, Gulbake A, Bansal D, Jain SK. Design and development of solid lipid nanoparticles for topical delivery of an anti-fungal agent. Drug Deliv, 2010; 17(6):443–51. CrossRef
Kalsi PS. Spectroscopy of organic compounds. New Age International, Delhi, India, 2007.
Kamel KM, Khalil IA, Rateb ME, Elgendy H, Elhawary S, Chitosan-coated cinnamon/oregano-loaded solid lipid nanoparticles to augment 5-fluorouracil cytotoxicity for colorectal cancer: extract standardization, nanoparticle optimization, and cytotoxicity evaluation. J Agric Food Chem, 2017; 65(36):7966–81. CrossRef
Kreilgaard M, Influence of microemulsions on cutaneous drug delivery. Adv Drug Deliv Rev, 2002; 54(Suppl 1):S77–98.
Kumar R, Yasir M, Saraf SA, Gaur PK, Kumar Y, Singh AP, Glycerylmonostearate based nanoparticles of mefenamic acid: fabrication and in vitro characterization. Drug Invent Today, 2013; 5(3):246–50. CrossRef
Mai HC, Le TTT, Diep TT, Le THN, Nguyen DT, Bach LG. Development of solid lipid nanoparticles of Gac (Momordica cocochinensis Spreng) oil by nano-emulsion technique. Asian J Chem, 2018; 30(2):293–7. CrossRef
Müller RH, Radtke M, Wissing SA, Solid lipid nanoparticles (SLN) and nanostructured lipid carriers (NLC) in cosmetic and dermatological preparations. Adv Drug Deliv Rev, 2002; 54(Suppl 1):S131–55. CrossRef
Pfaller MA, Sutton DA, Review of in vitro activity of sertaconazole nitrate in the treatment of superficial fungal infections. DiagnMicrobiol Infect Dis, 2006; 56(2):147–52. CrossRef
Pradhan M, Singh D, Singh MR, Development characterization and skin permeating potential of lipid based novel delivery system for topical treatment of psoriasis. Chem Phys Lipids, 2015; 186:9–16. CrossRef
Radomska A, Dobrucki R, Muller RH. Chemical stability of the lipid matrices of solid lipid nanoparticles (SLN)-developmentof the analytical method and determination of long term stability. Pharmazie, 1999; 54(12):903–9.
Samein LH, Preparation and evaluation of nystatin loaded-solid-lipid nanoparticles for topical delivery. Int J Pharm Pharm Sci, 2014; 6(2):592–7.
Sanap GS, Mohanta GP, Design and evaluation of miconazole nitrate loaded nanostructured lipid carriers (NLC) for improving the antifungal therapy. J App Pharm Sci, 2013; 2(1):46–54.
Shah KA, Date AA, Joshi MD, Patravale VB, Solid lipid nanoparticles (SLN) of tretinoin: potential in topical delivery. Int J Pharm, 2007; 345(1–2):163–71. CrossRef
Sharma N, Kushwaha HS, Sharma SK, Sachdev K, Fabrication of LaFeO3 and rGO-LaFeO3 microspheres based gas sensors for detection of NO2 and CO. RSC Adv, 2020; 10:1297–308. CrossRef
Silverstein RM, Webster FX. Spectrometric identification of organic compounds. Wiley, Delhi, India, 2006.
Vardhan H, Mittal P, Adena SKR, Mishra B, Long-circulating polyhydroxybutyrate-co-hydroxyvalerate nanoparticles for tumor targeted docetaxel delivery: formulation, optimization and in vitro characterization. Eur J Pharm Sci, 2017; 99:85–94. CrossRef
Wissing SA, Kayser O, Müller RH, Solid lipid nanoparticles for parenteral drug delivery. Adv Drug Deliv Rev, 2004; 56(9):1257–72. CrossRef
Zhang J, Purdon CH, Smith EW. Solid lipid nanoparticles for topical drug delivery. Am J Drug Deliv, 2006; 4:215–20. CrossRef