INTRODUCTION
Diversity in Nepal’s geography, consisting of plain Terai lands to world’s highest mountain, results in the topographical and climatic variations throughout the country prompting diversity in forest trees. Taxus wallichiana Zucc, commonly called Himalayan yew and locally “Lauth Sallo,” is one of the notable tree species of Nepal. Considered to be slow-growing genera, Taxus is the natural supplier of the anticancer agent Taxol. The researches carried out till date related to Taxus genus are still lacking in providing prolific mechanism for large-scale Taxol production. Since Taxus species like T. wallichiana are enlisted as endangered species, the main issue here is the commercial Taxol production without overconsumption of the natural product. The only possible alternative approach is yielding Taxol in large plant-medium-based bioreactors without exploiting the species in its natural habitat.
Since the medicinal advantages of the plant have been understood, researchers are approaching various techniques to generate Taxol in vitro. Previously, because of the lack of technology and sufficient knowledge, the only method for multiplication was micropropagation. However, owing to its slow-growing nature, the results were not encouraging (Ahuja, 1993). With the scientific advances, callogenesis, organogenesis, embryogenesis, and regeneration came into practice that required efforts but gave results beyond satisfaction. The main advantage was that the plants in their habitat were prevented from being overexploited, as T. wallichiana has been enlisted as an endangered plant (IUCN, 2016).
Callus is the foundation for initiating a variety of cultures. Cell suspensions are initiated by inoculating friable calli into liquid medium, which are further used for large-scale plant cell culture to obtain valuable products (Rao and Ravishankar, 2002). Continuous harvesting of Taxus trees for Taxol extraction to meet the clinical demands is not only insufficient but inappropriate as well. Therefore, the interest has shifted to the production of Taxol in the suspension culture of plant cells. Using biotechnological advances, semi- or total synthesis of Taxol has been carried out by culturing endophytes and in cell suspension cultures. Yielding Taxol in bioreactors without destroying plant in its natural habitat for continuous and abundant production is being considered the best long-term alternative approach for taxoid production (Lee et al., 2010). Many scientists prefer two-phase culture along with the use of elicitors to increase the productivity along with maintaining the integrity of the cells (Dornenburg and Knorr, 1995).
Random amplified polymorphic DNA (RAPD) molecular markers are moderations of polymerase chain reaction (PCR) that originated in the late 1980s (Williams et al., 1990). The RAPD technique can reveal polymorphisms between very closely related genotypes. This technique has found a wide range of applications, mainly due to the speed, cost, and efficiency in generating the results in a short period compared to previous methods (Bardakci, 2001). Since successful regeneration by artificial methods is yet to be known and natural regeneration of the species is slow (Svenning and Magard, 1999), an insight into its microhabitat preferences might provide prospectus for further studies. Thus, phenotyping through callus regeneration and cell suspension system of T. wallichiana followed by molecular characterization using RAPD-PCR technique is the major objective of this current study.
MATERIALS AND METHODS
Tissue culture experiments
Preparation of plant explants
Fresh green needles and young stems were chosen as explants (Fig. 1). Stems were stripped of needles before sterilization. Explants were surface sterilized first with Tween 20 for 10–15 minutes and rinsed under running water for half an hour and finally in 0.1% HgCl2 (w/v) for 5 minutes.
 | Figure 1. Taxus samples collection. [Click here to view] |
Callus establishment
Gamborg’s B5 medium supplemented with 2 × B5 vitamins, 20 g/l sucrose, 100 mg/l myo-inositol, and 0.2 mg/l kinetin was used as the growth medium. In total, five B5 media were used, which varied in their phytohormone composition [2,4-D and naphthaleneacetic acid (NAA)]. The pH was adjusted to 5.8 ± 0.1 before autoclaving at 121°C at 15 psi pressure for 20 minutes. The media were solidified using 0.8% agar. Incubation in growth chamber was maintained at 25°C ± 2°C with relative humidity above 50% under a photoperiod of 8 hours dark and 16 hours light.
Cell suspension culture
Cell suspension culture was instigated by suspending 2 gm of viable callus in 50 ml of medium in closed flasks placed on an orbital shaker at 90–110 rpm maintained at 25°C ± 2°C in continuous dark. A two-stage culture was carried out: Stage I, culture initiation, and Stage II, proliferation and biomass growth stage. In Stage I, the mother culture consisted of Gamborg’s B5 medium the same as that used for callus induction but without agar. Once the cell suspension cultures were initiated, Stage II was introduced to determine the effects of various parameters on cell growth and viability. Parameters studied were effects of sucrose amount, sugar sources, phytohormone concentrations, inoculum volume, and macronutrient concentrations. Cell growth and viability were monitored using Duncan and Widholm’s (1990) methods. Cell count was carried out at the end of each week for 5 weeks using triplicate.
Chromatographic analysis
Sample preparation
There were three types of samples for thin layer chromatography (TLC) and high performance liquid chromatography (HPLC) analysis: (1) crude samples from bark and needle, (2) extract from callus samples, and (3) extract from suspension culture samples. Crude samples were extracted from 11 samples collected from 11 sampling sites (districts) of Nepal (Fig. 2): Gorkha (G1), Taplejung (T1), Rasuwa (R1), Sindhupalchok (Sind1), Mustang (Mus1), Manang (Man2), Annapurna Conservation Area Project (ACAP) region (ACAP3), Solukhumbu (Sol4), Parbat (P18), Sikles (Sik18), and Lamjung (L23). For extract from callus, freeze-dried callus was extracted using methanol (1:10 w/v), centrifuged, dried at room temperature, and dissolved in methanol for storage. For the suspension culture ones, the culture after the 5th week was strained to obtain cell-free medium. Harvested cells were used to determine biomass, whereas obtained cell-free medium was extracted with an equal volume of ethyl acetate. Finally, the bottom layer was collected, dried up at room temperature, and dissolved in methanol for storage (Sharma et al., 2015). All sample types were stored at 4°C and ensured that the methanol quotient was completely dried before use.
TLC experiments
TLC analysis of the crude extracts of the different samples was carried out according to the method proposed by Glowniak and Mroczek (1999) and Sharma et al. (2015) with little modifications. The methanolic sample extracts as well as methanolic solutions of Taxol standards, paclitaxel (purchased from Sigma), were spotted on TLC plates (TLC Silica gel 60 F254, 20 × 20 cm). The quaternary mobile phase, benzene : chloroform : acetone : methanol (20 : 92.5 : 15 : 7.5), was used. The plates were sprayed with 2% AlCl3 and observed under UV light (254 nm). The compound was marked horizontally in line with standard Taxol and extracted for HPLC analysis.
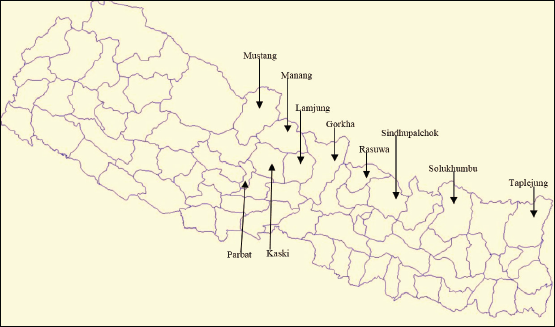 | Figure 2. Districts of Nepal selected as sample collection sites. [Click here to view] |
HPLC analysis
Reverse-phase HPLC analysis and quantification of Taxol were carried out using a reverse-phase C18 column (Shim-pack GIST C18, 5 μm, 150 × 4.6 mm I.D.) in a Shimadzu LC-2030 instrument with UV absorbance at 227 nm (Li et al., 2017; Liu et al., 2009; Zaiyou et al., 2017). For this, injection volume of sample was maintained at 15 μl on the C18 column at a column temperature of 30oC. The separation was carried out at a flow rate of 1 ml/minutes with a gradient acetonitrile-water (v/v) system (50% of acetonitrile for 0–10 minutes, 90% of acetonitrile for 10–12 minutes, again 50% of acetonitrile for 12–15 minutes, and stop after 15 minutes). Standard curve (r2 = 0.99) was generated using 5, 10, 15, 25, 50, and 100 μg/ml authentic paclitaxel solutions. Quantification of Taxol was carried out according to the following formula (Liu et al., 2009): M = Mo × V1 × 106/V2. Mo (mg/ml) denotes the Taxol content in methanol solution (per ml), V1 (ml) denotes the methanol volume used to redissolve the crudes, and V2 (ml) denotes the metabolites extraction volume.
Molecular characterization
Plant Deoxyribonucleic acid (DNA) isolation
Taxus wallichiana samples were collected from 11 sites in Nepal. Barzegari et al. (2010) DNA extraction procedures were adopted for plant genomic DNA isolation. DNA was observed by agarose gel electrophoresis. 0.8% agarose was used to prepare the gel, and 3 μl of ethidium bromide was used as the visualization dye. 0.5 × Tris-Borate-EDTA was used as the electrophoresis buffer. The bands were spotted and snapped using a Gel Documentation System for further analysis.
RAPD-PCR analysis
Out of 10 arbitrary Operon A (OPA) primers, 6 primers gave the best result after carrying out RAPD-PCR. A 25 μl PCR reaction was made consisting of sterile water, sample DNA, 10 mM Primer, Master Mix, 25 mM MgCl2, and tag polymerase, the concentration of which varied with variation in primer. Amplification was carried out in a thermocycler for 3 minutes at 94°C (initiation denaturation), 15 seconds at 94°C (denaturation), 30 seconds at 35°C (annealing), and 90 seconds at 72°C (elongation). Steps 2–4 were rerun for further 44 cycles, followed by resting at 72°C for 3 minutes, and lastly holding step at 4°C. PCR results were screened using gel electrophoresis using 1% agarose. Polymorphic bands were scored as binary data (band present = 1; absent = 0) to generate a binary data matrix. Genetic variation was estimated using the POPGEN 32, version 1.31, and these indices were calculated: number of alleles per locus, effective number of alleles per locus, percentage of polymorphic loci, Nei’s gene diversity (h*), and Shannon’s index (I*). Nei’s unbiased measures of genetic distance were used to assemble a dendrogram using the UPGMA algorithm
Statistical analysis
The data recorded are summarized and represented as mean ± SD. Statistical analysis was carried out using standard deviation and one-way analysis of variance using Statistical Package for the Social Sciences SPSS. The statistical analysis based on mean values per treatment was made over a 95% confidence interval (p < 0.05) to determine whether the treatments and their means were significant using Tukey’s test.
 | Table 1. Properties of calli induced from different explants of T. wallichiana. [Click here to view] |
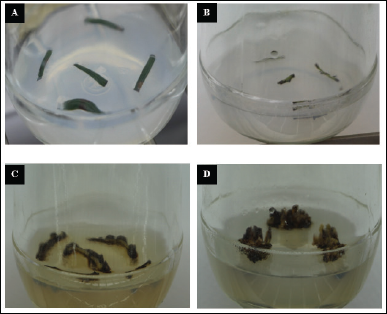 | Figure 3. Callus establishment from T. wallichiana. (A) Needles as explant. (B) Stem cuttings as explant. (C) and (D) One1-month-old and 6-months-old Taxus calluses from stem explants. [Click here to view] |
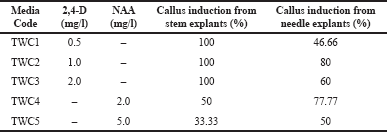 | Table 2. Callus induction from stem and needle explants on different culture media. [Click here to view] |
RESULTS AND DISCUSSION
Callus induction
The attributes of callus induced from two different explant types were comparatively different in morphology and color (Table 1). However, the changes were not as separable for the separate media compositions used. The calluses were pale yellow to brownish. In all media made, the growth of calluses was distinctly observed. Also, both the stem and needle cuttings used as explants showed prominent results in callus establishment (Fig. 3).
From Table 2, it is clear that, among the five different media used, Taxus wallichiana Culture 2 (TWC2) showed the highest callus induction percentage for both stem and needle explants (100% and 80%), whereas TWC5 showed the lowest callus induction percentage (33.33% and 50%). Furthermore, the media containing 2,4-D was seen to be the best for callus induction from stem explants compared to media containing NAA.
Callus usually serves as a starting material for a variety of cultures. In the case of Taxus species, previous researches showed stem and needles to be excellent explants for callus induction (Jha et al., 1998). However, more recent studies have added zygotic embryos as one of the prominent explants to initiate callus culture (Datta and Jha, 2008). In this study, stem and needles were tested as explants for callus induction as they were more readily available than the seeds. Studies suggest that Gamborg’s B5 medium, in comparison to MS medium, favors callus growth (Brunakova et al., 2004; Toulabi et al., 2015); this is why Gamborg’s B5 medium was preferred over MS medium in this study. Besides B5 and MS medium, woody plant medium supplemented with auxin and cytokinin (Mahdinejad et al., 2015) or stimulating hormones (Datta et al., 2006) has also been frequently used to generate calli from Taxus species.
Stem and needle explants have been successfully used to induce callus from various Taxus species such as Taxus brevifolia, Taxus baccata, Taxus cuspidate, and Taxus media on Gamborg’s B5 medium supplemented with auxins like 2,4-D, NAA, and indole-3-butyric acid (IBA) at various concentrations in combination with 0.2 mg/l Kinetin (Arteca and Wickremesinhe, 1993). Worldwide, the authors suggest 2,4-D to be a better source of auxin for callus not only for Taxus but also for other plant varieties, as well such as wheat (Zheng and Konzak, 1999), oil palm (Reflini, 2017), and many more. In this study, 2,4-D in combination with kinetin gave the finest results for callus induction. This finding is supported by various authors including Hussain et al. (2013) in T. baccata and Karimian et al. (2014) in T. brevifolia. Das et al. (2015) revealed that callus was initiated and developed in B5 medium supplemented with hormonal combination of 2,4-D and kinetin, whereas other combinations using GA3, indole-3-acetic acid, IBA, and 6-Benzylaminopurine in B5 medium resulted in no callus initiation even after 80 days. Additionally, Dalila et al. (2013) recorded callus induction of >60%; and Saikia et al. (2013) recorded 70%–73% callus induction using the combination of 2,4-D and kinetin supporting our findings. To sum up, the hormonal combination of 2,4-D and kinetin in Gamborg’s B5 medium is recommended to generate fine quality callus mass along with high production percentage.
Cell suspension culture
Once the calluses were fully developed, they were used to initiate suspension culture. Friable and viable calluses were extracted from the basal medium and subjected to liquid medium for suspension culture (Fig. 4). On a weekly basis, cell number per ml and cell viability were calculated.
Effects of explant sources
Effects of two different explant sources, needle and stem of T. wallichiana, were studied. The explants were cultured on the same five basal media on which the calluses were induced. Comparatively, calluses induced from needles exhibited better cell growth than the ones from stems (Fig. 5). Also, 2,4-D (Media TW1–TW3) showed higher cell growth than NAA (Media TW4 and TW5).
Effects of different concentrations of sucrose
Five concentrations of sucrose were studied: 10, 15, 20, 25, and 30 g/l (Fig. 6). For control, the liquid medium was deprived of any sucrose source. Sucrose used at a concentration of 30 g/l gave a significantly (p < 0.05) higher cell count of 7.88 ± 0.04×10⁴ cells/ml compared to 10 g/l which resulted in the least cell count of 3.6 ± 0.04×10⁴ cells/ml. This shows that the higher the concentration of sucrose, the higher the cell growth as the cell gets enough carbohydrate for the division. As the weeks added up, the cell counts increased; however, this also led to a decrease in viability close to 50% clearly because the nutrient amount decreased, leading to cell death. Therefore, subculture is suggested as soon as the culture color turns brownish, which indicates nutrient deprivation in the medium.
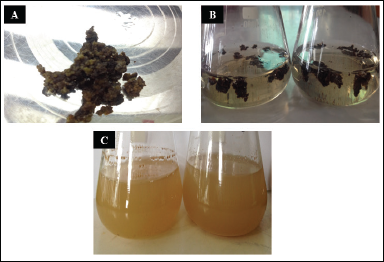 | Figure 4. Cell suspension culture of T. wallichiana. (A) Callus ready for suspension culture, (B) suspension culture at initial phase, and (C) suspension culture ready for subculture. [Click here to view] |
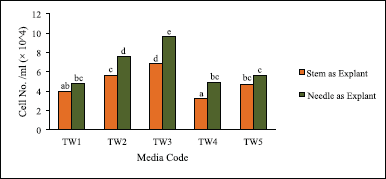 | Figure 5. Effect of explant source, hormone, and its concentration on cell count of suspension culture of T. wallichiana. Data represent mean ± SD (n = 3). Means sharing the same letters do not differ significantly at p < 0.05 (Tukey’s test). [Click here to view] |
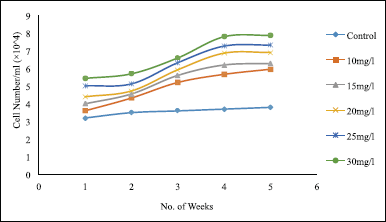 | Figure 6. Effect of different sugar concentrations on suspension culture of T. wallichiana. Data represent mean ± SD (n = 3). [Click here to view] |
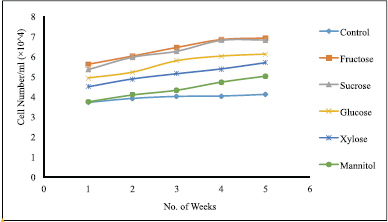 | Figure 7. Effect of different carbon sources at conc. of 20 g/l on suspension culture of T. wallichiana. Data represent mean ± SD (n = 3). [Click here to view] |
The control demonstrated the lowest induction for both cell count and viability. The cell count was as low as 3.2 ± 0.02 × 10⁴ cells/ml, and cell viability decreased to less than 50% in the 5th week, as there was no carbon source at all. Although the control lacked sucrose, the culture managed to grow to a certain amount but still the growth was significantly (p < 0.05) low compared to other cases. This might be due to other supplements present in the media and the endogenous compounds produced by the plant cells using the components present in the medium. However, this was not enough to promote long-term growth.
Effects of different carbon sources
Five carbon sources (fructose, sucrose, glucose, xylose, and mannitol) at a concentration of 20 g/l were supplemented in the medium to evaluate the effects of carbon sources. Throughout the 5 weeks of observation (Fig. 7), it was found that fructose gave the best results for cell count, whereas mannitol gave the least satisfactory result. Sucrose followed fructose proving to be the next best carbon source as their significant differences (p < 0.05) were also minimal.
Effects of different concentrations of 2,4-D and NAA
The effect of 2,4-D concentration was determined by investigating six different 2,4-D concentrations (0.5, 1, 2, 3, 4, and 5 mg/l). Of all the treatments, 2 mg/l 2,4-D treatment gave significantly (p < 0.05) best result, whereas 5 mg/l gave the least value for cell count, even lower than 0.5 mg/l treatment (Fig. 8). After 2 mg/l, as the amount of hormone increased significantly (p < 0.05), a decrease in cell count was observed, even lower than that obtained for 0.5 mg/l treatment. However, cell viability was lowest in the case of 0.5 mg/l and increased as the concentration of 2,4-D increased. These changes may be because 2,4-D being an auxin when supplemented as a hormone in the suspension culture induces complex physiological modifications including cell walls permeability and cell wall pore size increment, leading to an increase in cell viability. Besides, increment in hormone concentration might have a certain inhibitory effect on the growth of cells and cell division.
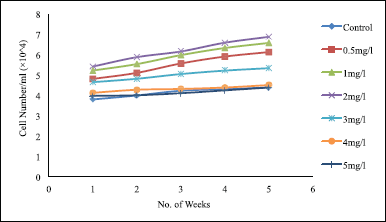 | Figure 8. Effect of different concentrations of 2,4-D on suspension culture of T. wallichiana. Data represent mean ± SD (n = 3). [Click here to view] |
 | Figure 9. Effect of different concentrations of NAA on suspension culture of T. wallichiana. Data represent mean ± SD (n = 3). [Click here to view] |
Similar to 2,4-D, for NAA also six treatments were designed (0.5, 1, 2, 3, 4, and 5 mg/l). 5 mg/l NAA treatment showed significantly (p < 0.05) highest cell count and cell viability; however, as the concentration decreased, decrease in both attributes was observed (Fig. 9). The cell count for 0.5 mg/l and the control were near to similar, showing negligible effect of a low amount of NAA; however, cell viability was comparatively higher than that of the control.
Effects of different inoculum volumes
The effects of four different inoculum volumes (5, 10, 15, and 20 ml), on the growth rate of T. wallichiana suspension culture, were studied. An inoculum volume of 20 ml produced the highest growth rate of 18.44 ± 0.02 × 10⁴ cells/ml in the 5th week. Meanwhile, treatment with 5 ml of inoculum volume yielded the least cell growth of 5.21 ± 0.09 × 10⁴ cells/ml. Significant differences (p < 0.05) in cell count were observed, as 20 ml inoculum volume yielded three times more cell growth compared to 5 ml inoculum volume. Cell viability was maintained well above 50%, indicating the success of the tests and showing off the advantages of increased inoculum volume. This test explains the plant’s requirements for critical minimal inoculum density for cell suspension culture.
Effects of changes in the concentrations of each macronutrient
In B5 medium, four macronutrients were used: (NH4)2SO4, KNO3, MgSO4.7H2O, and NaH2PO4.H2O. The effects of different concentrations of each macronutrient were studied one by one. Results showed a significant (p < 0.05) decrease in cell count and viability upon the addition of the various macronutrient, except for MgSO4.7H2O, in which the result was reversed. This shows that the amount maintained in the basal medium is appropriately enough for cell division. Any addition of extranutrients exhibits inhibition in the growth, except for Magnesium, which is usually preferred at higher concentrations compared to other macronutrients.
Large-scale bioreactors are being considered for stable and long-term production and accumulation of Taxol (Lee et al., 2010). Khosroushahi et al. (2006) employed a two-stage suspension culture method using Gamborg’s B5 medium as basal medium and explored different inducing factors, similar to the current study in attempts to improve Taxol production in suspension culture of T. baccata. Jha et al. (1998) reported an increment in Taxol yield in cell suspension culture of T. wallichiana by two-stage culture, proving that this method is beneficial for the optimization of Taxol accumulation.
Several attempts have been made for the optimization of cell suspension culture by studying the effects of various aspects on cell biomass and viability. In this study, the results showed that when the sucrose level increased, cell growth increased. The high sucrose content reduced the water tab of the culture cell, and the sucrose availability in the media became adequate for cell metabolism (See et al., 2011). However, higher sucrose levels (60 g/l or more) tend to inversely affect cell growth (Sato et al., 1996). Fructose, sucrose, and glucose served as the best carbon sources in this study, which is supported by the findings of Ketchum et al. (1995).
2,4-D treatment at low concentrations gave better cell growth, which was found similar in the study carried out by Gibson et al. (1993) and Ashrafi et al. (2010). But on the contrary, higher concentrations of NAA resulted in increased cell growth (Abdullah et al., 2005). In this study, inoculum volume showed a directly proportional relation to cell growth. According to Guo and Zhang (2005), a lower inoculated amount (<0.5% w/v) results in slower proliferation, while a higher amount (>2% w/v) results in faster proliferation. The constitution of macro- and microelements in most standard media is the result of manipulation of one or more combinations of existing formulations. This study revealed macrosalts at concentration 1 × (NH4)2SO4, 1 × KNO3, 1 × NaH2PO4.H2O, and 3 × MgSO4.7H2O supports for the optimal growth of T. wallichiana cell suspension culture. However, the condition may vary from genus to genus or species to species, depending upon the media in which the callus used to initiate the suspension culture was induced.
Dynamics of Taxol production in crude, callus, and suspension culture
Taxus species are the main sources of Taxol. Hence, to detect the Taxol, scrapped silica powder containing the putative Taxol was eluded with HPLC-grade methanol and subjected to HPLC analysis. First standard Taxol solution (ST-S) was run, which gave a distinct peak at a retention time of 5.904 minutes. Similarly, scrapped ST-S was run, which also showed a distinct peak at a retention time of 5.787 minutes. Minimal variation in seconds is considerable taking into account the experimental errors. For samples also, the scrapped silica powder with putative Taxol was eluded with HPLC-grade methanol and subjected to HPLC analysis. For all the samples, a distinct peak at retention time close to that for ST-S was observed (Fig. 10).
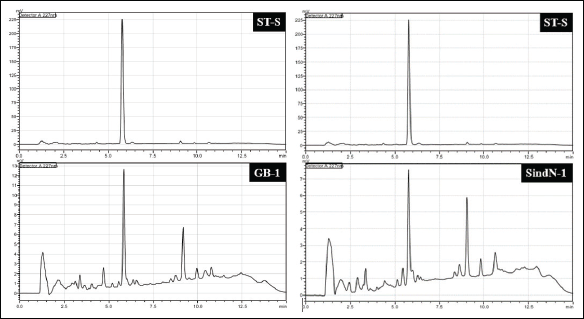 | Figure 10. Comparison of HPLC chromatogram. Left: ST-S (standard Taxol) and GB-1 (bark sample). Right: ST-S and SindN-1 (needle sample). [Click here to view] |
Analysis of Taxol content in crude samples
In the case of the crude samples, the range of Taxol yield was 0.005%, that is, approximately 0.05 mg/g dry weight of the plant sample. In the case of bark samples, the Taxol yield ranged from 0.057 mg/g DW (0.0057%) to 0.051 mg/g DW (0.0051%). In the case of needle samples, the highest Taxol content of 0.055 mg/g DW and the lowest value of 0.051 mg/g DW was estimated. Considering the decimal digits’ values and despite the minimal differences, it is clear that the needle samples exhibited higher Taxol concentrations compared to the bark samples.
In terms of the sex, the highest Taxol yield for male (MusB1-M) and female (MusB13-F) samples in the case of bark was 0.053 mg/g DW (0.0053%) and 0.054 mg/g DW (0.0054%), respectively. In case of the needle, the highest yields were 0.055 mg/g DW (0.0055%) for males and 0.053 mg/g DW (0.0053%) for female samples; both samples were from Mustang. The differences observed were minimal between the bark and needle and also between males and females (Fig. 11).
Analysis of Taxol content in callus samples
Needle explants revealed better Taxol yield compared to bark (Fig. 12), similar to the case for biomass. The highest Taxol yield of 0.035 mg/g DW (0.0035%) was observed in callus induced from needles with media supplemented with 2 mg/l 2,4-D (TW3), for which biomass was also the highest at 16.642 g/l. The lowest Taxol yield was exhibited by stem explants of 0.033 mg/g DW (0.0033%) supplemented with 2 mg/l NAA, with the lowest biomass of 16.062 g/l.
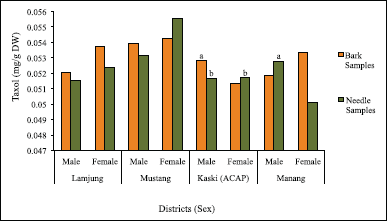 | Figure 11. Taxol content in bark and needle samples with variance in sex. Data represent mean ± SD (n = 3). Means sharing the same letters do not differ significantly at p < 0.05 (Tukey’s test). [Click here to view] |
 | Figure 12. Taxol content and biomass of callus from different explant sources in various culture media. Data represent mean ± SD (n = 3). Means sharing the same letters do not differ significantly at p < 0.05 (Tukey’s test). *No significant difference at p < 0.05 (Tukey’s test). [Click here to view] |
Analysis of Taxol content in suspension culture samples
For sample extracts obtained from suspension culture, Taxol yield was also detected at the retention time near to that of ST-S with concentration ranging to 0.004%; however, the peaks were not as distinct as for crude samples. For the parameters concerning carbohydrate/sugar, the first parameter was sucrose concentration variation, in which 30 g/l sucrose concentration showed the best results. The highest biomass was recorded at 15.61 g/l in the 5th week of the culture, whereas Taxol content was the highest at 0.042 mg/g DW (0.0042%) in the 4th week (Fig. 13).
In the case of variable sugar sources, fructose revealed the highest biomass yield of 15.764 g/l in the 5th week and the Taxol yield of 0.041 mg/g DW (0.0041%) in the 4th week. As before, the lowest biomass and the Taxol content of 3.769 g/l and 0.011 mg/g DW (0.0011%), respectively, were observed in the 1st week (Fig. 14).
In the case of the variable phytohormones and their concentration, 2 mg/l 2,4-D when supplemented in the media revealed the best results for both biomass and Taxol content (Figs. 15 and 16). The highest biomass was noted of 15.726 mg/l during the 4th week, and the lowest was 3.852 mg/l in the 1st week. In the 4th week, the Taxol content was maximum of 0.046 mg/g DW (0.0046%), while the lowest was 0.009 mg/g DW (0.0009%) in the 1st week.
Out of the four inoculum volumes tested, 20 ml of inoculum volume exhibited maximum values for both biomass in the 5th week and Taxol content in the 4th week (Fig. 17). Biomass of 15.742 g/l was noted as maximum in the 5th week, while a minimum of 3.63 g/l was noted in the 1st week. Taxol content ranged from 0.011 mg/g DW (0.0011%) in the 1st week to the highest of 0.049 mg/g DW (0.0049%) in the 4th week.
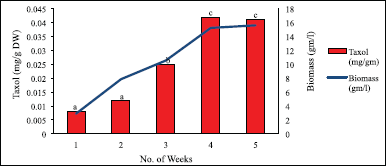 | Figure 13. Taxol content and biomass in suspension culture with 30 gm/l sucrose. Data represent mean ± SD (n = 3). Means sharing the same letters do not differ significantly at p < 0.05 (Tukey’s test). [Click here to view] |
 | Figure 14. Taxol content and biomass in suspension culture with fructose. Data represent mean ± SD (n = 3). Means sharing the same letters do not differ significantly at p < 0.05 (Tukey’s test). [Click here to view] |
Like in cell count, here also, suspension culture supplemented with macronutrients at 1× concentration exhibited maximum biomass yield and Taxol content (Fig. 18): 15.678 g/l was maximum biomass yield recorded in the 5th week, whereas a minimum of 2.955 g/l was recorded in the 1st week. Maximum Taxol yield was of 0.04 mg/g DW (0.004%) in the 4th week, and a minimum was observed of 0.009 mg/g DW (0.0009%) in the 1st week.
Taxol separated directly from the crude extract using the preparative TLC method gave good separation of the peak at a retention time near about the same as that of the standard Taxol purchased from Sigma. Very few mobile phases are suitable while carrying out TLC analysis of yew extracts on silica gel plates. Glowniak and Mroczek (1999) investigated 20 mobile phases to ensure the best separation of various toxoids, out of which the quaternary mobile phase comprising benzene–chloroform–acetone–methanol developed the best separation, which concurs with the present investigation. Two criteria, the retardation factor (Rf) and selectivity, are important when choosing the best mobile phases.
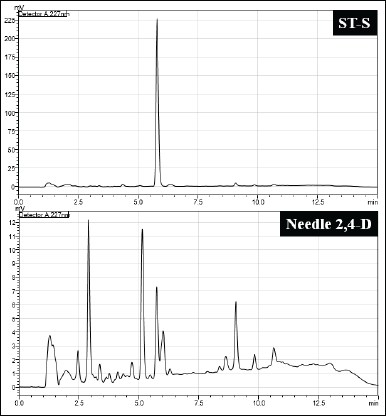 | Figure 15. Comparison of HPLC chromatogram between ST-S and callus sample from needle in suspension culture with 2 mg/l 2,4-D in the 4th week. [Click here to view] |
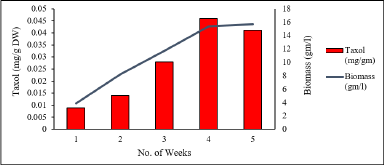 | Figure 16. Taxol content and biomass in suspension culture supplemented with 2 mg/l 2,4-D. Data represent mean ± SD (n = 3), and show significant differences at P<0.05 (Tukey’s test). [Click here to view] |
 | Figure 17. Taxol content and biomass in suspension culture inoculated with 20 ml inoculum volume. Data represent mean ± SD (n = 3). Means sharing the same letters do not differ significantly at p < 0.05 (Tukey’s test). [Click here to view] |
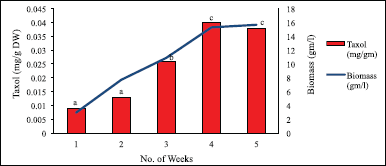 | Figure 18. Taxol content and biomass in suspension culture with macronutrients at 1× concentration. Data represent mean ± SD (n = 3). Means sharing the same letters do not differ significantly at p < 0.05 (Tukey’s test). [Click here to view] |
The HPLC program for current investigations matches that of Khosroushahi et al. (2006) and Ghassempour et al. (2009); difference being the injection volume which was 15 μl for this study and 20 μl for the latter two. Besides acetonitrile : water, other combinations of mobile phase have also been reported, such as methanol : acetate buffer (Arteca and Wickremesinhe, 1993), chloroform : water : acetic acid (Shi and Zhou, 2003), methanol : water, and chloroform : acetone (Migas and Switka, 2010) for HPLC separation of Taxol. However, the retention time for the Taxol peak was different in almost all the cases, which may be because of the difference in the HPLC system used and the difference in the injection volume.
Yew species are slow growing, containing a very small amount of paclitaxel, approximately 0.01% dry weight of the bark (Yukimune et al., 1996). However, depending on the age, maturity, and surrounding factors, the concentration has been found to vary ranging from 0.005% for 4–10-year-old plant species to 0.01% for 100-year-old mature plants (Gibson et al., 1993). This finding confirms our results for crude samples extracted from bark and needles. The yield in this study was in the range of 0.005%, suggesting that the samples must have been collected from plants aged 4–10 years.
The highest Taxol yield obtained from callus in this study was 0.0035% in the callus induced by needle explants supplemented with 2 mg/l 2,4-D. Ashrafi et al. (2010) reported maximum Taxol yield in medium supplemented with 2,4-D. The yield increased after 2nd week and end of 3rd week and starting of 4th week showed to be the most productive stage. Arteca and Wickremesinhe (1993) noted callus exhibiting Taxol levels ranging from 0.0001% to 0.0131% of dry weight. Thus, this study’s result concurs with that of Arteca and Wickremesinhe (1993) as the value falls within the range mentioned. In the case of suspension culture, the yield is in the range of 0.004%. Literature concerning these parameters has been published less; however, yields ranging from 0.001% to –0.01% have been revealed in cases where elicitors have not been introduced (Yukimune et al., 1996). In this study also, elicitors have not been introduced; hence the result can be considered satisfactory in comparison with the findings obtained in available published researches. The decrease in Taxol concentration after a certain phase in this study is consistent with findings obtained by Syklowska-Baranek and Furmanowa (2005), who gave precipitation of metabolites in the medium after long exposure to be the tentative reason.
Molecular characterization
Out of 10 arbitrary primers screened, 6 revealed clear and distinct polymorphisms in 11 varieties, producing a total of 49 polymorphic loci. The percentage of polymorphism of the amplified DNA fragments was calculated as 100.00. Primers OPA02, OPA04, OPA09, OPA10, OPA18, and OPA19 were able to distinguish all the Taxus genotypes. The GC% of all primers used was above 50%. The obtained amplified DNAs size ranged between 200 and 2,000 bp, while being checked against 1 kb standard marker DNA (Figs. 19–22).
The mean observed number of alleles was estimated to be two, while the effective number of alleles was 1.585 ± 0.281. Using the POPGEN 32 software package, version 1.31, Nei’s gene diversity was calculated to be 0.348 ± 0.122 and Shannon’s information index was assessed to be 0.524 ± 0.143.
Table 3, by using the POPGEN 32 software package, version 1.31, summarizes the genetic identity and genetic distance between the 11 samples studied. If the genetic identity is close to 1, this means that they are close to being identical, whereas if the genetic distance is close to 1, it means that they are genetically different. The genetic distance between samples Sind1 and P18 was found to be the largest of 0.896, indicating that these two are vastly dissimilar. Also, they share the least genetic identity of 0.408. The least genetic distance was shared by G1 and Mus1, Mus1, and Sik18, and P18 and Sik18 of 0.228, which indicates that these are genetically similar to some extent. These also shared the highest genetic identity of 0.796. The reason for the high genetic similarity could be geographic proximity and similarity since the populations in the close locale are likely to be similar, as genetic differentiation is often prevented by gene flow. To make the analysis more comprehensive, similarity and cluster analysis were determined using Nei’s coefficient and the UPGMA method, the results of which are presented in the dendrogram shown in Figure 23. The dendrogram clearly separated the samples in various clusters according to their similarity. It is clear that altitude alone does not completely bring about the similarity or dissimilarity as the difference in the altitude is very low. There might be other factors that determine their genetic properties.
 | Figure 19. RAPD profile generated by primer OPA04. [Click here to view] |
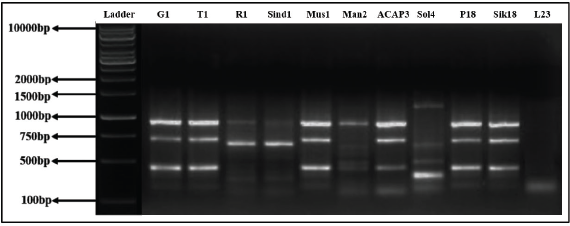 | Figure 20. RAPD profile generated by primer OPA10. [Click here to view] |
 | Figure 21. RAPD profile generated by primer OPA18. [Click here to view] |
 | Figure 22. RAPD profile generated by primer OPA19. [Click here to view] |
 | Table 3. Nei's unbiased measures of genetic identity and genetic distance. [Click here to view] |
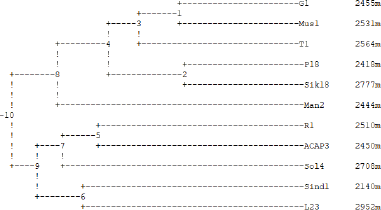 | Figure 23. Dendrogram based on Nei’s genetic distance, method = UPGMA. [Click here to view] |
RAPD paired population markers are efficient enough for estimating genetic variation among various genotypes (Williams et al., 1990). These markers tend to derive the genetic variation by evaluating the entire genome (Virk et al., 2000). The study of genetic diversity among T. baccata genotypes in Iran used RAPD markers which showed high levels of polymorphism, confirming RAPD markers as suitable for the genetic diversity study of yew (Zamani et al., 2008). RAPD markers also confirmed regional differentiation in Swiss populations of English yew (Hilfiker et al., 2004), assessed genomic diversity within Taxus cuspidata population (Li et al., 2006), and determined genetic diversity within and among populations of Taxus fauna from Pakistan (Shah et al., 2008). Collins et al. (2003) researched DNA markers to differentiate Taxus baccata, Taxus canadensis, T. cuspidate, and hybrids (T. media and Taxus hunnawelliana). In Zarek (2016) successfully used RAPD and inter-simple sequence repeat primers for sex determination of individuals of the European yew.
This current investigation has given an account of the genetic diversity and genetic relatedness in the context where there is an absence of knowledge of ancestry of all individuals among T. wallichiana cultivars across various districts of Nepal. Findings from the current research confirm the suitability of RAPD markers to reveal genetic relationships among species’ populations, specifically relating populations of unknown origin with those having more complete documentation. Population genetic methods are usually employed to analyze the genetic variation observed in the species. Molecular markers identify genetic diversity within or between populations or groups of individuals by detecting the level of polymorphism. Additionally, using RAPDs multiple loci in a single gel run can be analyzed for individual population which makes the process more expressive and effective.
CONCLUSION
Taxus wallichiana, being an anticancerous medicinal plant, has a high chance of becoming extinct, as it has already been listed as an endangered species. Since successful regeneration by artificial methods has not been procured yet and natural regeneration of the species is slow or poor, the development of regeneration techniques using a biotechnological approach can enhance its survival. Therefore, an urgent strategic plan of action has to be formulated and implemented with the objective of protecting and making sustainable use of this species. Taxol production from plant cell culture under laboratory conditions not only reduces the pressure on natural habitat but also ensures continuous production of Taxol irrespective of season. Taxol, obtained from plant cell culture, may be supplied to Nepalese Pharmaceutical Companies, which can be expected to contribute to the economic development of the country. Also, the study of genetic variability of the populations helps to better understand the genetic relationship among populations from different sampling locations and hence suggests the elite species for further conservation. Therefore, the present study not only provides a horizon to explore the T. wallichiana species of Nepal but also sorts out the best methods feasible to execute further research options.
ACKNOWLEDGMENTS
The authors would like to offer their cordial thanks to Swedish Research Council, Sweden, for providing financial assistance. They are much obliged to the Department of Biotechnology, Kathmandu University, Nepal, for giving them access to all the laboratories, and the Department of Pharmacy, Kathmandu University, Nepal, for their immense help throughout the HPLC procedures. They would also like to acknowledge Mr. Ashesh Acharya, Mrs. Nita Thapa, and Ms. Sodiya Suwal, Plant Tissue Culture Laboratory, Department of Biotechnology, Kathmandu University, Nepal, for their laboratory help and support. Heartfelt gratitude to Khagendra Acharya, Assistant Professor (English), for sharing his expertise on language editing.
AUTHOR CONTRIBUTIONS
All authors made substantial contributions to conception and design, acquisition of data, or analysis and interpretation of data; took part in drafting the article or revising it critically for important intellectual content; agreed to submit to the current journal; gave final approval of the version to be published; and agree to be accountable for all aspects of the work. All the authors are eligible to be an author as per the international committee of medical journal editors (ICMJE) requirements/guidelines.
CONFLICTS OF INTEREST
The authors report no financial or any other conflicts of interest in this work.
ETHICAL APPROVALS
This study does not involve experiments on animals or human subjects.
PUBLISHER’S NOTE
This journal remains neutral with regard to jurisdictional claims in published institutional affiliation.
REFERENCES
Abdullah MA, Lajis NH, Ali AM, Marziah M, Sinskey AJ, Rha CK. Issues in plant cell culture engineering for enhancement of productivity. Dev Chem Eng Process, 2005; 13:1–15. CrossRef
Ahuja MR. Micropropagation of woody plants. Kluwer Academic publishers, Dordrecht, The Netherlands, 1993.. CrossRef
Arteca RN, Wickremesinhe ERM. Taxus callus cultures: initiation, growth optimization, characterization and Taxol production. Plant Cell Tissue Organ Cult, 1993; 35:181–93. CrossRef
Ashrafi S, Mofid MR, Otroshi M, Ebrahimi M, Khosroshahli M. Effects of plant growth regulators on the callogenesis and taxol production in cell suspension of Taxus baccata L. Trakia J Sci, 2010; 8(2);36–43.
Bardakci F. Random amplified polymorphic DNA (RAPD) markers. Turk J Biol, 2001; 25(2):185–96.
Barzegari A, Vahed SZ, Atashpaz S, Khani S, Omidi Y. Rapid and simple methodology for isolation of high quality genomic DNA from coniferous tissues (Taxus baccata). Mol Biol Rep, 2010; 37(2):833–7. CrossRef
Brunakova K, Babincovaz Z, Takac M, Cellarova E. Selection of callus cultures of Taxus baccata L. as a potential source of paclitaxel production. Eng Life Sci, 2004; 4(5):465–9. CrossRef
Collins D, Mill RR, Moller M. Species separation of T. baccata, T. canadensis and T. cuspidata (Taxaceae) and origins of their reputed hybrids interfered from RAPD and cp-DNA data. Am J Bot, 2003; 90:175–82. CrossRef
Dalila ZD, Jaafar H, Manaf AA. Effects of 2,4-D and kinetin on callus induction of Barringtonia racemosa leaf and endosperm explants in different types of basal media. Asian J Plant Sci, 2013; 12(1):21–7. CrossRef
Das K, Dang R, Ghanshala N, Tajasekharan PE. Phytochemical investigations of in vitro propagated plant Taxus wallichiana Zucc. an endangered anticancer medicinal plant of Indian origin. Ann Phytomed, 2015; 4(2):59–66.
Datta MM, Jha S. Plant regeneration through somatic embryogenesis in Taxus wallichiana. J Plant Biochem Biotechnol, 2008; 17(1):37–44. CrossRef
Datta MM, Majumder A, Jha S. Organogenesis and plant regeneration in Taxus wallichiana (Zucc.). Plant Cell Rep, 2006; 25(1):11–8. CrossRef
Dornenburg H, Knorr D. Strategies for the improvement of secondary metabolite production in plant cell cultures. Enzyme Microb Technol, 1995; 17:674–84. CrossRef
Duncan DR, Widholm JM. Measurements of viability suitable for plant tissue cultures. Methods Mol Biol, 1990; 6:29–37. CrossRef
Ghassempour A, Rezadoost H, Ahmadi M, Aboul-Enein HY. Season’s study of four important taxanes and purification of 10-DAB III from the needles of Taxus baccata L. by two dimensional liquid chromatography. J Liq Chromatogr Relat Technol, 2009; 32(10):1434–47. CrossRef
Gibson DM, Ketchum REB, Vance NC, Christen AA. Initiation and growth of cell lines of Taxus brevifolia (Pacific Yew). Plant Cell Rep, 1993; 12(9):479–82. CrossRef
Glowniak K, Mroczek T. Investigations on preparative thin-layer chromatographic separation of Taxoids from Taxus baccata L. J Liq Chromatogr Relat Technol, 1999; 22(16):2483–502. CrossRef
Guo Y, Zhang Z. Establishment and plant regeneration of somatic embryogenic cell suspension cultures of the Zingiber officinale Rosc. Sci Hortic, 2005; 107:90–6. CrossRef
Hilfiker K, Holderegger R, Rotach P, Gugerli F. Dynamics of genetic variation in Taxus baccata: local versus regional perspectives. Can J Bot, 2004; 82(2):219–27. CrossRef
Hussain A, Qarshi IA, Nazir H, Ullah I, Rashid M, Shinwari ZK. In vitro callogenesis and organogenesis in Taxus wallichiana Zucc. The Himalayan Yew. Pak J Bot, 2013; 45(5):1755–9.
IUCN. 2016. IUCN red list. Available via http://www.iucnredlist.org/details/summary/46171879/0. (Accessed 27 March 2017).
Jha S, Sanyal D, Ghosh B, Jha TB. Improved Taxol yield in cell suspension culture of Taxus wallichiana (Himalayan Yew). Planta Med, 1998; 64(3):270–2. CrossRef
Karimian R, Lahouti M, Davarpanah SJ. Effects of different concentrations of 2,4-D and kinetin on callogenesis of Taxus brevifolia Nutt. J Appl Biotechnol Rep, 2014; 1(4):167–70.
Ketchum REB, Gibson DM, Gallo LG. Media optimization for maximum biomass production in cell cultures of pacific yew. Plant Cell Tissue Organ Cult, 1995; 42:185–93. CrossRef
Khosroushahi AY, Valizadeh M, Ghasempour A, Khosrowshahli M, Naghdibadi H, Dadpour MR, Omidi Y. Improved Taxol production by combination of inducing factors in suspension cell culture of Taxus baccata. Cell Biol Int, 2006; 30(3):262–9. CrossRef
Lee DH, Kim SG, Mun S, Kim JH. Evaluation of feeding and mixing conditions for fractional precipitation of paclitaxel from plant cell cultures. Process Biochem, 2010; 45(7):1134–40. CrossRef
Li D, Fu D, Zhang Y, Ma X, Gao L, Wang X, Zhou D, Zhao K. Isolation, purification, and dentification of Taxol and related Taxanes from Taxol-producing fungus Aspergillus niger subsp. taxi. J Microbiol Biotechnol, 2017; 27(8):1379–85. CrossRef
Li XL, Yu XM, Guo WL, Li YD, Liu XD, Wang NN, Liu B. Genomic diversity within Taxus cuspidata var. nana revealed by random amplified polymorphic DNA markers. Russ J Plant Physiol, 2006; 53(5):684–8. CrossRef
Liu K, Ding X, Deng B, Chen W. Isolation and characterization of endophytic taxol producing fungi from Taxus chinensis. J Ind Microbiol Biotechnol, 2009; 36(9):1171–7. CrossRef
Mahdinejad N, Fakheri BA, Ghanbari S. Effects of growth regulators on in vitro callogenesis of Taxus baccata L. Biol Forum Int J, 2015; 7(1):142–5.
Migas P, Switka M. TLC with an adsorbent gradient for the analysis of Taxol in Taxus baccata L. J Planar Chromatogr Mod TLC, 2010; 23(4):286–8. CrossRef
Rao RS, Ravishankar GA. Plant cell cultures: chemical factories of secondary metabolites. Biotechnol Adv, 2002; 20(2):101–53. CrossRef
Reflini. Evaluation of 2,4-D and NAA concentrations for callus and somatic embryos formation in oil palm. J Adv Agric Technol, 2017; 4(3):215–8. CrossRef
Saikia M, Shrivastava K, Singh SK. Effect of culture media and growth hormones on callus induction in Aquilaria malaccensis Lam., a medicinally and commercially important tree species of North East India. Asian J Biol Sci, 2013; 6(2):96–105. CrossRef
Sato K, Nakayama M, Shigeta J. Culturing conditions affecting the production of anthocyanin in suspended cell cultures of strawberry. Plant Sci, 1996; 113(1):91–8. CrossRef
See KS, Bhatt A, Keng CL. Effect of sucrose and methyl jasmonate on biomass and anthocyanin production in cell suspension culture of Melastoma malabathricum. Int J Trop Biol, 2011; 59(2):597–606.
Shah A, Li DZ, Gao LM, Li HT, Moller M. Genetic diversity within and among populations of the endangered species Taxus fuana (Taxaceae) from Pakistan and implications for its conservation. Biochem Syst Ecol, 2008; 36(3):183–93. CrossRef
Sharma N, Gauchan DP, Dhakal A, Luitel A, Shakya S, Shakya R. Establishment of regenerative callus, cell suspension system and molecular characterization of Stevia rebaudiana Bertoni for the production of stevioside in in vitro. Int J Res Appl Sci Eng Technol, 2015; 3(3):133–48.
Shi SY, Zhou CS. Determination of paclitaxel in southern yew tree by HPLC. J Cent South Univ Technol, 2003; 10(3):207–10. CrossRef
Svenning JC, Magard E. Population ecology and conservation status of the last natural population of English Yew, Taxus baccata in Denmark. Biol Conserv, 1999; 88(2):173–82. CrossRef
Syklowska-Baranek K, Furmanowa M. Taxane production in suspension culture of Taxus media var. Hicksii carried out in flasks and bioreactor. Biotechnol Lett, 2005; 27(17):1301–4. CrossRef
Toulabi SB, Moieni A, Ghanati F, Emami F. Investigation of the effects of the basal medium, auxin and antioxidants on the induction and maintenance of callus and Taxol production in Yew (Taxus baccata). J Adv Biol Biotechnol, 2015; 3(2):58–67. CrossRef
Virk PS, Zhu J, Newbury JH, Bryan GJ, Jackson MT, Ford-Llyod BV. Effectiveness of different classes of molecular marker for classifying and revealing variation in rice (Oryza sativa) germplasm. Euphytica, 2000; 112:275–84. CrossRef
Williams JGK, Kubelik AR, Livak KJ, Rafalski JA, Tingy SV. DNA polymorphisms ampliï¬ed by arbitrary primers are useful as genetic markers. Nucleic Acids Res, 1990; 18(22):6531–5. CrossRef
Yukimune Y, Tabata H, Higashi H, Hara Y. Methyl jasmonate induced overproduction of paclitaxel and baccatin III in Taxus cell suspension cultures. Nat Biotechnol, 1996; 14(9):1129–32. CrossRef
Zaiyou J, Li M, Xiqiao H. An endophytic fungus efficiently producing paclitaxel isolated from Taxus wallichiana var. mairei. Medicine (Baltimore), 2017; 96(27):e7406. CrossRef
Zamani S, Abbasian Z, Khaksar G, Movahedi S, Talebi M, Tabatabaei BES. Genomic diversity among yew (Taxus baccata L), genotypes of Iran revealed by random amplified polymorphism DNA markers. Int J Agric Biol, 2008; 10(6):648–52.
Zarek M. Preliminary studies on the molecular identification of sex in Taxus baccata L. For Res Pap, 2016; 77(1):68–75. CrossRef
Zheng MY, Konzak CF. Effect of 2,4-dichlorophenoxyacetic acid on callus induction and plant regeneration in anther culture of wheat (Triticum aestivum L.). Plant Cell Rep, 1999; 19(1):69–73. CrossRef