
INTRODUCTION
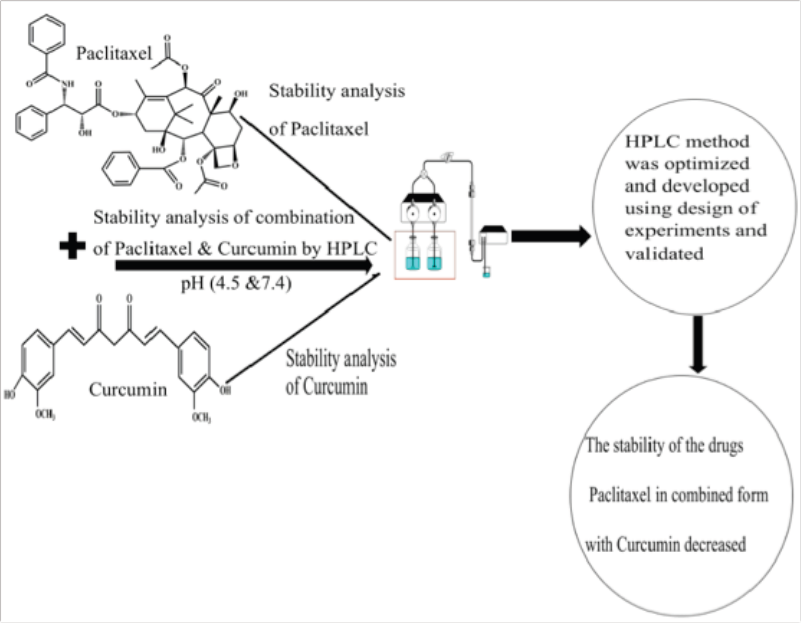
Paclitaxel and curcumin are considered to possess anticancer properties (Robles et al., 2016; Schwab et al., 2014). Various preclinical studies were carried out to find the synergistic effect of paclitaxel with curcumin in the treatment of cancer (Aggarwal et al., 2005; Banerjee et al., 2010). U.S. National Cancer Institute-funded “Developmental Therapeutic” screening program discovered paclitaxel at 1962 by isolating it from the bark of the Pacific yew also known as Taxus brevifolia (Weaver, 2014). Paclitaxel acts on stabilization of microtubules by preventing their depolymerization process which halts or slows down the cell division and induces cell death (Fu et al., 2009; Okano and Rustgi, 2001; Zhang et al., 2014). Although paclitaxel is considered to be an efficient anticancer drug, there is mounting evidence from researchers that paclitaxel induces the activation of Nuclear Factor Kappa-light-chain-enhancer of activated B cells (NF-κB) and upregulates efflux pump proteins which become the major reason for multidrug resistance in cancer cells (Wei et al., 2017). Recent studies show that curcumin, a phytochemical extracted from curcuma longa perennial herb, inhibits the NF-κB by downregulating the Inhibitor of Nuclear Factor Kappa-B Kinase Subunit Beta (IKKβ) which interrupts the cancer cell growth and induce apoptosis (Tang et al., 2002; Yallapu et al., 2012). The use of curcumin with paclitaxel can help to improve its therapeutic efficiency during the course of treatment (Sreekanth et al., 2011; Zhou et al., 2015). Although they have a good therapeutic effect for cancer, both paclitaxel and curcumin are associated with poor solubility and low bioavailability and rapid clearance of the drugs (Boztas et al., 2013) from the system. There are many methods to improve the bioavailability of hydrophobic drugs; one such approach is the use of polymeric nanoparticles as the drug delivery vehicle (Paramera et al., 2011). Testing the stability of the particular drug in the presence of other drugs plays a major role in the combination of drug treatment. The main aim of performing stability analysis is to analyze the quality of the drug and their degradation pattern in the presence of other drugs, with respect to time, temperature, and at different pH conditions. Analyzing the stability of the drugs in combined form gives us an insight into the treatment period, storage conditions, and shelf life (Naidu et al., 2005). Many stability indicating methods (Bajaj et al., 2012) have been reported in the literature for various combinations of drugs (Nalaiya et al., 2014; Subramanian et al., 2020) but none of the literature has reported the stability analysis of paclitaxel and curcumin in a combined form through Reverse Phase High Performance liquid chromatography (RP-HPLC).
The main objective of this work is to find out the stability of paclitaxel in presence of curcumin. To achieve this, we have developed a RP-HPLC method to analyze paclitaxel and curcumin together and optimized the method using optimization technique. The developed method was validated according to International Conference on Harmonization (ICH) guidelines and used to analyze the amount of drug (paclitaxel and curcumin together) loaded in the nano-formulation. RP-HPLC method developed gives a precise and accurate estimation of the drugs.
The method development stage should include all the parameters such as solubility of the sample, mobile phase, type of column, wavelength, pH, and concentration of the mobile phase. Choosing the right parameter with respect to the HPLC method will always result in a good outcome (Kaushal and Srivastava, 2010; Siddiqui et al., 2017). Developing appropriate HPLC conditions for a combination of drugs by conventional trial and error method makes the work more complicated and takes a considerable amount of time. Quality by design (QbD) is the method that utilizes the interaction effect of the combination of independent variables to acquire ideal chromatographic conditions by employing it in the design of experiments (DoE) (ICH, 2009). Many researchers have used the QbD method for optimization of various drugs in single and in combination form (Hasnain et al., 2017; Mukthinuthalapati et al., 2019; Panda et al., 2016; Yadav et al., 2016). Thus, the approach of QbD was used for the optimization procedure. Box–Behnken experimental design (BBD) is a response surface method implemented to find the main interaction and quadratic effects of the independent parameters on chromatographic responses. Figure 1A and B shows the chemical structure of the drugs paclitaxel and curcumin.
MATERIALS AND METHODS
Instruments
SHIMADZU (Model No LC-20AD, JAPAN) HPLC system attached with Auto-injector (Model No SPD- 20A, JAPAN) and UV detector (Model No SPD-20A, JAPAN), LC solution software was used to record and integrate chromatograms. The stationary phase column used for the analysis was Phenomenex Luna C18, 4.6 × 150 mm, 5 ¼m, 100Aâ—¦ (Model No 00F-4252-E0, USA). Q Sonica Ultrasonication device (Model No Q -700, Newtown, CT); SHIMADZU Electronic balance (Model No AUW 220D, JAPAN); Ultra Bath Sonicator (Model No XUBA1, Grant Instruments, Cambridge, UK); Magnetic stirrer (Model No SLK6, SCHOTT Instrument GmbH, Mainz, GERMANY) were used in this research.
Software and statistical data analysis
The chromatographs were processed using Shimadzu’s LC Solutions software. Design expert 11 trial version was used to design the experiments. Percentage relative standard deviation (%RSD) and the linear regression analysis were calculated using the method of least squares.
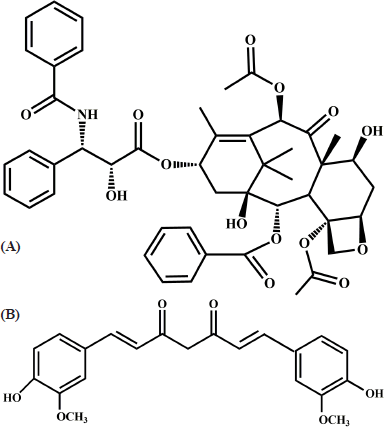 | Figure 1. Chemical structure of (A) Paclitaxel (B) Curcumin. [Click here to view] |
Materials and reagents
HPLC grade organic solvent Methanol (Catalogue (CAT) No: 60600725001730) was obtained from Merck life science private limited, Mumbai, India; Paclitaxel (Mw 853.91, CAT No: NFA-019) was obtained from Xi’an Natural field Bio-Technique co., Ltd, China; Curcumin (Mw 368.38, CAT No: B21573) was obtained from Alfa Aesar Mumbai, India; Phosphoric acid (CAT No: 05063) was obtained from Lobo Chemie, Mumbai, India; Poly(lactic-co-glycolic acid) (PLGA) 50:50 (MW: 1,00,000-1,20,000 Da, CAT No: B6010-4P) was procured from Durect corporation Birmingham, AL; Polyvinyl alcohol (PVA; molecular weight 1,25,000, CAT No: 130086) was obtained from Thomas Baker, Mumbai, India.
Method development considerations
To develop an RP-HPLC method, the physicochemical characteristics of the analytes (solubility, polarity, wavelength, etc.) were studied. Two stationary phases (C8 & C18) were kept under for consideration, stationary phase was chosen as C18 due to its high hydrophobic nature which helps in strong retention of hydrophobic analytes.
Preparation of mobile phase
As mentioned earlier, selection of the mobile phase was based on the polarity of the sample, availability of the solvents, proper retention time (RT), the sensitivity of the assay, and a short run time of the sample (Hakkimane et al., 2017).
Chromatographic conditions
The mobile phase used for this study was methanol with 0.05% of phosphoric acid as solvent (organic phase) and MilliQ Water with 0.05% of phosphoric acid (aqueous phase). The solvents used for the analysis were filtered using a 0.45 ¼m membrane filter and degassed through an ultra-bath sonicator. Phenomenex Luna C18, 4.6 × 150 mm, 5 ¼m, 100Aâ—¦ was used as the stationary phase. The analysis was carried out in isocratic conditions with 0.8 ml minutes−1 flowrate with an injection volume of 20 ¼l. The wavelengths of the detectors used were 227 nm and 370 nm for paclitaxel and curcumin, respectively.
Preparation of standard stock solutions
About 20 mg of paclitaxel/curcumin was accurately weighed and dissolved in 10 ml of methanol to make a concentration of 2 mg/ml. From that 1 mg/ml concentration was made and stored as stock solution. Further concentrations (0.1, 1, 10, 40, 60, 80, and 100) ¼g/ml were made by serial dilution to prepare the standard plot.
Design of experiment using BBD
The optimization of the RP-HPLC method was implemented using Box–Behnken design. Three parameters (Independent variables) concentration (%) of organic phase (A), % buffer concentration (B) and flow rate (minute/ml) (C) at three different levels low (−1), medium (0), and high (+1) were implemented to find the optimum combination and is represented in Table 1. The design comprised of fifteen experimental runs, a standard concentration (paclitaxel and curcumin) 10 ¼g/ml was used for all fifteen experimental runs, which were analyzed for the BBD method. The chromatographic responses like retention time of curcumin [R t(CUR)], the retention time of paclitaxcel [Rt (PTX)], the peak height of curcumin, the peak height of paclitaxel Peak height (PTX), area % of curcumin, area % of paclitaxel, resolution of the peak (Rs), and total analysis time (T) were studied and shown in Table 2.
Optimization and model validation
Design expert 11 trial version was used for optimization and model validation. The quadratic polynomial equations were framed from the statistical significance of coefficients of both the main effects and interaction effects. The aptness of the designed model was validated by analyzing parameters like the coefficient of correlation (R2), adjusted (R2), and adequate precision. The possible interaction effect of the chosen factors was studied from the response surface plot, contour plot, and perturbation plot. The optimum chromatographic conditions were selected based on short analysis time, peak elution time being in range, and percentage area of the peak. Derringer’s desirability function and Design space plot was carried out to show the optimum chromatographic conditions.
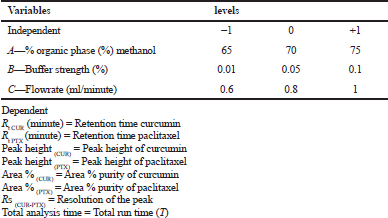 | Table 1. Box-Behnken design table incorporated with independent experimental variables and levels(coded). [Click here to view] |
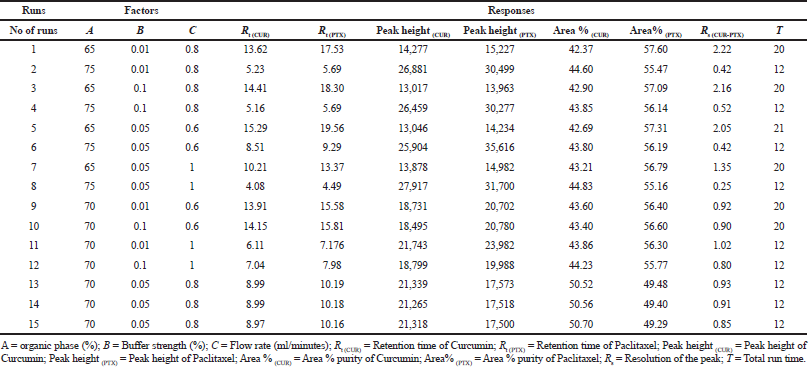 | Table 2. Chromatographic response and measured response values for BBD. [Click here to view] |
Validation of the method
The RP-HPLC method developed for this study was validated according to the ICH guidelines (ICH, 2005). Linearity, Specificity, precision (repeatability), the limit of detection and quantitation of paclitaxel and curcumin in combined form was evaluated using the optimized RP-HPLC method.
Linearity
ICH states linearity as the ability to acquire test results of the dependent variable data being directly proportional to the sample concentration. It is mandatory to analyze within an appropriate range for which the response of the instrument should be proportional to the concentration of the drug (Krier et al., 2011; Sharma et al., 2020). Normally, the value of co-relation coefficient (R2) >0.998 is acceptable. The standard solutions of the combination of drugs paclitaxel and curcumin were prepared by diluting the stock solution (1 mg/ml) with methanol. The concentration of standard solutions ranged from 0.1 to 100 ¼g/ml were analyzed and plotted with peak area value with respect to the concentration of the drug. The linearity was estimated by linear regression analysis which was calculated through the method of least squares.
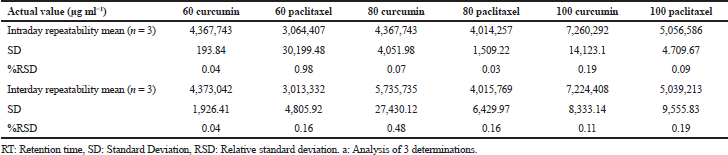
Precision
Precision is estimated normally with three parameters: repeatability, intermediate precision, and reproducibility. ICH allows exclusion of intermediate precision, provided if the results of reproducibility are proven very well. Three different concentrations (60, 80, and 100 μg/ml) of a combination of paclitaxel and curcumin were analyzed for their intra‑ and inter‑day precision using the optimized method. Standard Deviation (SD) and %RSD values were also calculated.
Specificity
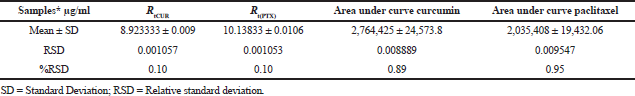
ICH defines specificity as the efficiency to measure unequivocally the analyte even in the presence of other components (Shaalan et al., 2013). Test for specificity was carried out by analyzing six replicates of a combination of paclitaxel and curcumin (40 μg/ml) drug standards proceeded with a calculation of %RSD and SD of the peak RT.
System suitability
System suitability test was carried out to confirm that RP-HPLC system and the developed method are acceptable for the analysis. The RP-HPLC system was stabilized for 45 minutes with the developed method followed by a blank run. Six replicates of paclitaxel and curcumin together of known concentration (40 ¼g/ml) were injected to find the suitability of the developed method. The criteria for testing system suitability include %RSD of peak area (Moorthi and Kathiresan, 2013).
Limit of detection and limit of quantitation
Limit of detection defines the ability to detect the lowest concentration of the analyte from the sample where quantitation is not needed under certain conditions. Limit of quantitation deals with the quantitation of the lowest concentration of the analyte in the sample with precision and accuracy. It is estimated through the slope and SD of the response (Veeragoni et al., 2016). The method was validated by analyzing 6 replicates of a combination of paclitaxel and curcumin drug standard (40 ¼g/ml) and the Limit of Detection (LOD) and Limit of Quantitation (LOQ) was calculated
LOD = 3.3 σ/s and LOQ = 10 σ/s
Where = the SD of the response & S= the slope.
Application of the optimized method in stability analysis and in nano-formulations
The optimized and validated RP-HPLC method for the combination of the Drugs paclitaxel and curcumin were used to find the stability of the drugs in combined form and to find the amount of drug loaded in the polymeric nano-formulation.
Combination of paclitaxel and curcumin stability analysis
About 1 mg of both the drugs were weighed accurately and dissolved in 1 ml of Phosphate Buffer saline (PBS) (4.5 & 7.4 pH) and kept in a rotating shaker for 24 hours at 37°C. The samples were centrifuged at 10,000 rpm and the supernatant was taken as samples and they were analyzed through RP-HPLC using the validated method for a time period of 48 hours.
Preparation and analysis of curcumin and paclitaxel in nano-formulation
Curcumin and paclitaxel together in nano-formulation were prepared using the single emulsion solvent evaporation method as described earlier (Hakkimane et al., 2018). Briefly, PLGA 90 mg and the drugs paclitaxel and curcumin 22.5 mg each (total quantity of drugs 45 mg) was weighed and dissolved in 1.8 ml of chloroform. The Polymer-Drug ratio 2:1 was maintained. Emulsification (oil-in-water) of the polymer-drugs solution was carried out with 12 ml of 2 % w/v aqueous PVA using probe sonication with 60% amplitude for 8 minutes under 4°C ice bath which was followed by overnight solvent evaporation to remove the chloroform. Repetitive centrifugation wash (four times) at 13,000 rpm at 4°C for 45 minutes was done to remove the PVA. The formed nanoparticle pellet was dispersed in 5–7 ml of deionized water and lyophilized for 48 hours to acquire the powder form of nanoparticles. To find the amount of drug loaded in the nanoparticle, HPLC analysis was performed using an optimized and validated method. The nanoparticles samples were accurately weighed in triplicates (1 mg) followed by the addition of the methanol and placed on a rocker shaker for about 2 days. The samples were centrifuged at 10,000 rpm for about 20 minutes and the supernatant containing the dissolved drug was collected and subjected to the RP-HPLC method to find the amount of paclitaxel and curcumin loaded in 1 mg of the nanoparticle.
RESULTS AND DISCUSSION
Simultaneous estimation of paclitaxel and curcumin RP-HPLC method optimization and validation
The total fifteen experimental runs designed using BBD were analyzed for their chromatographic response. The chromatograms obtained from the above mentioned fifteen runs are given in the Supplementary Information S1a–o. Table 3 is provided with the statistical parameters from the analysis of variance (ANOVA). The probability p lies below < 0.05 for most of the chromatographic responses and the correlation coefficient and adjusted R2 values were found to be high which infers the model chosen is significant. Both the main and the interaction effect are studied using the full quadratic equations which are shown [Eq. (1–8)] where A: % organic phase, B: buffer strength (%) and C: flow rate (ml minute−1). The positive and negative values in the quadratic equation symbolize the positive and converse effects of the independent parameters and experimental response. From the equations, buffer strength (B) has positive effects on Rt (CUR), Rt (PTX), Peak Height(CUR) & Area% (CUR), Organic phase (A) shows favorable response on Peak Height(CU) & Area% (CUR), while flow rate (C) shows a positive effect on Peak Height (CUR) & Area% (CUR). Supplementary Information S2a–h explains how independent variable levels have an impact on chromatographic responses through perturbation plots.
Rt (CUR) = 74 − 0.37 A + 46 B − 51.9 C − 0.0033 A2 + 338 B2 + 15.5 C2 − 1.23 AB + 0.162 AC + 10.7 BC (1)
Rt (PTX) = 290 − 5.96 A + 39 B − 68.4 C + 0.0333 A2 + 383 B2 + 16.7 C2 − 1.17 AB + 0.346 AC + 8.0 BC (2)
Peak Height (CUR) = 112783 + 2174 A + 32948 B + 23822 C − 8.09 A2 − 439507 B2 − 22970 C2 + 873 AB + 295 AC − 74038 BC (3)
Peak height (PTX) = 632981 – 19012 A – 48968 B – 22842 C + 154.6 A2 + 585306 B2 + 68427 C2 + 751 AB − 1166 AC − 103742 BC (4)
Area % (PTX) = 732.3 + 20.568 A + 278.0 B + 124.30 C − 0.14607 A2 − 1755.5 B2 − 82.73 C2 − 1.386 AB + 0.1275 AC + 15.03 BC (5)
Area% (CUR) = 829.7 − 20.495 A − 270.0 B − 124.92 C + 0.14560 A2 + 1773.7 B2 + 83.31 C2 + 1.283 AB − 0.1275 − 19.20 BC (6)
Rs (CU-PTX) = 79.1 − 2.029 A − 19.7 B − 2.41 C + 0.01260 A2 + 56.5 B2 − 4.91 C2 + 0.132 AB + 0.1310 AC + 6.02 BC (7)
T = 545 − 12.93 A – 89 B − 111.9 C + 0.0850 A2 + 938 B2 + 53.1 C2 + 0.06 AB + 0.25 AC− 23 BC (8)
The interaction effect of the independent variables on chromatographic response is studied using three-dimensional response surface plots. Figure 2 shows the effect of the organic phase and buffer strength, Figure 3 shows the effect of the organic phase and flow rate, while Figure 4 shows the effect of buffer strength and flow rate. The interaction effect studied using contour plots are given in Supplementary Information S3a–h, S4a–h & S5a–h.
Optimization
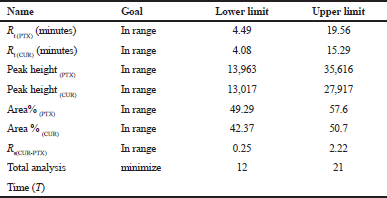
Peak separation within range of all parameters and with short run time is the main criteria for optimization. According to the literature (Mukthinuthalapati et al., 2019) Derringer’s desirability function, D value nearly 1 indicates that the obtained chromatographic response values are close to the target value. Table 4 shows the criteria for optimization. The criteria are selected based on short analysis time, peak elution time being in range and Percentage Area of the peak. By following the conditions based on the selected criteria, the optimization procedure was conducted. Figure 5 shows the desirability of chromatographic response at the optimized conditions showing the D value 1 confirms the optimized method is in the desirability range. The desirability ramp for the optimized condition with limits and criteria are shown in Supplementary Information S6. Figure 6 indicates that the optimized method is within the range of Design space.
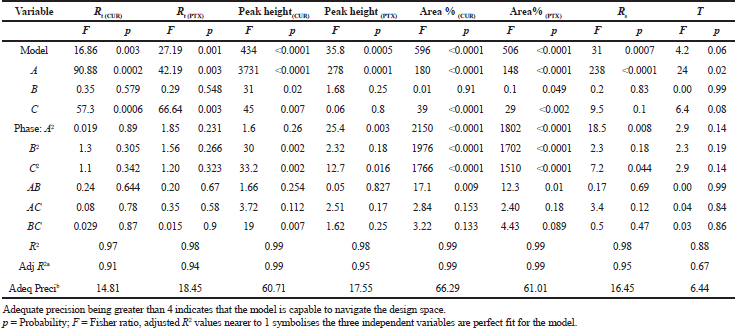 | Table 3. ANOVA for the Chromatographic Responses [Click here to view] |
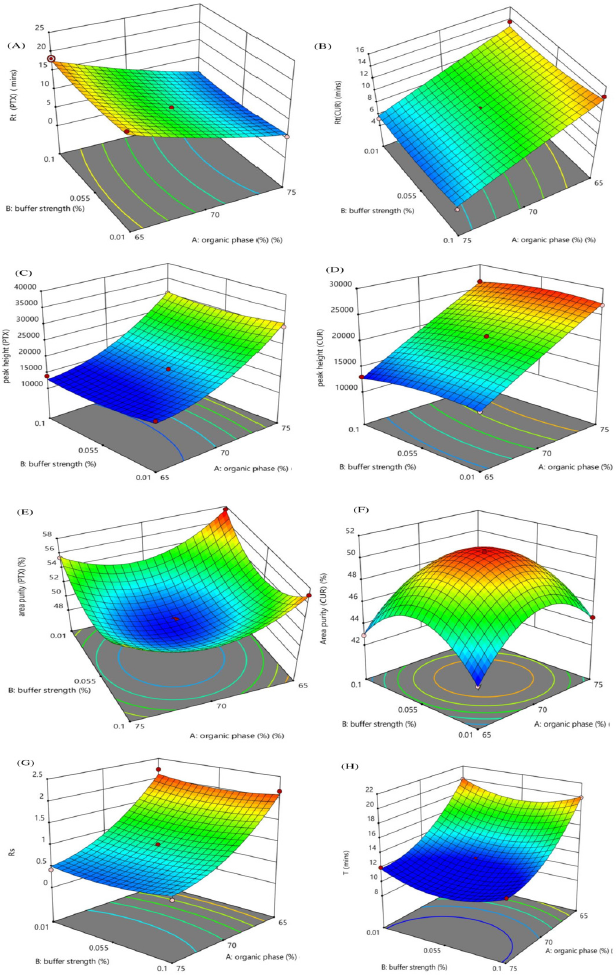 | Figure 2. Response surface plots showing the impact of % Organic phase and buffer strength % on (A) Rt (PTX) (minute), (B) RtCUR (minute), (C) Peak height (PTX), (D) Peak height (CUR), (E) Area % (PTX), (F) Area % (CUR), (G) Rs (CUR-PTX), (H) Total analysis time (T). [Click here to view] |
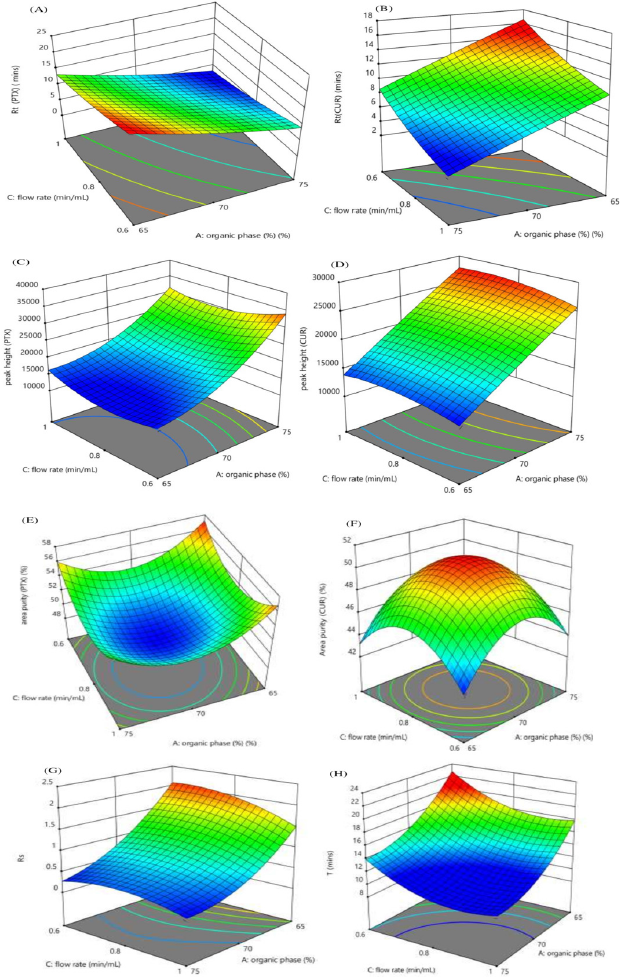 | Figure 3. Response surface plots showing the impact of % organic phase and flow rate (minute/ml) on (A) Rt (PTX) (minute), (B) Rt (CUR) (minute), (C) Peak height (PTX), (D) Peak height (CUR), (E) Area % (PTX), (F) Area % (CUR), (G) Rs(CUR-PTX), (H) Total analysis time (T). [Click here to view] |
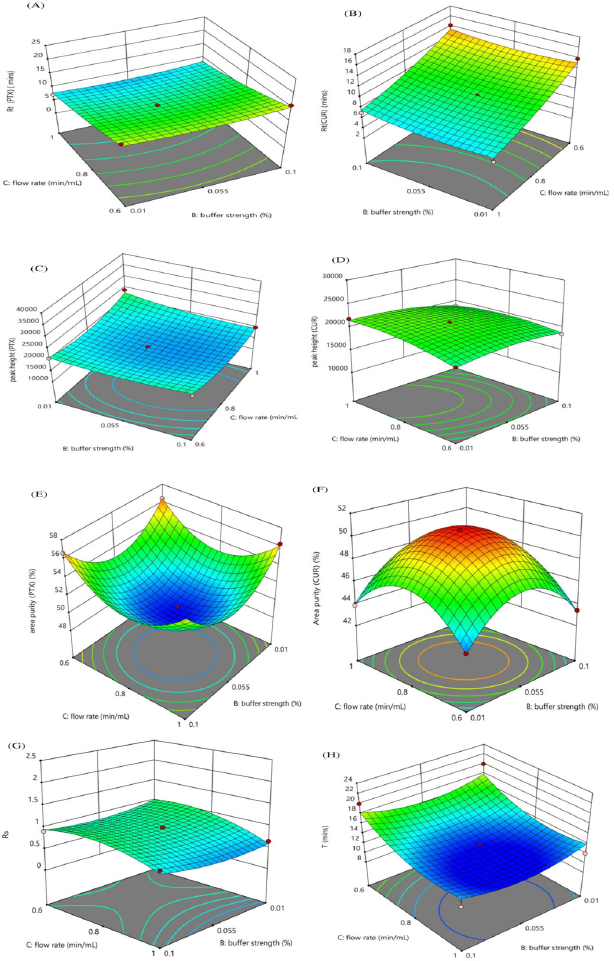 | Figure 4. Response surface plots showing the impact of buffer strength % and Flow rate (minute/ml) on (A) Rt (PTX) (minute), (B) Rt (CUR) (minute), (C) Peak height (PTX), (D) Peak height (CUR), (E) Area % (PTX), (F) Area % (CUR), (G) Rs (CUR-PTX), (H) Total analysis time (T). [Click here to view] |
 | Table 4. Desirability criteria. [Click here to view] |
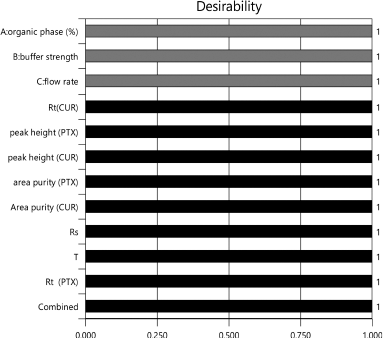 | Figure 5. Desirability bar graph of responses for optimized chromatographic condition. [Click here to view] |
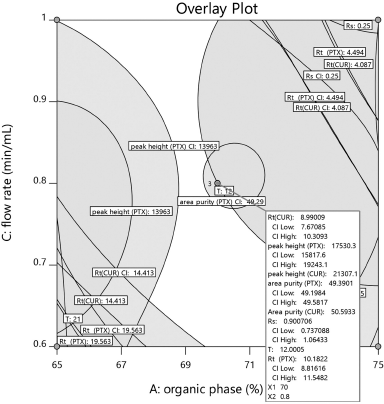 | Figure 6. The design space of the optimized method. [Click here to view] |
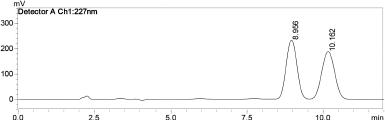 | Figure 7. HPLC peak of simultaneous estimation of curcumin and paclitaxel 100 ¼g/ml RT 8.9 for curcumin 10.1 for paclitaxel respectively. [Click here to view] |
 | Table 5. Calibration results. [Click here to view] |
 | Table 6. Intra and inter day precision of RP HPLC method for Combination of Drugs [Click here to view] |
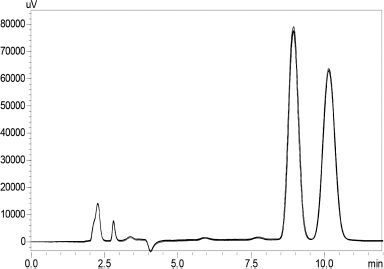
The optimized chromatographic condition for the chromatographic separations of the drugs paclitaxel and curcumin was achieved using reverse-phase phenomenex® Luna C18, 4.6* 150 mm, 5 μm, 100A° column. The drugs were eluted with a mobile phase consisting of methanol with 0.05% of O-phosphoric acid and Milliq water with 0.05% of O-phosphoric acid (70:30) at a flow rate of 0.8 ml/minutes. The drug curcumin eluted with a RT of 8.9 minutes which was detected at 370 nm, while paclitaxel eluted with a RT of 10.1 minutes which was detected at 227 nm. The chromatogram Figure 7 shows two distinct clear peaks with no additional peaks. The RP-HPLC method can segregate clearly at low concentrations as well as in mixture of compounds (Hakkimane et al., 2017).
Method validation
Linearity
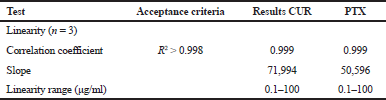
The linearity of the optimized RP-HPLC method for the combination of drugs paclitaxel and curcumin was established by plotting the area value of the chromatogram with respect to different concentrations ranging from 0.1 -100 ¼g/ml. Table 5 shows the R2 (correlation coefficient) of drugs paclitaxel and curcumin to be linear with a value of 0.999 exhibiting a good relationship between concentration range and peak area. Supplementary Information S7 shows chromatograms of different concentrations of paclitaxel and curcumin were having the same RT.
Precision
Analysis of the intra- and inter-day precision of the combination of paclitaxel and curcumin standards of three different concentrations (60,80 and 100 ¼g/m) revealed a %RSD value less than 1% inferring an acceptable level of precision for the developed method. Table 6 shows the intra and intermediate precision of the drug standards.
Specificity and system suitability
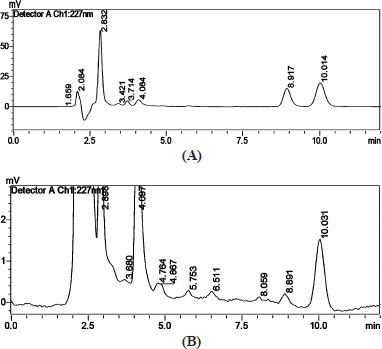
Analysis of specificity and system suitability studied with 6 replicates of a combination of paclitaxel and curcumin standard (40 ¼g/ml) shown in Figure 8 has clear separation of the drugs with no Supplementary peaks seen. Table 7 shows that the developed method was found to be reproducible with %RSD for the RT and the chromatogram area to be < 1 %.
LOD and LOQ
From the calculation, the lowest detectable concentration was found to be 1.02 & 1.1 ¼g for curcumin and paclitaxel respectively. But the experiment was conducted and analyzed using standard solutions from 0.1 to 100 ¼g/ml concentrations. The chromatogram of the lowest detectable concentration of 0.1 ¼g/ml is shown in Supplementary Information Figure S8. The limit of quantitation was found to be 3.41 and 3.84 ¼g for curcumin and paclitaxel respectively.
Combination of paclitaxel and curcumin stability analysis
The combination of the drug paclitaxel and curcumin’s stability indicating analysis was carried out to check how the drug behaves in combined form when it is induced in different pH conditions (4.5 & 7.4) with respect to time and temperature at 37°C. Studying the stability of the drugs gives an insight into the therapeutic dosage during in-vitro drug studies. The initial run (0th hour) of the samples showed two distinct intense peaks, which then decreased with the time period. Figure 9 shows the stability analysis peaks for a combination of drugs at 0th and 48th hour in 4.5 pH condition. Figure 10 shows the stability analysis peaks for a combination of drugs at 0th and 48th hour in 7.4 pH condition. The stability of the drugs was calculated in percentage using slope and was found approximately 8.7% of paclitaxel and 1.4% curcumin were stable at 4.5 pH and around 13% of paclitaxel and 2% of curcumin were stable at 7.4 pH at the end of 48 hours.
 | Figure 8. Replicates of curcumin & paclitaxel (40 ¼g/ml) showing specificity.. [Click here to view] |
The stability analysis of the single drug paclitaxel/curcumin was also conducted for a time period of 96 hours by using the optimized method, the data [Supplementary Information S9 (a–d) & S10 (a–d)] reveals that at 4.5 pH 62% of paclitaxel and 70% of curcumin were stable and at 7.4 pH around 19% of paclitaxel and 51% of curcumin were stable at the end of 96 hours. Batrawi et al. (2017) had shown that the combination of two antibiotic drugs under different pH conditions is stable and they do not degrade in presence of the other drug. But our results show that the stability of paclitaxel and curcumin in combination under different pH conditions decreased substantially compared to pure paclitaxel or curcumin in the same condition.
Drug loading analysis of combination of curcumin and paclitaxel nanoparticle by RP-HPLC
Curcumin and paclitaxel loaded nanoparticles were prepared using a single emulsion solvent evaporation with similar polymer-drug ratio and other experimental conditions as mentioned in (Hakkimane et al., 2018). The formulated nanoparticles were analyzed for their drug loading content using RP-HPLC with the help of the validated method. Table 8 represents the amount of the drug loaded per mg of nanoparticles. Around 101 ¼g of paclitaxel and 62 ¼g of curcumin were found to be loaded for every 1 mg of nanoparticles. This confirms the loading of the drugs into the nanoparticle was similar to the results obtained (Swaminathan et al., 2013).
 | Table 7. Specificity and system suitability. [Click here to view] |
 | Figure 9. Stability analysis of combination of drugs at (A) 0th and (B) 48th hour in 4.5 pH. [Click here to view] |
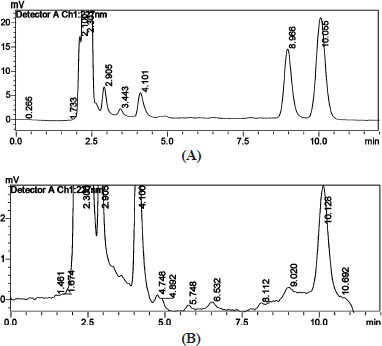 | Figure 10. Stability analysis of combination of drugs at (a) 0th and (b) 48th hour in 7.4 pH. [Click here to view] |
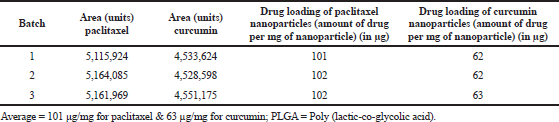 | Table 8. Drug loading of combination of paclitaxel and curcumin loaded PLGA nano formulation. [Click here to view] |
CONCLUSION
A simple RP-HPLC method for simultaneous estimation of paclitaxel and curcumin was developed and optimized. Optimization of the method for the combination of drugs by the conventional trial and error method would have been a tedious job. Design of Experiments (DOE) made it simpler with a minimum number of experiments. The applied BBD design gave more information about the interactional effect of the independent variables to accomplish the desired chromatographic response. The optimized RP-HPLC method developed for the simultaneous analysis of paclitaxel and curcumin was found to be simple, precise, and reproducible. The validation of the RP-HPLC method was carried out according to ICH guidelines. The absence of significant interfering peaks and lower %RSD values (<1%) shows that the developed method was sensitive. Considerable low LOD and LOQ values determine the method is suitable for quantifying and the detection of low concentrations of drugs. The method developed was effectively applied for the stability analysis of paclitaxel and curcumin in combined form. Results showed that the degradation of paclitaxel in presence of curcumin is faster. More research work on this area is needed to figure out the reason behind the fast degradation of paclitaxel in the presence of curcumin. The optimized method was used to analyze the drug loading content in polymeric nanoparticles. Hence the developed method can be implemented for the simultaneous analysis of paclitaxel and curcumin in pharmaceutical dosage forms in quality control.
AUTHOR’S CONTRIBUTION
The concept and design of this study was done by Dr Bharath Raja Guru & Joyceline Praveena. Acquisition of data, statistical analysis and manuscript writing was done by Joyceline Praveena. The acquired data analysis and the written manuscript was supervised and approved by Dr Bharath Raja Guru.
ACKNOWLEDGMENTS
We thank Department of Biotechnology, Manipal Institute of Technology, Manipal for the facility provided to conduct this research.
CONFLICT OF INTEREST
Authors declare no conflict of interest.
FUNDING
This work was partially funded by Vision Group of Science and Technology, Karnataka. The grant and the number is K-FIST LEVEL 1 GRD 267, awarded to Dr Bharath Raja Guru.
ETHICAL APPROVALS
This study does not involve experiments on animals or human subjects.
PUBLISHER’S NOTE
This journal remains neutral with regard to jurisdictional claims in published institutional affiliation.
REFERENCES
Aggarwal BB, Shishodia S, Takada Y, Banerjee S, Newman RA, Ramos CE, Price JE. Curcumin suppresses the paclitaxel-induced nuclear factor-kappaB pathway in breast cancer cells and inhibits lung metastasis of human breast cancer in nude mice. Clin Cancer Res, 2005; 11(20):7490–8. CrossRef
Bajaj S, Singla D, Sakhuja N. Stability testing of pharmaceutical products. J Appl Pharm Sci, 2012; 2(3):129–38.
Banerjee M, Singh P, Panda D. Curcumin suppresses the dynamic instability of microtubules, activates the mitotic checkpoint and induces apoptosis in MCF-7 cells. FEBS J, 2010; 277(16):3437–48. CrossRef
Batrawi N, Wahdan S, Al-Rimawi F. A validated stability-indicating HPLC method for simultaneous determination of amoxicillin and enrofloxacin combination in an injectable suspension. Sci Pharm, 2017; 85(1):6–14. CrossRef
Boztas AO, Karakuzu O, Galante G, Ugur Z, Kocabas F, Altuntas CZ, Yazaydin AO. Synergistic interaction of paclitaxel and curcumin with cyclodextrin polymer complexation in human cancer cells. Mol Pharm, 2013; 10(7):2676–83. CrossRef
Fu Y, Li S, Zu Y, Yang G, Yang Z, Luo M, Jiang S, Wink M, Efferth T. Medicinal chemistry of paclitaxel and its analogues. Curr Med Chem, 2009; 16(30):3966–85. CrossRef
Hakkimane SS, Guru BR. Nano formulation analysis: analytical method development of isoniazid and simultaneous estimation of antitubercular drugs isoniazid and rifampicin by reverse phase high pressure liquid chromatography. Asian J Pharm Clin Res, 2017; 10(5):330–35. CrossRef
Hakkimane SS, Shenoy VP, Gaonkar S, Bairy I, Guru BR. Antimycobacterial susceptibility evaluation of rifampicin and isoniazid benz-hydrazone in biodegradable polymeric nanoparticles against Mycobacterium tuberculosis H37Rv strain. Int J Nanomedicine, 2018; 13:4303–18. CrossRef
Hasnain MS, Ansari SA, Rao S, Tabish M, Singh M, Abdullah MS. QbD-driven development and validation of liquid chromatography tandem mass spectrometric method for the quantitation of sildenafil in human plasma. J Chromatogr Sci, 2017; 55:587–94. CrossRef
ICH, Q2R1, Validation of analytical procedures and methodology, 2005. Available via https://www.ich.org/page/quality-guidelines [Accessed 03 August 2020].
ICH. Q8(R2), Pharmaceutical development, 2009. Available via https://www.ich.org/page/quality-guidelines [Accessed 03 August 2020].
Kaushal KC, Srivastava B. A process of method development: a chromatographic approach. J Chem Pharm, 2010; 2(2):519–45.
Krier F, Brion M, Debrus B, Lebrun P, Driesen A, Ziemons E, Evrard B, Hubert P. Optimisation and validation of a fast HPLC method for the quantification of sulindac and its related impurities. J Pharm Biomed, 2011; 54(4):694–700. CrossRef
Moorthi C, Kathiresan K. Simultaneous estimation of curcumin and silibinin using validated RP-HPLC-PDA method and its application in pharmaceutical nanoformulation. Int J Pharm, 2013; 5(3):475–78.
Mukthinuthalapati MA, Bukkapatnam V, kallepalli P. Simultaneous determination of anti-diabetic drugs in their combined dosage forms using HPLC: an experimental design approach. J Chromatogr Sci, 2019; 57(4):339–48. CrossRef
Naidu RK, Kale UN, Shingare MS. Stability indicating RP-HPLC method for simultaneous determination of amlodipine and benazepril hydrochloride from their combination drug product. J Pharm Biomed, 2005; 39:147–55. CrossRef
Nalaiya J, Sagineedu SR, Rajasingam R, Kassim Z, Pichika MR. A stability-indicating RP-HPLC method for simultaneous determination of simvastatin and niacin in a combined dosage form. Int J Pharm Sci, 2014; 7(2):262–8.
Okano JI, Rustgi A. Paclitaxel induces prolonged activation of the ras/MEK/ERK pathway independently of activating the programmed cell death machinery. J Biol Chem, 2001; 276(22):19555–64. CrossRef
Panda SS, Ravi Kumar BV, Beg S, Sahu SK, Muni S. Development and validation of a stability-indicating liquid chromatographic method for estimating vilazodone hydrochloride in pharmaceutical dosage form using quality by design. J Chromatogr Sci, 2016; 54:1713–22. CrossRef
Paramera EI, Konteles SJ, Karathanos VT. Stability and release properties of curcumin encapsulated in saccharomyces cerevisiae, β-cyclodextrin and modified starch. Food Chem, 2011; 125:913–22. CrossRef
Robles EE, Das U, Ortega NM. A novel curcumin-like dienone induces apoptosis in triple-negative breast cancer cells. Cell Oncol, 2016; 39(3):265–77. CrossRef
Schwab CL, English DP, Roque DM, Santin AD. Taxanes: their impact on gynecologic malignancy. Anticancer Drugs, 2014; 25(5):522–35. CrossRef
Shaalan RA, Haggag RS, Belal SF, Agami M. Simultaneous determination of hyoscine, ketoprofen and ibuprofen in pharmaceutical formulations by HPLC-DAD. J Appl Pharm Sci, 2013; 3(7):38–47.
Sharma P, Narenderan ST, Meyyanathan SN, Sangamithra R, Sanjay MS, Babu B, Kalaivani M. A novel analytical liquid chromatography tandem mass spectrometry method for the estimation of ribavirin in bulk and pharmaceutical formulation. J Appl Pharm Sci, 2020; 10(1):096–100. CrossRef
Siddiqui MR, AlOthman ZA, Rahman N. Analytical techniques in pharmaceutical analysis: a review. Arab J Chem, 2017; 10:1409–21. CrossRef
Sreekanth CN, Bava SV, Sreekumar E, Anto RJ. Molecular evidences for the chemosensitizing efficacy of liposomal curcumin in paclitaxel chemotherapy in mouse models of cervical cancer. Oncogene, 2011; 30(28):3139-52. CrossRef
Subramanian G, Narenderan ST, Meyyanathan SN. Stability indicating RP-HPLC method for the simultaneous estimation of Quercetin and Rutin in bulk drug. Int J Res Pharm Sci, 2020; 11(1):1254–58. CrossRef
Swaminathan SK, Roger E, Toti U, Niu L, Ohlfest JR, Panyama J. CD133-targeted paclitaxel delivery inhibits local tumor recurrence in a mouse model of breast cancer. J Control Release, 2013; 171(3):280–87. CrossRef
Tang B, Ma L, Wang H, Zhang G. Study on the supramolecular interaction of curcumin and beta-cyclodextrin by spectrophotometry and its analytical application. J Agric Food Chem, 2002; 50(6):1355–61. CrossRef
Veeragoni AK, Vasudeva MS, Shoba RS, Manish KT. Stability indicating RP-HPLC method for the simultaneous estimation of pyrimethamine and sulphadoxine in bulk and tablet dosage form. J Appl Pharm Sci, 2016; 6(3):71–6.
Weaver BA. How taxol/paclitaxel kills cancer cells. Mol Biol Cell, 2014; 25(18):2677–81. CrossRef
Wei Y, Pu X, Zhao L. Preclinical studies for the combination of paclitaxel and curcumin in cancer therapy. Oncol Rep, 2017; 37(6):3159–66. CrossRef
Yadav NK, Raghuvanshi A, Sharma G, Beg S, Katare, OP, Nanda S. QbD-based development and validation of a stability-indicating HPLC method for estimating Ketoprofen in bulk drug and proniosomal vesicular system. J Chromatogr Sci, 2016; 54:377–89. CrossRef
Yallapu MM, Jaggi M, Chauhan SC. Curcumin nanoformulations: a future nanomedicine for cancer. Drug Discov Today, 2012; 17(1–2):71–80. CrossRef
Zhang D, Yang R, Wang S, Dong Z. Paclitaxel: new uses for an old drug. Drug Des Devel Ther, 2014; 8:279–84. CrossRef
Zhou M, Li Z, Han Z, Tian N. Paclitaxel-sensitization enhanced by curcumin involves down-regulation of nuclear factor-κB and Lin28 in Hep3B cells. J Recept Signal Transduct Res, 2015; 35(6):618–25. CrossRef
GRAPHICAL ABSTRACT
 | [Click here to view] |