INTRODUCTION
Polymeric nanocapsules have been recognized as promising drug carrier systems and the use of efavirenz (EFV)-loaded delivery systems is a suitable strategy for the treatment of acquired immunodeficiency syndrome, as these formulations can improve the dissolution profile, prolong the pharmacological effect, lead to a decrease in dosage, and, consequently, reduce side effects (Dimer et al., 2020; Lyra et al., 2017; Patel et al., 2013; Varshosaz et al., 2018). Nevertheless, the development of the nanodrug delivery systems requires previous and mandatory validation of an analytical method in order to provide an accurate determination of the drug loaded into the nanoformulation during the different stages of the pharmaceutical R&D process.
This validation process, according to international standards (ICH, 2005), involves several parameters for providing documented evidence that the method does what it is intended to do. In that sense, the advanced search carried out in indexed databases (Science Direct and Google Scholar) on May 10, 2020, using English language and title mode, was not reported considering the keywords “validation” and Ultra High-Performance Liquid Chromatography “UHPLC” (or as Waters calls it, “ultra performance liquid chromatography”) and “EFV” and “nanoparticles”. Concerning other pharmaceutical dosage forms, the literature shows only restricted data regarding the validation of UHPLC methods for quantifying EFV.
Induri et al. (2016) validated a UHPLC-photodiode array detector (DAD) method for simultaneous quantification of EFV and lamivudine in tablets using a mobile phase containing 10 mM phosphate buffer (pH = 4.0) and 10.0% acetonitrile in methanol. Sravanthi and Madhavi (2020) provided an analytical study concerning the validation of stability indicating the UHPLC-DAD procedure to determine emtricitabine, tenofovir, and EFV in tablets by using a mobile phase containing 0.01 N potassium dihydrogen phosphate buffer (pH = 4.5) and acetonitrile. Dos Santos Martins et al. (2020) reported a validation method for EFV determination in plasma by UHPLC-DAD. This method involved the addition of the plasma precipitation using acetonitrile and solvent evaporation. Methanol, acetonitrile, and 0.1 M formic acid were used as the mobile phase. Huang et al. (2011) used a UHPLC-mean squares (MS)/MS method for the determination of ritonavir, indinavir, atazanavir, and EFV in serum and tissues of mice. The formulations were obtained by wet-milling. The method was carried out using a gradient mobile phase containing 5.0% acetonitrile in methanol and 7.5 mM ammonium acetate (pH = 4.0). Acetonitrile was used as part of the mobile phase in these three first studies and this solvent has a higher financial cost than methanol (Gomes et al., 2015). In addition, the last paper employed tandem mass spectrometry for drug quantification, which is less available in routine analysis. Therefore, no paper is provided by literature regarding the validation of a UHPLC method to determine EFV in polymeric nanocapsules by a fast and simple UHPLC method.
Moreover, the method validation is essential to provide a suitable tool for further analyses concerning the encapsulation efficiency (EE) determination, the drug quantification during stability testing, and the dissolution studies. These R&D stages can be only carried out if a validated method is available (Camargo et al., 2020). Furthermore, the literature shows that the Brownian movement of the nanoparticles avoids sedimentation and flotation process (Sari et al., 2017). However, the colloidal suspensions can demonstrate nanoparticle aggregation over time (Carletto et al., 2016). Consequently, the physicochemical stability studies are also critical for expanding the knowledge about nanosystem stability (Schaffazick et al., 2003). In that sense, to the best of our knowledge, this is the first report about the stability of polymeric nanoformulations containing EFV.Taking all these into account, this study aimed to obtain EFV-loaded nanocapsules based on poly(ε-caprolactone) (PCL) and [poly(ethylene glycol) 6000] (PEG) and to describe the validation of a rapid UHPLC assay for the EFV determination in these formulations. The proposed method was developed to serve different purposes as EE determination, stability testing, and dissolution study in order to facilitate the pharmaceutical R&D routine.
MATERIALS AND METHODS
Materials
Efavirenz (EFV, 98.0% pure), PEG (Mw = 5,400–6,600 g/mol), and PCL (Mw =10,000–14,000 g/mol) were purchased from Sigma-Aldrich (St. Louis, MO). high performance liquid chromatography (HPLC)-grade methanol was provided by ApplyChem Panreac Química (Barcelona, Spain). Milli-Q Plus water purification system (Millipore, Bedford, MA) was used for collecting purified water. The other reagents and solvents were of analytical grade.
Equipment
Experiments were carried out in a Nexera X2 UHPLC system (Shimadzu, Kyoto, Japan), equipped with degasser (DGU-20A5RA), quaternary pump (LC-30AD), thermostatic column compartment (CTO-20AC), automatic sampler (SIL-30 AC), and a photodiode array detector (DAD) (SPD-M20A). The acquisition and processing of the data were obtained with the LabSolutions® Software version 5.73 (Shimadzu, Kyoto, Japan).
Preparation of stock and sample solutions
Stock solution containing EFV was obtained in methanol:water acidified with 0.15% acetic acid (87:13, v/v) at 500.0 μg/ml. Dilutions were carried out in order to obtain sample solutions with a concentration between 1.0 and 50.0 μg/ml, where the concentration of 15.0 μg/ml was defined as 100.0%. The sample solutions were filtered before injection using a polytetrafluoroethylene filter (Cromafil® Xtra, 0.2 μm × 13 mm, Macherey-Nagel, Düren, Germany).
Preparation of the polymeric nanocapsules
Nanocapsule suspensions were prepared in triplicate from PCL or PCL-PEG blend (3:1) by the interfacial deposition procedure using preformed polymer(s) as previously reported (Fessi et al., 1989; Rudnik et al., 2020) and depicted in Table 1. Briefly, the polymer or polymeric blend was solvated in acetone with sorbitan monooleate 80 (Span® 80), EFV, and triglycerides of capric/caprylic acids [middle chain triglycerides (MCT)]. This phase was dripped into the aqueous medium containing polysorbate 80 (Tween® 80) and water under vigorous magnetic stirring (Fisaton, 754A model, São Paulo, Brazil) at 40°C. The magnetic stirring was kept for 10 minutes and then the rotary evaporation (Fisaton, 803 model, São Paulo, Brazil) was carried out in order to obtain a final volume of 10 ml and a theoretical drug loading of 5 mg/ml. PCL-0 and PCL-PEG-0, suspension of nanoparticles with no EFV, were also obtained.
 | Table 1. Composition of polymeric nanocapsules. [Click here to view] |
UHPLC-DAD method development
Several chromatographic conditions were tested and defined by the authors during the method development. Different compositions, pH, and flow rates of the mobile phase were tested, as well as column temperature and detection wavelength.
UHPLC-DAD method validation
A C18 Shim-pack XR-ODS III reverse phase column (200 mm × 2 mm with a particle size of 2.2 μm, Shimadzu, Kyoto, Japan) coupled to the precolumn (C18 Shim-pack GVP-ODS, 10 mm × 4.6 mm, Shimadzu, Kyoto, Japan) was used for the method validation procedure. The injection volume was 5 μl and the elution was carried out in isocratic mode using methanol:water acidified with 0.15% acetic acid (87:13, v/v) as mobile phase with a flow of 0.500 ml/minutes at 40°C. The running time was 2 minutes and the wavelength chosen for EFV determination was 247 nm.
The analytical validation was carried out considering the guidelines published by the ICH (2005). Specificity, linearity, precision, accuracy, detection and quantification limits, and robustness were the assessed parameters.
The chromatograms of the EFV-loaded nanocapsules were compared to those obtained for formulations with no drug in order to investigate the method’s specificity. This analysis is critical to confirm that no component of the formulation interferes with the quantification of EFV.
The linearity was assessed by obtaining and analyzing three analytical curves. For this, seven concentrations levels of EFV were obtained from dilutions of the standard solution in the mobile phase (1.0, 5.0, 10.0, 15.0, 20.0, 25.0, and 50.0 μg.ml–1). The analysis of linear regression was carried out using the least squares method and the slope was tested by analysis of variance (ANOVA) at a significance level of 0.05.
The slope (S) and the standard deviation (SD) of the response of three analytical curves were used for determining the limits of detection (LOD) and quantification (LOQ) according to equations (1) and (2), respectively:
(Eq. 1)
. (Eq. 2)
Repeatability and intermediate precision were used for testing the method precision. Repeatability was achieved at the concentration theoretically defined as 100.0% (15 μg/ml) in sextuplicate. Intermediate precision was investigated in triplicate for three different concentrations at 3.0, 17.0, and 35.0 μg/ml. Repeatability and intermediate precision were assessed by SD and relative standard deviation (RSD) and analyzed intraday, inter-day, and with different analysts.
The recovery analysis in triplicate was used for determining the method’s accuracy. The amount of 10 μg was added to the sample solutions containing 3.0, 17.0, and 35.0 μg/ml. The accuracy (%) was calculated using:
(Eq. 3)
where CFS denotes the concentration of the experimentally fortified sample; CNFS denotes the concentration of the experimentally non-fortified sample; and TCA denotes the theoretical concentration added.
The robustness was determined in the samples at 15.0 μg/ml by providing variations in the flow rate (0.495 and 0.505 ml/minutes) and mobile phase [methanol:water acidified with 0.15% acetic acid 86:14 (v/v) and 88:12 (v/v)]. RSD values were used to study the effect of these changes on the standard chromatographic conditions.
Method applicability
Determination of encapsulation efficiency
The loaded drug in PCL-EFV and PCL-PEG-EFV nanocapsules was indirectly determined in triplicate. Each nanosuspension (500 μl) was submitted to ultrafiltration in an Amicon® device (Mw cutoff = 10,000 g.mol−1, Merck Millipore, Bedford, MA). EFV was quantified in ultrafiltrate by the aforementioned UHPLC method. Considering the EFV loading, the EE was obtained by.
(Eq. 4)
Stability testing
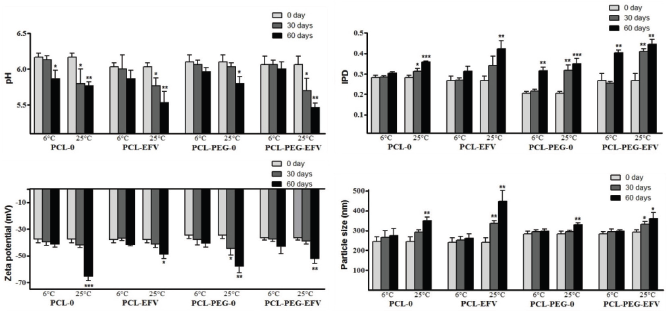
The nanosuspensions were maintained at 25°C ± 2°C (room temperature) and 6°C ± 2°C in amber glass bottles protected from light. The nanoformulations were checked at 30 and 60 days of storage. A digital potentiometer (Hanna, HI 2221 model, São Paulo, Brazil) was used for pH determination after the previous calibration. Analyses on the equipment Zetasizer Nanoseries (Malvern Instruments, NANO ZS 90 model, Malvern, UK) were carried out for the particle size determination, the polydispersity index (PDI) evaluation, and the zeta potential measurement. These assays were carried out after dilution at 1:500 using ultrapure water. The drug loading was investigated by the aforementioned UHPLC-DAD method to obtain the EE within 30 and 60 days of preparation. The samples were assayed in triplicate.
In vitro dissolution experiments
Free EFV and nanoformulations PCL-EFV and PCL-PEG-EFV were submitted to the dialysis method in triplicate for investigating the drug release (Gaur et al., 2014; Gomes et al., 2019). The bag was firstly soaked in purified water before use for 12 hours. Each sample (2 ml) was inserted into a dialysis bag (Spectra/Por® molecular porous membrane tubing, molecular weight cut-off 10,000, Spectrum Laboratories, Rancho Dominguez, CA) and the dissolution experiments were carried out in phosphate-buffered saline (PBS, 400 ml, 50 mmol/l) containing 0.1% (w/v) Tween® 80 at pH 7.4. This apparatus was kept at 37°C and stirred at 50 rpm for 72 hours. At predetermined time intervals, aliquots of 2 ml were collected and immediately replaced by PBS. EFV concentration was quantified using the previously validated UHPLC-DAD method. The dissolution profiles were fitted to the Korsmeyer-Peppas model for obtaining insights about the drug release mechanism (Gomes et al., 2019; Korsmeyer and Peppas, 1983).
Statistical analysis
Data were presented as mean ± SD. The simple linear regression was used for evaluating the linearity data. RSD was reported as mandatory. The Student’s t-test or ANOVA with Tukey’s post-hoc test was used for experiments involving validation, physicochemical, and dissolution data. Statistical power at a significance level of 5.0% (α = 0.05) was previously defined. Statistical analysis was carried out using the GraphPad Prism software version 5.03 (San Diego, CA). The MicroMath Scientist™ 2.01 software (Salt Lake City, UT) was used for studying the Korsmeyer-Peppas data.