
INTRODUCTION
Finished herbal products may be defined as herbal preparations made from one or more herbs which may contain excipients (World Health Organization, 2007a). Examples include decoctions, powders, teas, tinctures, herbal capsules, herbal tablets, herbal ointments, and creams. Finished herbal products are unique compared to synthetic products due to the varied nature of constituents that may be present even in an herbal product which claimed to contain only one active ingredient (Bankoti et al., 2012). The herbal material in its entirety is normally regarded as the active ingredient. It is essential that herbal products contain the right constituents in the right quantities, whether this is a particular herb or a particular amount of a specific herbal component (Benzie and Watchtel-Galor, 2011; World Health Organization, 2007a; 2007b).
The World Health Organization (WHO) recommends that stability data are provided to support the shelf life proposed for finished herbal products under the specified conditions of storage (World Health Organization, 2007b). The shelf life of a product may be defined as the period, during which it remains within specification with respect to chemical, physical, and microbiological stability, if stored correctly (Bouwman et al., 2015). The expiry date is normally represented on the product to indicate the end of the shelf life (Tiwari, 1995). The determination of the constituents with known therapeutic activity will not usually be sufficient since other constituents may be contributing to stability of the product (Awang, 2004). Constituents (markers) for various determinations in herbal products may be categorized as chemical, analytical, and active markers (European Medicines Agency, 2009; World Health Organization, 2007a, 2007b). Chemical markers are normally chemically defined as constituents or groups of constituents of an herbal medicinal product, which are of interest for quality control purposes regardless of whether they possess any therapeutic activity or not (European Medicines Agency, 2009). The quantity of a chemical marker may be an indicator of the quality of an herbal medicine. Chemical markers may be used to evaluate the product quality and stability over time and determine the recommended shelf life (Bodhisattwa et al., 2011). Analytical markers are the constituents or group of constituents that serve solely for analytical purposes (Kruse et al., 2013). Active markers are the constituents or group of constituents that contribute to therapeutic activities (European Medicines Agency, 2009; World Health Organization, 2007a)
In general, “significant change” of a finished herbal product may be defined as a 10% change in assay from its initial value with respect to the marker being used or failure to meet the acceptance criteria for potency when using biological or immunological procedures. Considerations are also given to any degradation product exceeding its acceptance criterion or failure to meet the acceptance criteria for physical attributes and functionality tests (including color, phase separation, resuspendibility, caking, hardness, dose delivery per actuation, and pH) (Kruse et al., 2013). It should be noted that the accelerated stability tests may cause some dosage forms such as ointments and creams to change the form due to the relatively high temperatures that are employed. This should not be mistaken for failure of the product to meet the acceptance criteria since such changes should be expected (Aulton, 2007; European Medicines Agency, 2009; Food and Drugs Authority, 2012; Winfield et al., 2009).
Nibima and Asena are two herbal decoctions used at the Centre for Plant Medicine Research (CPMR). Nibima which contains Cryptolepis sanguinolenta is used in the treatment of malaria, whereas Asena which contains Khaya senegalensis, Kigelia africana, Nauclea latifolia, Clausena anisata, Piliostigma thonningii, Trichilia monadelpha, and Strophanthus hispidus is used in the treatment of arthritis and general body pains. The main active component of the C. sanguinolenta is cryptolepine, which is an organic heterotetracyclic and indole alkaloid (Downum et al., 2013; Ofori, 2010). Asena which is multiherbal in nature has not had its main active component yet established though the preparation is known to have analgesic and anti-inflammatory properties (Donkor et al., 2013). Lippia tea is a powder for tea made from Lippia multiflora used in the treatment of stress and mild hypertension. The major components of the herbal infusion of L. multiflora are phenylethanoid glycosides, including verbacoside, isoverbacoside, nuomioside, and isonuomioside (Arthur et al., 2011). NPK 500 is an herbal capsules made from Cassia sieberiana used in the treatment of pains due to stomach ulcer and menstruation. C. sieberiana is generally known to contain calcium oxalate crystals in abundance with other chemical components such as flavones (quercitrin and isoquercitrin) and an anthraquinone (rhein) (Neuwinger, 1996; Nefatti et al., 2017). These four products have been used for at least two decades at the outpatient clinic of the Centre for Plant Medicine Research, Mampong-Akuapem, Ghana. The above-mentioned disease conditions are among the top ten medical conditions treated at the outpatients’ clinic of the CPMR over a decade (CPMR, 2015). The determination of the shelf life of the products is essential as they are now prepared on commercial scale indicating the possibility of longer storage periods. No previous methods have been described before for the analyses of shelf life of all the four products.
The aim of this study is to determine the shelf life of three selected batches of the four products using HPLC analytical parameters.
MATERIALS AND METHODS
Materials
Distilled water, ethanol (Fisher Scientific, UK), methanol high-performance liquid chromatography (HPLC) gradient grade (Fisher Scientific, UK), water HPLC gradient grade (Fisher Scientific, UK), and acetic acid (Crainland Chemical Company, UK) were used. Nibima, Asena, Lippia tea, and NPK 500 capsules are all products manufactured by the Centre for Plant Medicine Research, Mampong- Akuapem, Ghana.
Preparation of reference samples of products
Batch blending was employed for the preparation of the reference samples (Chattopadhyay, 2013; World Health Organization, 2007a). Five different batches (2 l each) of each of the products Nibima and Asena were prepared according to classified formulae and blended. In the case of Lippia tea, five different batches (500 g each) of the plant material were pulverized for infusion and were blended and used to prepare an infusion according to the label stated conditions. In the case of NPK 500, an extract was obtained from blending of five different batches (500 g each) of the processed material for encapsulation by extracting in distilled water at 37°C for 45 minutes and straining. The various blends were subsequently freeze dried (Heto PowerDry, LL300, Denmark) and stored in tightly closed foil-covered glass containers in a freezer at −20°C (NORD, Ghana) for subsequent work.
Determination of UV maximum wavelength of absorption of reference samples of products
The maximum wavelength of absorption (λmax) was determined from the obtained spectra by scanning solutions (Nibima: 250 μg/ml, Asena: 350 μg/ml, Lippia tea: 110 μg/ml, and NPK 500: 55 μg/ml) of reference samples of the products in distilled water using a UV-Vis Spectrophotometer (Merck industries, Germany) through a range of 190–500 nm using quartz cuvettes over a path length of 1 cm.
HPLC method development and validation for products
Isocratic HPLC methods were developed using a methanol:water:0.1 %v/v acetic acid solvent system as mobile phase in the ratios of 9:0:1 (Nibima), 7:2:1 (Asena), 8:1:1 (Lippia tea), and 90:5:5 (NPK 500) using the HPLC machine (KNAUER, Germany). The optimum conditions were then selected for validation (Pathy et al., 2013).
The HPLC selected marker calibration plot was made using the reference samples of the product at various concentrations from 40 to 400 μg/ml for Nibima, 100 to 1200 μg/ml for Asena, 12.5 to 87.5 μg/ml for Lippia tea, and 10 to 100 μg/ml for NPK 500.
Determination of limits of detection and quantification
The limit of detection (LOD) and limit of quantification (LOQ) of the developed HPLC methods were determined from the linear regression curve obtained from the calibration plots of solutions of reference samples of products. The slope and standard deviations of the y-intercepts obtained from the linear regression line were used. The formulae for the calculation of the LOD and LOQ were defined as follows:
where S represents the slope of the regression line, and δ represents the standard deviations of the y-intercepts of the various regression lines.
Determination of range of developed methods
Different solutions of concentrations of 200, 600, 50, and 60 μg/ml of reference samples for Nibima, Asena, Lippia tea, and NPK 500, respectively, were prepared. A range of solutions with concentrations of 80%–120% (80%, 100%, and 120%) were prepared from each reference sample solution. The prepared solutions were analyzed using the developed methods. Triplicate determinations were made for each solution, and the mean percentage recovery and relative standard deviation (RSD) were calculated from resulting chromatograms.
Determination of precision of developed methods
This procedure helps to determine the precision of readings done at different times during the same day or on different days using varying concentrations of the same sample. Hence, intra- and interday precisions were assessed.
Intraday precision
The solutions of three different concentrations (100, 200, and 300 μg/ml for Nibima; 300, 400, and 500 μg/ml for Asena; 40, 50, and 60 μg/ml for Lippia tea; and 50, 60, and 70 μg/ml for NPK 500) were prepared from the reference samples of the products. The various prepared solutions were analyzed thrice during a particular day to obtain chromatograms, from which percentage recoveries and RSDs were calculated.
Interday precision
The solutions of concentrations of 200, 600, 50, and 60 μg/ml were prepared from reference samples of Nibima, Asena, Lippia tea, and NPK 500, respectively, on three consecutive days and analyzed using the developed HPLC methods to obtain chromatograms, from which percentage recoveries and RSDs were calculated.
Determination of specificity of developed methods
This was done to ensure that there was insignificant interference of any analyte from the solvent system being used as mobile phase. The mobile phase (blank) was injected, and the resulting chromatogram was analyzed, followed by an injection of a sample solution of prepared reference samples of concentrations of 200, 600, 50, and 60 μg/ml for Nibima, Asena, Lippia tea, and NPK 500, respectively. After 20-minute wash period, the mobile phase was analyzed again, and the results were recorded.
Determination of robustness of developed methods
The robustness of the method was determined by varying the flow rates and wavelengths of the detector responses within a range of ± 0.2 ml/minute and ± 5 nm, respectively, while keeping other composition parameters constant. Percentage recoveries and RSD of the responses obtained from the resulting chromatograms from triplicate determinations were then done.
Determination of stability of solution of reference samples
The stability of solutions of all reference samples was studied over a period of 10 hours by triplicate injections for every 2 hours. The results of peak area were obtained from resulting chromatographs, and the subsequent analyses of percentage recovery and RSD of obtained responses were done.
Optimized HPLC conditions developed for the products using solvent systems and conditions have been outlined as follows:
Column type: Reverse Phase C-18 symmetric shield
Mobile phase ratios: Methanol:water:0.1 %v/v acetic acid solution: 9:0:1 (Nibima), 7:2:1 (Asena), 8:1:1 (Lippia tea), and 90:5:5 (NPK 500)
Flow rate: 0.8 ml/minute
Injection volumes: 25 μl
Wavelength of detection (nm): 283, 290, 332, and 290, respectively, for Nibima, Asena, Lippia tea, and NPK 500.
Run time: 8 minutes
Temperature: Ambient.
Test samples expected concentrations prepared: 400 μg/ml (Nibima and Asena), 50 μg/ml (Lippia tea), and 40 μg/ml (NPK 500).
The calibration plot was made using the reference samples of the product at various concentrations of 40–400 μg/ml for Nibima, 100–1200 μg/ml for Asena, 12.5–87.5 μg/ml for Lippia tea, and 10–100 μg/ml for NPK 500.
Sampling of products from commercial batches for stability studies
All batches of products used in the formulation studies were produced on commercial scale. Products were randomly sampled from the produced commercial batch at the production unit using the formula n* = √N + 1, where n* is the number of samples to be taken rounded up to a whole number and N is the number of bottles, vials of capsules, and sachets in the commercial batch. Three batches were selected for the determination of the stability profile (British Pharmacopoeia, 2013).
Table 1 shows the quantities of products collected from commercial batches for stability studies.
HPLC analyses of products in stability studies
The developed and validated methods for the reference samples were used in the analyses. The procedure was repeated for all three stability study batches of all products at time points of 0, 3, 6, 12, and 18 months for samples stored at 30°C ± 2°C/70% RH ± 5% RH (European Medicines Agency, 2006). The samples were stored in a stability chamber (Memmert, Germany). The estimated concentrations prepared for samples were 400 μg/ml (Nibima and Asena), 50 μg/ml (Lippia tea), and 40 μg/ml (NPK 500 capsules).
Statistical analyses and analytical software used
GraphPad Prism Version 6 for Windows (GraphPad Software, San Diego California, USA, www.graphpad.com) was used in the plotting of calibration plots, and the subsequent linear regression analyses were used in the determination of the equations of the calibration plots. Systat SigmaPlot Version 14 (www.systatsoftware.com) for shelf life was used in the determination of the shelf life(s) of the products.
RESULTS AND DISCUSSION
The UV spectrum of the aqueous solution of the reference sample of Nibima in Figure 1 indicates three major peaks appearing at 230, 289(λ max), and 366 nm, respectively. The UV spectrum of the aqueous solution of the reference sample of Asena in Figure 2 also indicates two major peaks appearing at 230 and 291 nm (λmax), respectively. Two major peaks appearing at 230 and 327 nm were also observed as shown in Figure 3 when the UV scan of a solution of the reference sample of Lippia tea was done. Finally, Figure 4 also shows two major peaks appearing at 230 and 289 nm (λmax), respectively, which were observed from the characteristic UV profile obtained from the scan of NPK 500 capsules. The UV spectra of all the reference samples of products indicate the presence of a 230 nm peak in addition to other peaks for all products. The appearance of the 230 nm peak in the spectra may be linked to the presence of a plant constituent (s). Reducing sugars are known to have an anomeric carbon with a hydroxyl group attached that can reduce other compounds to carboxylic acids (Seager and Slabaugh, 2000). In another study involving the evaluation of ultraviolet, visible, and near-infrared spectroscopy for the analysis of wine, 202 and 230 nm were the peaks with the highest responses in the UV region. It is suggested that these peaks are relative to carboxyl groups of organic acids (Martelo-Vidal and Vázquez, 2014).
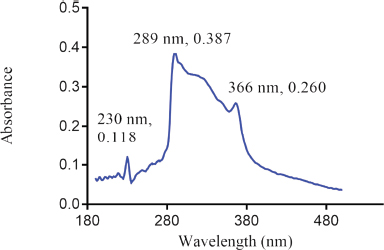 | Figure 1. UV Spectrum of Nibima (250 μg/ml). [Click here to view] |
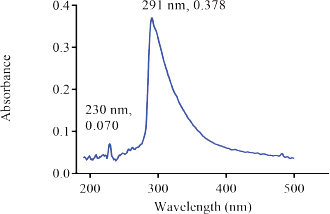 | Figure 2. UV Spectrum of Asena (350 μg/ml) [Click here to view] |
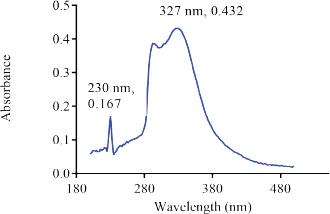 | Figure 3. UV Spectrum of solution of reference sample of Lippia Tea (110 μg/ml). [Click here to view] |
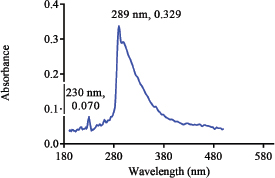 | Figure 4. UV Spectrum of solution of reference sample of NPK 500 capsules. [Click here to view] |
The HPLC profile of the solution of the reference sample of Nibima as shown in Figure 5 indicates two major peaks represented as LDE/001 A and LDE/001 B, respectively. LDE/001 B was selected as a marker of choice for further analyses due to it being known as an active marker (cryptolepine) for the product (Ofori, 2010). The HPLC profile of the solution of the reference sample of Asena as shown in Figure 6 indicates one major peak at a retention time of 6.13 minutes, which was used as a marker of choice for further analyses in the stability studies. The chemical structure of the marker has, however, not only been established but also may be derived from any of the seven plant materials used in the formulation. The HPLC profile of the solution of the reference sample of Lippia tea as shown in Figure 7 also indicates one major peak appearing at a retention time of 2.97 minutes, which was used as a marker of choice for further analyses in the stability studies. This marker may be one of the major components of the herbal infusion of L. multiflora such as verbacoside, isoverbacoside, nuomioside, or isonuomioside (Arthur et al., 2011). Finally, the HPLC profile of the solution of a reference sample of NPK 500 capsules as shown in Figure 8 indicates one major peak appearing at a retention time of 2.82 minutes, which was used as a marker of choice for further analyses in the stability studies. This marker may be one of the major chemical components, such as quercitrin, isoquercitrin, or rhein known to be present in the root bark of the plant C. sieberiana (Neuwinger, 1996; Nefatti et al., 2017).
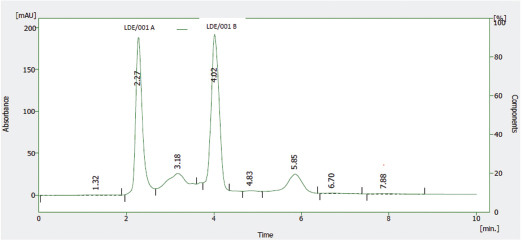 | Figure 5. HPLC Profile of solution of reference sample of Nibima. [Click here to view] |
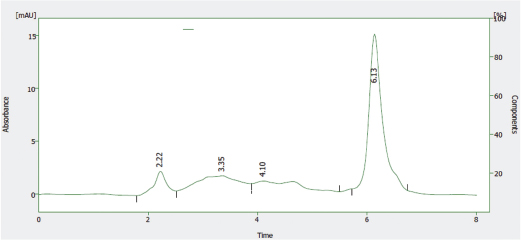 | Figure 6. HPLC Profile of solution of reference sample of Asena. [Click here to view] |
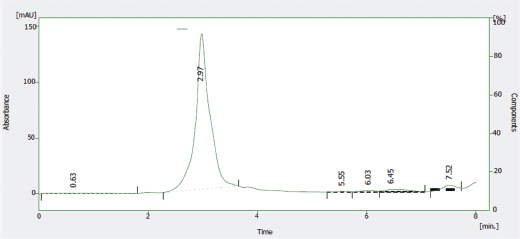 | Figure 7. HPLC Profile of solution of reference sample of Lippia tea. [Click here to view] |
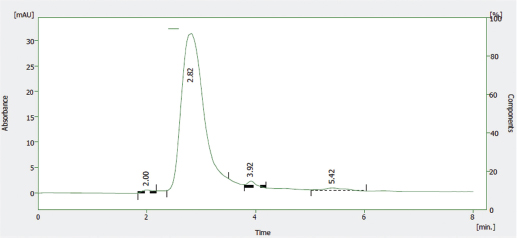 | Figure 8. HPLC Profile of solution of reference sample of NPK 500 capsules. [Click here to view] |
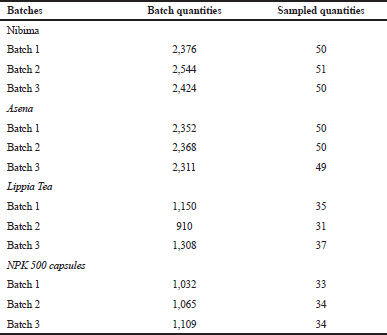 | Table 1. Quantities of products collected from commercial batches for stability studies. [Click here to view] |
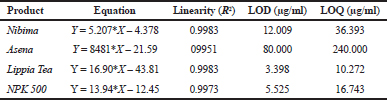 | Table 2. Linear regression equations, Linearity, LOD, and LOQ of reference samples in HPLC method validation. [Click here to view] |
The development and validation of HPLC methods are an essential aspect in the analyses of herbal medicinal products due to their complex nature (Wagner et al., 2011). HPLC is a column chromatographic separation technique that helps to identify various markers that may be present in the herbal product using various detectors including UV-Visible, photodiode array detector, fluorescence detector, conductivity detector, refractive index detector, electrochemical detector, mass spectrometer detector, and evaporative light-scattering detector (Pathy et al., 2013). The detection of the compounds is based on the mobile and stationary phases being employed together with the detection method. An initial UV spectrum gives an idea as to what range of wavelength should be used in the HPLC determination of an herbal extract making the HPLC method development and validation method more easily carried out since most laboratories use the UV-Vis method of detection (Ofori, 2010).
The complexity of components in an herbal medicine makes various spectrophotometric methods useful in the determination of spectra to be used as a standardization tool. The UV-visible spectrophotometric method provides spectra with a maximum wavelength of absorption for the herbal product or extract. The markers identified by UV-visible spectrophotometric technique are normally a myriad of compounds which can absorb light at the particular wavelength recorded. The results obtained help to develop further methods for isolation and purification of the herbal extract (Joshi, 2012).
Table 2 shows the linear regression equations, linearity, LOD, and LOQ of reference samples in HPLC method validation. The specificity determination showed the HPLC method to be specific for the markers in the samples. Two major peaks were obtained with Nibima (200 μg/ ml) at retention times of 2.27 and 4.02 minutes, whereas Asena (600 μg/ ml), Lippia tea (50 μg/ml), and NPK 500 capsules (40 μg/ml) produced single peaks at retention times of 6.13, 2.97, and 2.82 minutes, respectively. No significant peaks were detected when blank mobile phase solvent was injected. The HPLC method was robust within the wavelength range of 278–332 nm for all the samples, producing percentage recoveries in excess of 98% for all samples. The relative standard deviation of the percentage recovery was between 0.51 and 0.91. In addition, a comparative result was obtained when the flow rate was varied between 0.6 and 1.0 ml/minute. Table 3 shows the determination of a range of developed HPLC methods, Table 4 shows the determination of intraday precision using three different concentrations of reference samples analyzed at various times during the day, Table 5 shows the determination of interday precision of developed HPLC methods for various products, and Table 6 shows the determination of stability of developed HPLC methods.
Table 7 shows the mean normalized content of products with time in the stability study. To predict the shelf life of the products, changes in the HPLC selected marker contents were analyzed with time. The stability of herbal products with time is very critical in the quality assurance of products and the subsequent determination of the shelf life. However, the complex nature of most medicinal products of herbal origin makes it very challenging to determine specific ranges and acceptance criteria for the assessment of the stability profiles (Kruse et al., 2013) The establishment of monographs for products which may take several years is an important aspect to allow a set criterion, from which various parameters may be assessed. In the case of most herbal products used, especially in the developing countries (Calixto et al., 2003), monographs are yet to be established as is the case of the selected products Nibima, Asena, Lippia tea, and NPK 500 capsules.
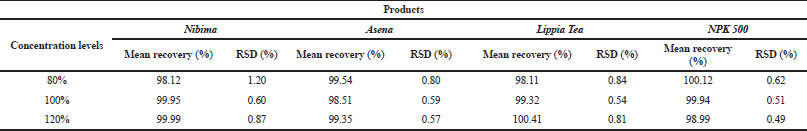 | Table 3. Determination of range of developed HPLC methods. Acceptance criteria: % RSD (relative standard deviation) ≤2%. [Click here to view] |
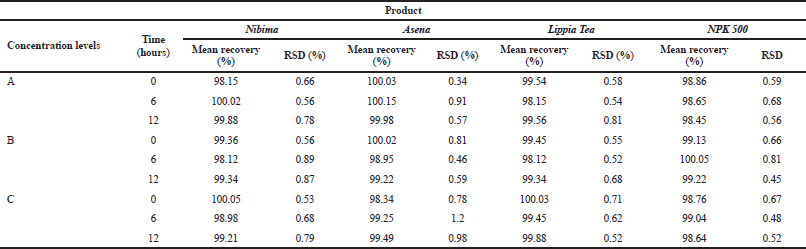 | Table 4. Determination of Intraday precision using three different concentrations of reference samples analysed at various times during the day. Acceptance criteria: % RSD ≤ 2%. Concentration level “A” represents100, 300, 40, and 50 μg/ml, respectively, for Nibima, Asena, Lippia Tea, and NPK 500 capsules; “B” represents 200, 400, 50, and 60 μg/ml, respectively, for Nibima, Asena, Lippia Tea, and NPK 500 capsules; “C” represents 300, 500, 60, and 70 μg/ml, respectively, for Nibima, Asena, Lippia Tea, and NPK 500 capsules. [Click here to view] |
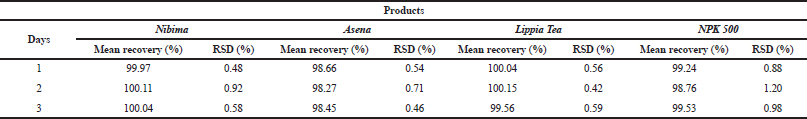 | Table 5. Determination of Interday precision of developed HPLC methods for various products. Acceptance criteria: % RSD (relative standard deviation) ≤2%. [Click here to view] |
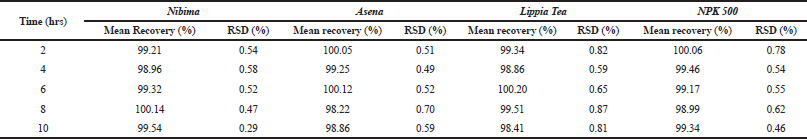 | Table 6. Determination of stability of developed HPLC methods. Acceptance criteria: % RSD (relative standard deviation) ≤ 2%. [Click here to view] |
Using the HPLC marker content analyses and subsequent Systat SigmaPlot for a shelf life of obtained results, the shelf life(s) obtained were 23.14, 21.16, 62.97 and 32.91 months for Nibima, Asena, Lippia tea, and NPK 500 capsules, respectively. The relatively better stability of the powder and capsule product compared with the decoctions is evident in this result. The shelf life of every product is unique based on the considered factors in its manufacture and storage (Aulton, 2007).
Limitation of study
Although the HPLC marker used in the analyses of the product was an active marker (cryptolepine), markers used in the study of the other three products such as Asena, Lippia tea, and NPK 500 capsules were analytical in nature. The determination of the shelf life of the products was limited to the randomly selected three primary batches of each product as per product. The determined shelf life obtained was extrapolated based on an 18-month study. Real-time study covering the entire time beyond the obtained shelf life should be done to validate shelf life of products.
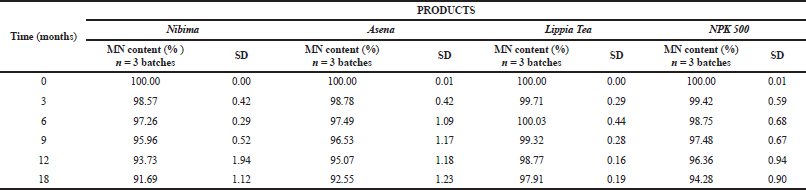 | Table 7. Mean normalized content of products with time in stability study. MN content (%) represents the mean normalized content of the three tested batches. SD represents the standard deviation of the mean. p values from linear regression and correlation analyses using paired t test; <0.0001 for Nibima, Asena, Lippia Tea, and NPK 500 capsules. [Click here to view] |
CONCLUSION
The HPLC method was used efficiently for the analysis of herbal markers of the products Nibima, Asena, Lippia tea, and NPK 500 capsules. Shelf life(s) of Nibima, Asena, Lippia tea, and NPK 500 capsules was successfully determined. The predicted shelf life for the products is 23.14, 21.16, 62.97, and 32.91 months for Nibima, Asena, Lippia tea, and NPK 500 capsules, respectively. PD/001 powder and CP/001 capsules are relatively more stable compared to LDE/001 and LDE/002 decoctions. The obtained shelf life indicates the relative stability of the products.
ACKNOWLEDGMENT
The authors would like to thank the management and technical staff of CPMR, Mampong-Akwapim, Ghana, for their technical support and their generous provision of products for the stability study. The authors would also like to thank the management and staff of the Pharmaceutics and Microbiology Department, School of Pharmacy, University of Ghana, for their technical support.
CONFLICT OF INTEREST
Authors declare that there are no conflicts of interest.
FINANCIAL SUPPORT
None.
REFERENCES
Archer M, Agyei A, Mintah S, Adjei P, Kumadoh D, Asiedu-Larbi J. Medicinal uses of Cassia sieberiana; a review. Int J Sci Basic Appl Res, 2019; 48:161–80.
Arthur H, Joubert E, De-Beer D, Malherbe CJ, Witthuhn RC. Phenylethanoid glycosides as major antioxidants in Lippia multiflora herbal infusion and their stability during steam pasteurisation of plant material. Food Chem, 2011; 127(2):581–8. CrossRef
Aulton ME. Aulton’s pharmaceuitcs, the design and manufacture of medicines. Churchill Livingstone Publishers, London, UK, 2007.
Awang DVC. Standardization of herbal medicinal products. Acta Hort, 2004; 629(14):111–4. CrossRef
Bankoti K, Rana M, Bharadwaj M. Accelerated stability study of herbal capsules. J Pharm, 2012; 5:1–6. CrossRef
Benzie F, Watchtel-Galor S. Herbal medicine, biomolecular and clinical aspects. 2nd edition, CRC Press, London, UK, 2011. CrossRef
Bodhisattwa M, Nagori B, Rambir S, Pragati K, Nishant U. Recent trends in herbal drugs: a review. Int J Drug Res Technol, 2011; 1:17–25.
Bouwman Y, V’Iain F, Le Brun P. Practical pharmaceutics, international guidelines for the preparation, care and use of medicinal products. Springer Publishers, The Netherlands 2015.
British Pharmacopoeia. Herbal drugs, herbal drug preparations and herbal medicinal products, vol. IV. British Pharmacopoiea Commission Stationery Office, London, UK, 2013. CrossRef
Calixto J, Otuki MF, Santos ARS. Anti-inflammatory compounds of Plant origin; Part I; action on Archidonic acid pathway, nitric oxide and nuclear factor kB (NF-KB). Plant Med, 2003; 63:973–83. CrossRef
Chattopadhyay P. Herbal cosmetics and Ayuverdic medicines. 3rd edition, Nirr Project Consultancy Services, New Delhi, India.
CPMR. Annual report of the production unit. Centre for Plant Medicine Research, Mampong-Akuapem, Ghana, 2015.
Donkor K, Asiedu-Larbi J, Antwi S, Takyi N, Martey O, Okine L. Analgesic and anti-inflammatory activities of Asena, a herbal preparation for treatment of arthritis, using rodents. Med Aromatic Plants Res J, 2013; 1:20–9.
Downum RK, Romeo JT, Stafford AH. Phytochemical potential of tropical plants. Springer Science and Media, Berlin, p 29, 2013
European Medicines Agency. Stability testing of new drug substances and products. EMEA, London, UK, pp 1–20, 2006.
European Medicines Agency. Reflection paper on stability testing of herbal medicinal products and traditional herbal medicinal products. Committee on Herbal Medicinal Products, EMEA, London, UK, pp 1–3, 2009.
Food and Drugs Authority. Guidelines for registration of herbal medicinal products in Ghana. Food and Drugs Authority, Accra, Ghana, 2012.
Joshi DD. Herbal drugs and fingerprints; Evidence based herbal drugs. Springer Sciences and Media, Berlin, pp 101–20, 2012. CrossRef
Kruse SO, Freese-Willms E, Buchholz K. Stability testing of herbal medicinal products bridging science to industry. GmbH and co. KG, Munster/Diapharm Analyticals, Oldenburg, Germany, 2013. CrossRef
Martelo-Vidal MJ, Vázquez M. Evaluation of ultraviolet, visible, and near infrared spectroscopy for the analysis of wine compounds. Food Sci J, 2014; 1:37–47. CrossRef
Ofori E. Development of a reverse-phase HPLC method for the quantification of cryptolepine in the dry roots of Cryptolepis sanguinolenta. Kwame Nkrumah University of Science and Technology, Kumasi, Ghana, pp 1–65, 2010.
Neffati M, Najjaa H, Mathe A. Medicinal and aromatic plants of the World-Africa. Springer Science and Media, Berlin, p 257, 2017. CrossRef
Neuwinger HD. African ethnobotany; Poisons and drugs: chemistry, pharmacology and toxicology. CRC Press, London, UK, p 282, 1996.
Pathy SK, Murthy YLN, Sunithasarma AR. Basic skills training guide -HPLC method development and validation—an overview. Research Gate, Berlin, Germany, 2013.
Seager LS, Slabaugh MR. Organic and biochemistry for today. 4th edition, Brooks/Cole Publishing Company, 2000.
Tiwari M. Ayurveda secrets of healing. Lotus Press Publishers, Kanderm, Germany, 1995.
Wagner H, Bauer R, Melchart D, Xiao P, Staudinger A. Chromatographic fingerprint analysis of herbal medicines thin-layer and high performance liquid chromatography of Chinese drugs. 2nd edition, vol. 2. Springer-Verlag/Wien Publishers, New York.
Winfield A, Rees A, Smith I. Pharmaceutical practice. Churchill Livingstone, Australia, 2009.
World Health Organization. Quality assurance of pharmaceuticals, a compendium of guidelines and related materials, 2nd edition, Vol. 2, WHO, Geneva, Switzerland, 2007a.
World Health Organization. Guidelines on good manufacturing practices for the manufacture of herbal medicines. WHO, France, 2007b.