
INTRODUCTION
Histone acetyltransferases has a crucial role in hematogenesis and are one among the chromatin modifying enzymes that are responsible for the post-translational modifications of the histone in the nucleosome of a cell which include methylation, acetylation, ADP-ribosylation, phosphorylation, and ubiquitination (Allfrey et al., 1964; Des Jarlais and Tummino, 2016; Lawrence et al., 2016; Luger and Richmond, 1998; Sterner and Berger, 2000; Sadakierska and Filip, 2015) Among these, acetylation is known to be the earliest modification which is related to the gene activation as it is linked functionally with transcription activation by adding acetyl group (—COCH3) to the s-amino group present in lysine residue resulting in loosening of the nucleosome structure (Bannister and Miska, 2000; Roth et al., 2001; Parthun, 2012). This acetylation occurs at the N-terminal of the basic amino acid (lysine) dense region of the histone core; as a result, the acetyl-CoA gets transferred to -NH+ of lysine neutralizing the +ve charge (Loidl, 1994). There are three different families of histone acetyltransferase (HAT) which are p300, GNAT (Gcn5-related N-acetyltransferase), and MYST (MOZ, Ybf2, Sas2, and Tip60 as founding members) (Voss and Thomas, 2018). Monocytic leukemia zinc finger protein (MOZ HAT) is an oncogene of MYST family which is involved directly in the process of hematopoiesis as it forms HAT complex that acetylates H2 (A and B), H3 and H4 corresponding to the up-regulation of gene there by activating the oncogene resulting in acute myeloid leukemia (AML) (Borrow et al., 1996; Champagne et al., 2001; Dohner et al., 2015). Granulocytic leukemia (synonym for AML) is a cancer that is characterized by the over production of white blood cells that are immature (myeloblasts) and functionally causes affect on blood as well as bone marrow. These cells prevent leukopoiesis of normal blood cells that act as the defense system in the body resulting in poor immune system and also cause anemia, bruising, and easy bleeding (Camos et al., 2006; Ullah et al., 2008). KAT6A is one among the five subfamilies of MYST HAT that is responsible for the hostile form of acute myeloid leukemia due to rearrangement in the KAT6A gene (Lowenberg et al., 1999). Hence, inhibiting HAT KAT6A would help preventing the continuous growth of tumors and their metastasis in case of AML.
Literature survey reveals only two compounds that were discovered which include WM- 8014 and WM-1119 of which latter was found to be the most active compound with IC50 value of 0.25 pM showing less protein-binding than the former with IC50 value of 2.3 pM and high protein-binding (Baell et al., 2018). Based on the study of WM-1119, the same group further discovered benzoylsulfonohydrazides as the potent inhibitors of HAT KAT6A (Leaver et al., 2019). Therefore, in the present in silico study, we endeavored to develop a 3D QSAR model adopting CoMFA and CoMSIA techniques on 61 benzoylsulfonohydrazide analogs from which the contour maps of the most active compound could give an insight in developing inhibitors with enhanced activity against HAT KAT6A.
METHODOLOGY
Data set preparation
Sixty-one benzoylsulfonohydrazides as potent inhibitor of histone acetyltransferase KAT6A were taken from the literature (Leaver et al., 2019). These molecules were reported to inhibit in micro-molar range (IC50) and were converted to pIC50; which is the negative logarithm of IC50 (i.e., pIC50 = −log IC50). The molecules were constructed in SYBYL X and minimized by Gasteiger–Huckel charges using distance dependent dielectric and Powell-conjugate gradient algorithm with 0.05 kcal/mol convergence. All the default parameters were adopted during the minimization of the molecules.
Alignment
The alignment of the molecules determines the accuracy of the model. The molecules in the present study were aligned upon the most active compound by selecting a basic skeleton of benzoylsulfonohydrazide. Figure 1 represents the common structure used to sketch the molecules, whereas alignment of all 61 optimized molecules on the basic skeleton are presented in Figure 2.
3D QSAR Model construction
Model of 3D QSAR of benzoylsulfonohydrazides in the present study was constructed on SYBYL X in which CoMFA and CoMSIA methods were adopted to determine the relation between the bioactivity with their corresponding 3D structure of molecules. CoMFA model describes the steric fields and the electrostatic fields of the molecules under study, whereas CoMSIA model describes the hydrophobic, HBD and HBA along with steric as well as electrostatic fields.
Statistical validation
Partial least square method (PLS) is a standard statistical regression tool used to predict the 3D QSAR model. It was adopted for the present study as it can analyze the data in a realistic way and interpret the contribution of the molecular structure with the biological activity. For CoMFA, all the parameters which include cross-validation, correlation coefficient, standard error of estimate, f-value etc. were obtained taking number of components of 5 and 6, whereas column filtering of 2 and 1 for CoMFA and CoMSIA, respectively. The study was conducted dividing the molecules in 1:3 ratio of test and training molecules, respectively. Therefore, 15 molecules were selected randomly which were grouped as test set and the remaining 46 were grouped as training set. With this, leave one out (LOO) was used in order to establish the reliability of the generated model for CoMFA as well as CoMSIA. All other parameters were recorded for no-validation, cross-validation, and bootstrapping. The activity was predicted for the test as well as training set and correlated with the experimental pIC50 values.
 | Figure 1. Common structure used to sketch molecules. [Click here to view] |
 | Figure 2. Alignment of benzoylsulfonohydrazide analogues. [Click here to view] |
Molecular docking
It is an important technique to find the interaction of the ligand with a specific protein of interest. The study was done using AutoDockTools software (Morris et al., 2009). The protein structure (6CT2) of 2.128A resolution in PDB format was downloaded from database of protein (https://www.rcsb.org) and the ligand structures that were constructed and their energy was minimized in sybyl X and were further prepared within the docking software. The active ligand interacting site of the protein was noted from PDBSum (http://www.ebi.ac.uk) as SER 690 (A). The x, y, z coordinates were taken from Spdbv protein viewer tool and entered in the grid to generate active site grid box. The crystal water was removed prior to docking simulation followed by docking of the protein with highest and lowest active ligands. Compound PS-97 was the most active while the least active compound was PS-9.
RESULTS
Statistical results
A model for CoMFA and CoMSIA was produced using 61 KAT6A inhibitors using benzoylsulfonohydrazide as the skeleton for alignment. The image of alignment of the inhibitors can be visualized in Figure 2.
The model was developed by randomly dividing the molecules in 1:3 ratio of test and training set and performing PLS analysis to determine the prediction power of the model. The pIC50 values were predicted for both series. Table 1 shows the predicted as well as residual values of these analogues and their correlation is shown in Figures 3 and 4, respectively.
 | Table 1. Experimental and predicted values of the kat6a inhibitors. [Click here to view] |
Statistical analysis
The statistical results obtained after running PLS regression for both the variables, i.e., CoMFA and CoMSIA, which includes LOO, no validation, cross validation, and also Bootstrapping, were recorded to evaluate reliability of the developed model. In case of CoMFA, the q2 obtained was 0.678; r2 was 0.948, whereas F-value and SEE was 144.505 and 0.226, respectively. Steric field contribution was 47.8%, while electrostatic field was 52.2%. Similarly, in CoMSIA, q2, r2, F-value and SEE were 0.719, 0.953, 132.246, and 0.217, respectively. Steric and electrostatic field contribution was 15.2%and 50.3%, while Hydrophobic, HBD, and HBA were 26.3%, 1.6%, and 6.6%, respectively. The results of the statistical analysis are outlined in Table 2.
 | Figure 3. Plot of experimental pIC50 versus predicted IC50 by CoMFA. [Click here to view] |
 | Figure 4. Plot of experimental pIC50 versus predicted IC50 by CoMSIA. [Click here to view] |
 | Table 2. Statistical data O (CoMFA and CoMSIA). [Click here to view] |
Contour analysis
Contour maps analyze the characteristics of the fields around the molecules. These are used to find the basic structural requirement for the bioactivity which facilitate for the development of inhibitors with high potency. Best active compound (P5-97) of training set was considered to analyze contour maps by setting contribution values of favored as well as disfavored region to 80% and 20%, respectively. The steric contributions of the best active compound can be visualized in Figures 5 (CoMFA) and 6 (CoMSIA), whereas electrostatic contribution can be observed in Figures 7 and 8, respectively. Other parameters of CoMSIA which include hydrophobicity, HBD and HBA are shown in Figures 9–11, respectively.
 | Figure 5. Steric contour map (CoMFA). [Click here to view] |
Molecular docking analysis
Docking study reveals the interaction of the selected ligand with the protein of interest which enables us to understand the model of 3D QSAR. The docking study was performed using AutoDock tools software and the results are outlined in Table 3. From the docked images of the potent compound (P5-97) as viewed in Figures 12 and 13, it was observed that all the three oxygen atoms were responsible for binding with the amino acids GLY657, ARG660, and ARG655 of the active region. The calculated binding energy was found to be −11.81 kcal/mol. Moreover, from the docking (Figs. 14 and 15) of the least active compound, P5-9 shows that the oxygen atoms, one from sulfono group, the other from benzoyl group, and the R2 methoxy group were responsible for binding the drug with GLY657, GLY659, and LYS763 amino acids in the active region of the protein. The binding energy corresponding to P5-9 was −9.68 kcal/mol.
 | Figure 6. Steric contour maps (CoMSIA). [Click here to view] |
 | Figure 7. Electrostatic contour map (CoMFA). [Click here to view] |
 | Figure 8. Electrostatic contour map (CoMSIA). [Click here to view] |
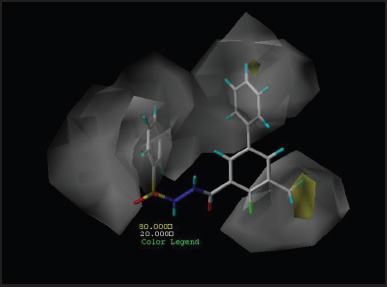 | Figure 9. Hydrophobic contour map of P5-97. [Click here to view] |
 | Figure 10. H-bond donor contour map of P5-97. [Click here to view] |
 | Figure 11. H-bond acceptor contour map of P5-97. [Click here to view] |
 | Table 3. Docking results of height and least active compounds. [Click here to view] |
 | Figure 12. Docking image of P5-97. [Click here to view] |
 | Figure 13. Docking image of P5-97. [Click here to view] |
 | Figure 14. Docking image of P5-9. [Click here to view] |
 | Figure 15. Docking image of P5-9. [Click here to view] |
DISCUSSION
From steric contour maps corresponding to CoMFA and CoMSIA represented in Figures 5 and 6, respectively, the result suggests that, by attaching substituent at green colored region would enhance the activity while yellow contour indicate the decreased activity. Therefore, attachment of various groups at R3 position of the benzoyl group would increase the potency of compound P5-97. Electrostatic contour maps of respective CoMFA and CoMSIA, red color represent the negative favorable region where as blue color represents the positive favorable regions. Increasing the positive nature at the benzoyl ring and increasing negative charge at R2 position could enhance the activity of the compound.
Hydrophobic contour maps from Figure 9 with white and yellow region indicate attachment of hydrophilic and hydrophobic groups, respectively, would result in compounds with increase in the activity. The substitution with hydrophobic group at R3 position and hydrophilic groups at the R5 position of benzoyl and the phenyl ring at the sulfo terminal would significantly enhance the inhibitory action.
From Figure 10 of H-bond donor contour map, substitution with electron withdrawing groups to both the nitrogens of the hydrazine may favor to increase the activity of the molecule. Furthermore, it is clear from the docking study that the key components responsible for binding the ligand (P5-97) within the active region are the oxygen atoms of benzoylsulfonohydrazide. Moreover, from the hydrophobic contour map (Fig. 9) obtained by 3D QSAR study, presence of hydrophilic groups on both the phenyl rings of benzoylsulfonohydrazides would show more binding interactions such that it fits better in the active region of protein. From the obtained results of the study, it provides significant proposition to develop further new compounds retaining the benzoylsulfonohydrazides as the key components.
CONCLUSION
The in silico 3D QSAR study of 61 benzoylsulfonohydrazide analogs of histone acetyltransferase KAT6A inhibitors were carried out. Partial least square analysis was done to evaluate the model developed for CoMFA and CoMSIA. The cross validation (q2) and no validation (r2) for CoMFA were 0.678 and 0.948, while for CoMSIA were 0.719 and 0.953, respectively. Therefore, the obtained results were convincing as they were within the acceptable statistical criterion (q2 > 0.5). From the cross-validation results, the model of CoMFA and CoMSIA are nearly similar, however, CoMSIA shows to have a better predictive ability. The contour maps that were obtained from study of CoMFA and CoMSIA of the compound (P5-97), it provides significant insight to design molecules with better inhibitory activity.
ACKNOWLEDGMENT
The authors are thankful to Dr. Neshatul Haque, Postdoctoral Fellow, IICT, Tarnaka and Mr. Shravan kumar Gunda, Department of Bioinformatics, PGRRCDE, Osmania University for their continuous support and motivation for the work.
FUNDING
This research did not receive any specific grant from funding agencies in the public, commercial, or non-for-profit sectors.
CONFLICT OF INTEREST
The authors declare that there are no conflicts of interest.
REFERENCES
Allfrey VG, Faulkner R, Mirsky AE. Acetylation and methylation of histones and their possible role in the regulation of RNA synthesis. Proc Natl Acad Sci USA, 1964; 51(5):786–94. CrossRef
Baell JB, Leaver DJ, Hermans SJ, Kelly GL, Brennan MS, Downer NL, Nguyen N, Wichmann J, McRae HM, Yang Y, Cleary B. Inhibitors of histone acetyltransferases KAT6A/B induce senescence and arrest tumour growth. Nature, 2018; 560(7717):253. CrossRef
Bannister AJ, Miska EA. Regulation of gene expression by transcription factor acetylation. Cell Mol Life Sci, 2000; 57(8–9):1184–92. CrossRef
Borrow J, Stanton VP, Andresen JM, Becher R, Behm FG, Chaganti RS, Civin CI, Disteche C, Dube I, Frischauf AM, Horsman D. The translocation t (8; 16)(p11; p13) of acute myeloid leukaemia fuses a putative acetyltransferase to the CREB-binding protein. Nat Genet, 1996; 14(1):33. CrossRef
Camos M, Esteve J, Jares P, Colomer D, Rozman M, Villamor N, Costa D, Carrio A, Nomdedeu J, Montserrat E, Campo E. Gene expression profiling of acute myeloid leukemia with translocation t (8; 16) (p11; p13) and MYST3-CREBBP rearrangement reveals a distinctive signature with a specific pattern of HOX gene expression. Cancer Res 2006; 66(14):6947–54. CrossRef
Champagne N, Pelletier N, Yang XJ. The monocytic leukemia zinc finger protein MOZ is a histone acetyltransferase. Oncogene, 2001; 20(3):404. CrossRef
DesJarlais R, Tummino PJ. Role of histone-modifying enzymes and their complexes in regulation of chromatin biology. Biochemistry, 2016; 55(11):1584–99. CrossRef
Dohner H, Weisdorf DJ, Bloomfield CD. Acute myeloid leukemia. N Engl J Med, 2015; 373(12):1136–52. CrossRef
Lawrence M, Daujat S, Schneider R. Lateral thinking: how histone modifications regulate gene expression. Trends Genet, 2016; 32(1):42–56. CrossRef
Leaver DJ, Cleary B, Nguyen N, Priebbenow DL, Lagiakos HR, Sanchez J, Xue L, Huang F, Sun Y, Mujumdar P, Mudududdla R. Discovery of benzoylsulfonohydrazides as potent inhibitors of the histone acetyltransferase KAT6A. J Med Chem, 2019; 62(15):7146–59. CrossRef
Loidl P. Histone acetylation: facts and questions. Chromosoma, 1994; 103(7):441–9. CrossRef
Lowenberg B, Downing JR, Burnett A. Acute myeloid leukemia N Engl J Med, 1999; 341(14):1051–62. CrossRef
Luger K, Richmond TJ. The histone tails of the nucleosome. Curr. Opin. Genet. Dev. 1998; 8(2):140-6. CrossRef
Morris GM, Huey R, Lindstrom W, Sanner MF, Belew RK, Goodsell DS, Olson AJ. AutoDock4 and AutoDockTools4: automated docking with selective receptor flexibility. J Comput Chem, 2009; 30(16):2785–91. CrossRef
Parthun MR. Histone acetyltransferase 1: More than just an enzyme? Biochim Biophys Acta, 2012; 1819(3–4):256–63. CrossRef
Roth SY, Denu JM, Allis CD. Histone acetyltransferases. Annu Rev Biochem, 2001; 70(1):81–120. CrossRef
Sadakierska-Chudy A, Filip M. A comprehensive view of the epigenetic landscape. Part II: Histone post-translational modification, nucleosome level, and chromatin regulation by ncRNAs. Neurotoxic Res, 2015; 27(2):172–97. CrossRef
Sterner DE, Berger SL. Acetylation of histones and transcription-related factors. Microbiol Mol Biol Rev, 2000; 64(2):435–59. CrossRef
Ullah M, Pelletier N, Xiao L, Zhao SP, Wang K, Degerny C, Tahmasebi S, Cayrou C, Doyon Y, Goh SL, Champagne N. Molecular architecture of quartet MOZ/MORF histone acetyltransferase complexes. Mol Cell Biol, 2008; 28(22):6828–43. CrossRef
Voss AK, Thomas T. Histone lysine and genomic targets of histone acetyltransferases in mammals. BioEssays, 2018; 40(10):1800078. CrossRef
Zheng Y, Thomas PM, Kelleher NL. Measurement of acetylation turnover at distinct lysines in human histones identifies long-lived acetylation sites. Nat Commun, 2013; 4:2203. CrossRef