INTRODUCTION
Currently, in line with the jargon of “back to nature”, the use of phytochemicals as antioxidants and other biological activities beneficial to human health contained in herbal has increased tremendously (Aisha et al., 2012). This is supported by increased numbers of research and publication of exploring natural antioxidants from under-utilized part of fruit such as seed and peel from tropical regions (Khoo et al., 2016). One of the tropical fruits commonly consumed is Mangosteen with the scientific name of Garcinia mangostana Linn. Mangosteen fruit (Fig. 1) is frequently consumed freshly which resulted in huge numbers of wastes, especially from pericarp and seed, therefore, it is interesting to take benefit by exploring the under-utilized part to be applied in commercial products of herbals, cosmetics, food supplements, and pharmaceutical products (Chaovanalikit et al., 2012).
Mangosteen is belonging to Family of Clusiaceae and commonly cultivated in regions of Southeast Asia such as Malaysia, Indonesia, Thailand, and Philippines as well India (Ji et al., 2017). Mangosteen fruit has become the export commodity due to pleasant taste, and the number of exports is increased annually (Muchtaridi et al., 2017). Some products containing pericarp extract of mangosteen are commercially available in herbal markets, including SidoMuncul SARI KULIT MANGGIS(R) and Mastin(R) from Indonesia, Mangosteen powder(R) and Mangosteen Xango from Malaysia, and Mangosteen pericarp Acne Cream(R) from Thailand (Limphapayom et al., 2017; Rohman et al., 2019a).
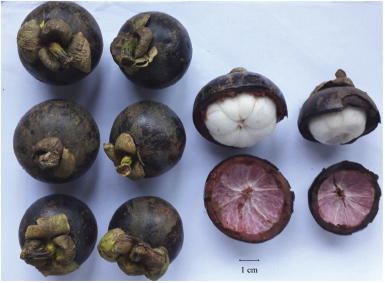 | Figure 1. Photographs of Mangosteen or G. mangostana L. fruit. [Click here to view] |
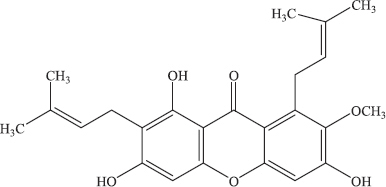 | Figure 2. The chemical structure of alpha-Mangostin (Ibrahim et al., 2016). [Click here to view] |
Some bioactive compounds having beneficial biological activities have been isolated and identified mainly from the class of phenolic acid, prenylated xanthone derivatives, anthocyanins, and procyanidins in which xanthone are present as major compounds (Suksamrarn et al., 2002; Zarena and Sankar, 2011). Alpha-Mangostin (Fig. 2), a member of xanthones with several pharmacological activities as reviewed by Ibrahim et al. (2016), including antibacterial, anti-inflammatory, antioxidants, and anticancer effects (Moongkarndi et al., 2003; Obolskiy et al., 2009; Tanaka et al., 1996), is a major compound used as chemical marker during the standardization of mangosteen pericarp extract, therefore, some analytical methods have been developed for quantitative analysis. Such methods for determination of alpha-Mangostin included ultraviolet-visible spectroscopy (Pothitirat and Gritsanapan, 2008), liquid chromatography using photodiode array detector (PDA) at wavelength of 240 nm (Yodhnu et al., 2012) and at 320 nm (Ji et al., 2007) as well as ultraviolet–visible (UV–vis) detector (Muchtaridi et al., 2016). UV–vis spectroscopy is a lack of specificity, whereas liquid chromatography needs complex instrument and extensive sample preparation, therefore, specific and simple method using Fourier transform infrared (FTIR) spectroscopy is developed.
FTIR spectroscopy combined with multivariate calibration offered rapid, simple and fingerprint analytical method for qualitative and quantitative analyses of phytochemicals in herbal (Rohman et al., 2019b). This method is successfully applied for the analysis of gartanin in mangosteen pericarp extract (Muchtaridi et al., 2019), however, using extensive literature review, there is no scientific report on the application of FTIR spectroscopy in combination with multivariate analysis to quantify alpha-mangostin. Therefore, the objective of this study was to develop FTIR spectroscopy-multivariate calibration for quantitative analysis of alpha-mangostin and to classify mangosteen pericarp using principal component analysis.
MATERIALS AND METHODS
Mangosteen fruit was obtained from several locations, namely, west Java, Central java, Yogyakarta, and West Sulawesi (Republic of Indonesia) to cover the difference in alpha-mangostin composition due to location variation.
Preparation of ethanolic extract of mangosteen pericarp
The extract was prepared according to Wulandari et al. (2018). The pericarp was cut into small and dried using sun drying and then powdered using a commercial blender and subjected to sieving using mesh 40. The powder (approximately 50 g) was macerated by 500 ml ethanol 90% for two days using the maceration technique with immediate shaking every day. The macerate obtained was then filtered and the supernatant was evaporated using a vacuum rotary evaporator at 50°C to obtain an ethanolic extract. The extracts were then subjected to high performance liquid chromatography (HPLC) analysis for the determination of alpha-mangostin and FTIR spectroscopic measurement.
Liquid chromatography condition
HPLC analysis of alpha-mangostin was performed using Shimadzu HPLC instrument-LC-20AD (Tokyo, Japan) equipped with a Rheodyne7725i injection valve with a 20 μl loop volume and Binary gradient pump was used. The detector used was a photodiode array (Shimadzu, SPD-M20A) at a wavelength of 240 nm. Data were acquired and processed by the software of LC-solution. An approximately 5 mg ethanolic extract of mangosteen pericarp was accurately weighed, placed into 10 ml volumetric flask and dissolved in methanol. The solution was subjected to sonication filtered using Millipore filter paper 0.45 μm. The separation was carried out using reversed phase column of RP 18 Waters® X-Bridge (250 mm × 4.6 mm i.d.; 5 μm). The mobile phase composition was 0.2% formic acid–acetonitrile (30:70, v/v) in an isocratic manner at a flow rate of 1.0 mL/min. The injection volume was 20 μl (Muchtaridi et al., 2019).
Analysis of ethanolic extract of Mangosteen pericarp
The ethanolic extract of mangosteen pericarp was directly placed on the sampling accessory of horizontal Attenuated Total Reflectance, which composed of zinc selenide (ZnSe) crystal at controlled ambient temperature (25°C) according to Prabaningdyah et al. (2018). All FTIR spectra were scanned using an FTIR spectrophotometer (Nicolet 6700 FTIR spectrometer, Thermo Nicolet Corp, Madison, WI) and equipped with deuterated triglycine sulfate detector and beam splitter of potassium bromide (KBr)/Germanium. The instrument was connected to the software of the OMNIC operating system (Version 7.0, Thermo Nicolet, Madison, WI). Spectra of FTIR were scanned in wavenumbers region of 4,000–650 cm–1 with a resolution of 8 cm–1 and a number of scanning of 32. All spectra were calibrated using the background of the air spectrum as reference. After every scan, a new reference air background spectrum was taken. These spectra were recorded absorbance values at each data point in triplicate.
Statistical analysis
The correlation between the actual value of alpha-mangostin as determined using HPLC and FTIR spectroscopy was assisted by PLS using software TQ Analyst software version 7.0 (Thermo electron Corporation, Madison, WI) included in instrument of FTIR spectrophotometer. Some statistical parameters were evaluated namely coefficient determination (R2) for model accuracy as well as Root Mean Square Error of Calibration (RMSEC) and Root Mean Square Error of Predicted (RMSEP) for precision evaluation. In addition, classification among mangosteen pericarp extract was performed using unsupervised pattern recognition of principal component analysis (PCA), as analyzed by Minitab® version 17 (Minitab Inc., USA).
RESULTS AND DISCUSSION
Liquid chromatography in combination with photo-diode array detector (LC-PDA) at 240 nm is a method of choice for quantitative analysis of alpha-mangostin in mangosteen pericarp due to its capability to separate alpha-mangostin from other components and then quantify it (Ghasemzadeh et al., 2018; Muchtaridi et al., 2017). LC-PDA is also an official method for the analysis of complex mixture such as extract, therefore, in this study, LC-PDA was used for the analysis of alpha-mangostin and used as actual values. Figure 2 is LC-PDA chromatogram obtained during the analysis of an ethanolic extract of mangosteen pericarp in which alpha-mangostin was well separated from others. However, LC-PDA needs extensive sample preparation, and some rapid and reliable method based on fingerprint analytical technique of FTIR spectroscopy was developed to analyze alpha-mangostin in extract samples.
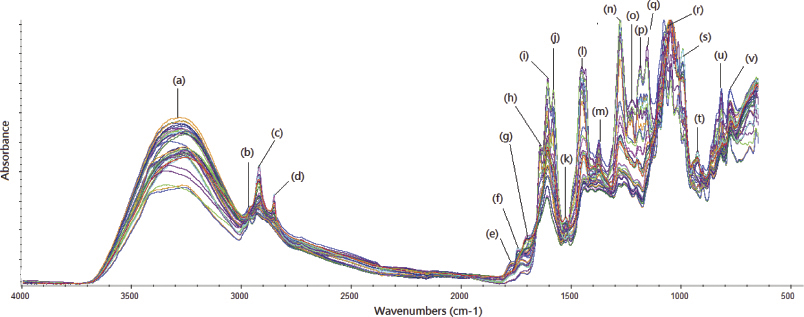 | Figure 3. FTIR spectra of ethanolic extract of pericarp mangosteen scanned at mid infrared region (4,000–650 cm–1) using attenuated total reflectance mode. [Click here to view] |
FTIR spectroscopy in combination with the multivariate calibration of partial least square emerged as a powerful analytical technique even in the complex samples (Rohman et al., 2015). PLS was employed for making the correlation between actual content values of alpha-mangostin as determined using HPLC and FTIR predicted values using absorbance values at optimized wavenumbers. PLS is a multivariate calibration technique based on inverse calibration in which concentration (y-axis) was modeled with factors (combination of absorbance variables) in x-axis (Miller and Miller, 2005). Figure 3 shows normal FTIR spectra of ethanolic extract of mangosteen pericarp obtained from several locations at mid-infrared region corresponding to wavenumbers of 4,000–650 cm–1 along with prominent peaks due to infrared absorption. Table 2 compiles the functional groups responsible for infrared absorption, which can be correlated by chemical compounds present in the ethanolic extract of mangosteen pericarp.
Determination of alpha-mangostin using the combination of FTIR spectra and PLS was performed by preparing calibration samples from 25 regions, and then the calibration model was used to predict validation samples (15 samples). The development of calibration model was initialized by optimizing the wavenumber regions of FTIR spectra having acceptable models as indicated by high coefficient correlation and low calibration errors (Lestari et al., 2017). The selection of wavenumbers was provided by the TQ Analyst software by exploring the variation among absorbance values in FTIR spectra of samples. The wavenumbers region of 3,825–937 cm–1 was preferred for the prediction of alpha-mangostin.
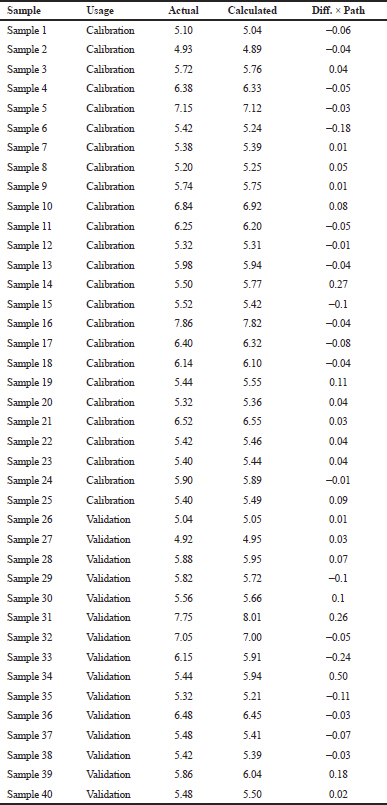 | Table 1. The actual values of alpha-mangostin as determined by HPLC and FTIR calculated values in ethanol extract samples of mangosteen pericarp. [Click here to view] |
Figure 4A shows the PLS model for correlation between actual values of alpha-mangostin (x-axis) as determined by LC-PDA and FTIR predicted values at wavenumbers of 3,825–937 cm–1 yielding the linear regression with coefficient correlation (r) of 0.9927 with low error expressed by RMSEC or root mean square error of calibration of 0.0831%. High r-value and low RMSEC value indicated that the calibration model was a reliable model for the prediction of validation samples and an independent sample tested using the calibration model. The validation models also exhibited the accurate and precise results for the prediction of alpha-mangostin with an r-value of 0.9754 and RMSEP value of 0.174%. Figure 4B exhibited the residual analysis describing the difference between actual values and predicted values of alpha-mangostin. The scatter plot revealed that errors occurring during modeling were randomly occurred zero difference. This indicated that the systematic errors did not exist and the model developed is reliable to predict alpha-mangostin in the ethanolic extract of mangosteen pericarp (Irnawati et al., 2020).
 | Table 2. The functional groups are responsible for the IR absorption of the ethanolic extract of mangosteen pericarp (Muchtaridi et al., 2019a; Rohman et al., 2017). [Click here to view] |
The developed method, FTIR spectroscopy combined with the multivariate calibration of PLS, appeared as a new promising method for rapid quantitative analysis of alpha-mangostin in pericarp mangosteen extract based on analytical performance (accuracy and precision). However, this method has a main drawback. If the composition of extracts is different, FTIR spectra of analyzed extract will also be different. As a consequence, alpha-mangostin present in the different extract samples is quantified using different spectral regions with a new model of multivariate calibration for correlating the actual values of alpha-mangostin and predicted model using FTIR spectroscopy (Mackie et al., 2016).
PCA, one of the unsupervised pattern recognitions, is used for the classification of ethanolic extract of mangosteen pericarp from different regions. Figure 4 shows the score plot expressed by the first principle component and the second principle component to classify samples. Based on the score plot, the analyzed samples could be divided into six groups.
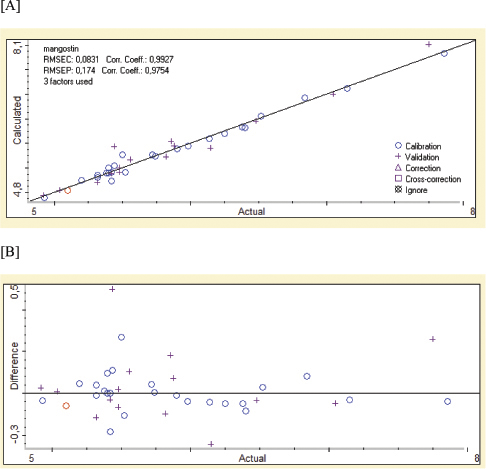 | Figure 4. The relationship between actual values (x-axis) of alpha-mangostin in x-axis and the predicted values of alpha-mangostin using FTIR spectroscopy (A) along with residual analysis (B). [Click here to view] |
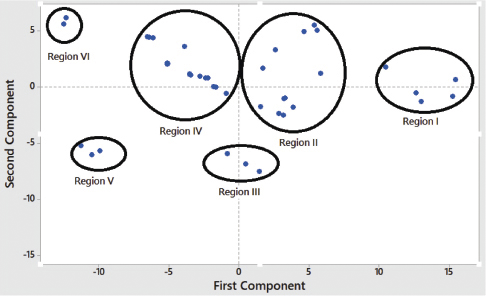 | Figure 5. Principal component analysis of ethanolic extract of mangosteen from different regions. [Click here to view] |
CONCLUSION
FTIR spectroscopy using wavenumbers region of 3,825–937 cm–1 offered reliable technique for quantification of alpha-mangosteen in the ethanolic extract of mangosteen pericarp from different regions. The correlation model between actual values of alpha-mangostin as determined by reversed phase HPLC and FTIR predicted values using partial least square calibration was reliable, as indicated by acceptable accuracy (high coefficient correlation) and precision (low values of RMSEC and root mean square error of prediction). Principal component analysis at the selected fingerprint of 1,000–800 cm–1 could classify mangosteen pericarp from different regions.
ACKNOWLEDGMENT
The authors would like to thank the Consortium of World Class Research University for financial support through Program Penelitian Kolaborasi Indonesia 2019 with contract number 2053/UN1.PIII/DIT-LIT/LT/2019.
CONFLICTS OF INTEREST
Authors declare that they have no conflicts of interest.
REFERENCES
Aisha AFA, Abu-Salah KM, Ismail Z, Majid AMSA. In vitro and in vivo anti-colon cancer effects of Garcinia mangostana xanthones extract. BMC Complement Altern Med, 2012; 12:1–10. CrossRef
Chaovanalikit A, Mingmuang A, Kitbunluewit T, Choldumrongkool N, Sondee J. Anthocyanin and total phenolics content of mangosteen and effect of processing on the quality of mangosteen products. Int Food Res J, 2012; 19:1047–53.
Ghasemzadeh A, Jaafar HZE, Baghdadi A, Tayebi-Meigooni A. Alpha-mangostin-rich extracts from Mangosteen Pericarp: optimization of green extraction protocol and evaluation of biological activity. Molecules, 2018; 23(8):1852. CrossRef
Ibrahim MY, Hashim NM, Mariod AA, Mohan S, Abdulla MA, Abdelwahab SI, Arbab IA. Review α-mangostin from Garcinia mangostana Linn: an updated review of its pharmacological properties. Arab J Chem, 2016; 9:317–29. CrossRef
Irnawati, Riyanto S, Martono S, Rohman A. The employment of FTIR spectroscopy and chemometrics for authentication of pumpkin seed oil from sesame oil. Food Res, 2020; 4:42–8. CrossRef
Ji X, Avula B, Khan IA. Quantitative and qualitative determination of six xanthones in Garcinia mangostana L. by LC–PDA and LC–ESI-MS. J Pharm Biomed Anal, 2007; 43:1270–6. CrossRef
Khoo HE, Azlan A, Kong KW, Ismail A. Phytochemicals and medicinal properties of indigenous tropical fruits with potential for commercial development. Evid Based Complement Alternat Med, 2016; 1–20. CrossRef
Lestari HP, Martono S, Sudjadi, Rohman A. Simultaneous analysis of Curcumin and demethoxycurcumin in Curcuma xanthorriza using FTIR spectroscopy and chemometrics. Int Food Res J, 2017; 24(5):2097–101.
Limphapayom W, Satayawut K, Wattanavichit W, Pisalwadcharin A, Sukhasem S. Development of technologies for xanthone powder production from mangosteen. International Symposium on Durian and Other Humid Tropical Fruits. Acta Hortic, 2017; 1186:185–8. CrossRef
Mackie DM, Jahnke JP, Benyamin MS, Sumner JJ. Simple, fast, and accurate methodology for quantitative analysis using Fourier transform infrared spectroscopy, with bio-hybrid fuel cell examples. Methods X, 2016; 3:128–38. doi:10.1016/j.mex.2016.02.002 CrossRef
Miller JN, Miller JC. Statistics and chemometrics for analytical chemistry. 5th edition, Pearson Education Limited, Edinburgh, UK, 2005.
Moongkarndi P, Kosem N, Kaslungka S, Luanratana O, Pongpan N, Neungton N. Antiproliferation, antioxidation and induction of apoptosis by Garcinia mangostana (mangosteen) on SKBR3 human breast cancer cell line. J Ethnopharmacol, 2004; 90:161–6. CrossRef
Muchtaridi M, Puteri NA, Milanda T, Musfiroh I. Validation analysis methods of A-mangostin, Γ-mangostin, and gartanin Mixture in mangosteen (Garcinia mangostana L.) fruit rind extract from West Java with HPLC. J App Pharm Sci, 2017; 7(10):125–30.
Muchtaridi M, Suryani D, Qosim WA, Saptarini NM. Quantitative analysis of α-mangostin in mangosteen (Garcinia mangostana L.) pericarp extract from four district of west java by HPLC method. Int J Pharm Pharm Sci, 2016; 8:232–6.
Muchtaridi, Pratiwi R, Alam, G, Rohman A. Analysis of gartanin in extract of Mangosteen pericarp fruit (Garcinia mangostana L.) using spectrophotometric Fourier Transform Infrared (FTIR) method. Rasayan J Chem, 2019; 12(2):874–9. CrossRef
Obolskiy D, Pischel I, Siriwatanametanon N, Heinrich M. Garcinia mangostana L.: a phytochemical and pharmacological review. Phytother Res, 2009; 23:1047–65; doi:10.1002/ptr.2730 CrossRef
Pothitirat W, Gritsanapan W. Quantitative analysis of total mangostins in Garcinia mangostana fruit rind. J Health Res, 2008; 22(4):161–6.
Prabaningdyah NK, Riyanto S, Rohman A. Application of FTIR spectroscopy and multivariate calibration for analysis of curcuminoid in syrup formulation. J Appl Pharm Sci, 2018; 8(03):172–9.
Rohman A, Sudjadi D, Ramadhani D, Nugroho A. Analysis of curcumin in Curcuma longa and Curcuma xanthorriza using FTIR spectroscopy and chemometrics. Res J Med Plant, 2015; 9:179–86. CrossRef
Rohman A, Rafi M, Alam G, Muchtaridi M, Windarsih A. Chemical composition and antioxidant studies of underutilized part of mangosteen (Garcinia mangostana L.) fruit. J Appl Pharm Sci, 2019a; 9(08):047–52.
Rohman A, Windarsih A, Hossain MAM, Johan MR, Ali ME, Fadzilah NA. Application of near- and mid-infrared spectroscopy combined with chemometrics for discrimination and authentication of herbal products: a review. J Appl Pharm Sci, 2019b; 9(03):137–47. CrossRef
Suksamrarn S, Suwannapoch N, Ratananukul P, Aroonlerk N, Suksamrarn A. Xanthones from the green fruit hulls of Garcinia mangostana. J Nat Prod, 2002; 6:761–3. CrossRef
Tanaka, Asai F, Kobayashi Y, Shimano R, Miyauchi K. Antibacterial activity of xanthones from guttiferaeous plants against methicillin-resistant Staphylococcus aureus. J Pharm Pharmacol, 1996; 48:861–5. CrossRef
Wulandari R, Sudjadi, Martono S, Rohman A. Liquid chromatography and Fourier Transform Infrared spectroscopy for quantitative analysis of individual and total curcuminoid in Curcuma longa extract. J Appl Pharm Sci, 2018; 8(09):107–13. CrossRef
Yodhnu S, Sirikatitham A, Wattanapiromsakul C. Validation of LC for the determination of α-mangostin in Mangosteen Peel Extract: a tool for quality assessment of Garcinia mangostana L. J Chromatogr Sci, 2009; 47:185–9. CrossRef
Zarena AS, Sankar KU. Xanthones enriched extracts from mangosteen pericarp obtainedby supercritical carbon dioxide process. Sep Purification Technol, 2011; 80:172–8. CrossRef