INTRODUCTION
Vardenafil (2-{2-ethoxy-5-[(4-ethylpiperazin-1-yl)sulfonyl]phenyl}-5-methyl-7-propyl-1H,4H-imidazo[4,3-f][1,2,4]triazin-4-one) is a representative of the class of phosphodiesterase type 5 inhibitors (PDE5). In medical practice, it is used to treat erectile dysfunction (ED) (Bruzziches et al., 2013; Eve, 2009) and undergoes clinical trials for the treatment of pulmonary arterial hypertension (Jing et al., 2011; Karasu-Minareci et al., 2012).
PDE5 inhibitors, including vardenafil, are a part of the dietary supplements (DS) used to treat ED (Al-Tahami, 2014; Gilard, 2015; Reeuwijk et al., 2013; Singh et al., 2009; Walker et al., 2016). The availability of different DS in the pharmaceutical market, the ability of patients to purchase these medications in online stores, and the lack of knowledge about the presence of PDE5 inhibitors in the DS may have negative effects, especially in case there are contraindications to their use (Chiang et al., 2017; Jackson et al., 2011; Schnetzler et al., 2010).
In medical practice, PDE5 inhibitors should not be combined with nitrovasodilators and inhalation forms of alkyl nitrites—amyl nitrite, butyl nitrite, and isobutyl nitrite (DeBusk et al., 2000; Kostis et al.,2005). Due to the potentiation of the vasodilating effect, the combined use of drugs from these two pharmacological groups leads to an unpredictable decrease in blood pressure, the development of critical uncontrolled hypotension and sudden death (European Medicines Agency, 2010; Kloner RA, 2014; Kloner ÐR, Henderson L., 2013; Katlowitz and De Rosalio, 2007).
The concentration of vardenafil in blood and plasma is quite high after taking this drug. The literature describes a number of analytical techniques for drug control in these biological fluids. In particular, analytical techniques using fluorimetry (Abu El-Enin et al., 2016), high-performance liquid chromatography (HPLC) with fluorescence detection are described (Cheng et al., 2007), HPLC-UV (Carlucci et al., 2009; Xiao et al., 2013), HPLC- mass spectrometry (MS) (Johnson et al., 2007); LC-MS/MS (Lakea et al., 2010; Rust et al., 2012), UPLC-MS/MS (Proença et al., 2013), and GC-MS (Papoutsis et al., 2011).
According to literature, 2%–6% of the administered dose of vardenafil is excreted with the urine (Bayer Inc, 2015). Therefore, the concentration of vardenafil in this biological matrix is low. Few techniques for the determination of vardenafil and its metabolites in urine have been described. In particular, the determination of vardenafil and its metabolite, desethyl vardenafil, was performed by GC-MS. Extraction from the urine was carried out by liquid extraction, and the extracted compounds were converted to trimethylsilyl derivatives (Strano-Rossi et al., 2010).
There is also a study to detect vardenafil and desethyl vardenafil in urine and blood of volunteers by LC-MS/MS after purification of biological samples using SPE Oasis HLB cartridges (Hasegawa et al., 2012).
Therefore, the purpose of the study was to develop a bioanalytical method for the quantitative determination of vardenafil in rat urine by the HPLC-MS in the presence of metabolites, which could be used for toxicological studies and in the practice of forensic chemical analysis of this biological matrix.
MATERIALS AND METHODS
Chemicals and reagents
Vardenafil hydrochloride trihydrate [≥98% (HPLC), Sigma-Aldrich, USA] and sildenafil citrate—internal standard (Sigma-Aldrich, USA) were used to prepare a series of standard and working solutions.
Nearly, 5 mg of Levitra tablet, Bayer Pharma, were used to prepare solutions administered orally into rats.
Methanol, acetonitrile, orthophosphate acid, and formic acid were of analytical “HPLC” grade (≥99.9%, Sigma-Aldrich, USA). 1,2-dichloroethane and sodium hydroxide were of analytical grade (Merck). The bidistilled water was purified using a Milli-Q purification system (Millipore; Vienna, Austria).
Equipment
Vortex MSV-3500, (Biosan, Latvia) was used for mixing solutions.
Evaporation of organic solvents was performed at 40°C using a TurboVap® Classic LV evaporator (Biotage, Sweden).
Centrifugation was performed on a Sigma 3-16KL refrigerated centrifuge.
The pH control was performed using PH-200 pH-meter (HM Digital, USA) with automatic temperature compensation.
Solid-phase extraction was performed using Oasis HLB cartridges 30 mg (Waters, USA).
Chromatographic conditions
Experimental studies were carried out on the Agilent 1260 Infinity HPLC System liquid chromatograph (Agilent Technologies, USA) with OpenLAB CDS Software.
Chromatographic separation was carried out on a Zorbax SB-C18 reversed-phase column (50 mm × 2.1 mm, 1.8 μm). Composition of the mobile phase: 0.1% aqueous formic acid solution (solution A), 0.1% solution of formate acid in acetonitrile (solution B). The ratios between the volume of A and B solutions in the mobile phase during the analysis were as follows: from the start till 10 minutes—95:5; from 10 to 15 minutes—0:100; 15 minutes—100% of B solution. The mobile phase was given in linear gradient mode, at a rate of 0.4 ml/minute. The column temperature was 40°C. Duration of the analysis was 25 minutes.
Detection of vardenafil and sildenafil in samples was performed using Agilent 6120 single quadrupole mass spectrometer with electrospray ionization.
Mass spectral analysis was performed in the m/z range: 50–500 with the fragmentation of 50 m/z under positive ionization. Ion source for mass spectrometric detection: API-ES. The temperature of nitrogen (gas drier) was 300°C; pressure on a nebulizer was 40 psi, speed of nitrogen in an ion source—10 l/minute.
Animal experiments
Two groups of animals were selected for the study: control and study [10 rats each (males) weighing 190–200 g]. The study and control group of animals had free access to food and water. The rats’ urine from both groups was collected for 24 hours.
The study group of animals was administered an aqueous suspension of “Levitra” for 0.28 mg/kg once. The aqueous suspension was obtained by dissolving the Levitra tablets (5 mg) in 10 ml of water. Nearly, 5 ml of urine were taken for one study.
The rats were kept at the Vivarium Center of Danylo Halytsky Lviv National Medical University. Experiments adhered to ethical standards and approved by the ethical committee of mentioned university (Approval File No. 1/2015).
Animal urine was analyzed immediately after collection or stored in a frozen state until used.
Preparations of standard and sample solutions
Standard solutions of vardenafil (1 mg/ml) and sildenafil (internal standard, 1 mg/ml) were prepared by dissolving the accurately weighed quantity of standard substances in methanol (solutions A). Obtained standard solutions can be used within 3 months, keeping them at 4°C in a dark place.
Methanol solutions of vardenafil and sildenafil containing 10 μg/ml (solution B) were prepared from standard solutions A. A solution of vardenafil containing 1 μg/ml (solution C) was prepared by diluting the solution B in methanol.
For analysis, three parallel series of urine samples with a concentration of vardenafil from 7 to 500 ng/ml (7.0, 50.0, 100.0, 200.0, 300, 400, and 500.0 ng/ml) was prepared. To do this, 100 μl of internal standard (solution B) and 35.0 and 250.0 μl of a solution of vardenafil at a concentration of 1 μg/ml (solution C) and 50.0, 100.0, 150.0, 200.0, and 250 μl of vardenafil solution at a concentration of 10 μg/ml (solution B) were added to 3 ml of pure rat urine. The volumes of biological fluid were adjusted to 5 ml with urine. Samples were stirred for 3 minutes in an orbital shaker and then incubated at 37°C for 60 minutes.
The obtained solutions were used to construct calibration graphs using the internal standard method in the concentration range of 7–500 ng/ml. Similarly, urine specimens were prepared for validation of the method, in which the vardenafil concentration was 7, 200, and 500 ng/ml, and each was subjected to 100 μl of the internal standard. Model samples and validation solutions were subjected to further sampling according to the scheme described below.
Sample preparation
The urine samples were adjusted to pH 7.5 with 30% sodium hydroxide solution, followed by double extraction with 1,2-dichloroethane (5 ml), the duration of single extraction was 10 minutes. The combined dichloroethane fractions were evaporated to dryness. The dry residue was dissolved in 0.4 ml of methanol and diluted to 2 ml with water. The entire volume of the methanol-water solution was purified through SPE cartridges. The cartridges were conditioned with 1 ml of methanol and 1 ml of distilled water. After the test was added, the columns were washed with 2 ml of a universal buffer solution (pH 7.4) and 1 ml of distilled water. Within 5 minutes, the sorbent was dried in a stream of nitrogen; elution was performed with 2 ml of methanol. The speed of all liquids passing through the sorbent was 1 ml/minute. The resulting eluate was evaporated to dryness in a stream of nitrogen and dissolved in 500 μl of methanol. Nearly, 10 μl methanol solution was injected into the chromatograph.
Control urine samples were examined in parallel according to the same mode.
METHOD VALIDATION
Validation of the elaborated technique for the quantitative determination of vardenafil in urine was carried out in accordance with the FDA and EMA guidelines on validation of bioanalytical methods (European Medicines Agency, 2011; Food and Drug Administration, 2013).
Specificity
To prove the specificity of the technique, the chromatograms of control samples of rat urine and those added to the internal standard and working solutions of vardenafil were compared. The concentration of the working solution of vardenafil corresponded to the lower range of the quantitative determination—7 ng/ml, and sildenafil—200 ng/ml.
Linearity and range
The linearity of the method was studied on model urine mixtures in the range of concentrations of vardenafil 7–500 ng/ml.
Applying the least squares method, the equation of the line, which describes the relationship between the ratio of peak areas of vardenafil to the internal standard (sildenafil) and the concentration of vardenafil in urine, ng/ml, was calculated. The limit of detection (LOD) was determined on five model urine samples with a signal-to-noise ratio of at least 3:1. The limit of quantification (LOQ) was defined as the lowest concentration of vardenafil, which can be accurately measured [coefficient of variation (CV) of less than 20%]. The study was conducted on five model urine samples containing 7 ng/ml vardenafil and 200 ng/ml sildenafil (internal standard), independent of the calibration curve.
 | Figure 1. Chromatogram of drug-free urine samples. [Click here to view] |
Matrix effects
The matrix effect is a direct or non-direct change in the instrument signal due to the presence of other analytes in the sample. In the study of this criterion, six series of biological matrices (urine) were used. The influence of the biological matrix on the ionization efficiency of the analyte and the internal standard was calculated by analyzing the ratio of the peak area of the analyte in the biological sample to the peak area of the analyte in the methanol solution. Normalized by the internal standard, the matrix effect was determined as the ratio of the matrix effect of the analyte to the matrix effect of the internal standard. The matrix effect was studied on the lower (7 ng/ml), middle (200 ng/ml), and upper (500 ng/ml) levels of vardenafil concentrations.
Accuracy and precision
To determine the accuracy and precision of urine samples, the amounts of vardenafil were given, which corresponded to the lower range of quantitative analysis by this method (7 ng/ml), middle (200 ng/ml), and upper level of concentration (500 ng/ml), as well as 200 ng/ml of sildenafil (internal standard). Six samples were prepared with each concentration level.
Concentrations of medications in samples were calculated by the equation of calibration graphs; afterward, the obtained values of concentrations were compared with their nominal value.
Samples were analyzed on the day of preparation and 24 hours after (samples were stored at 4°C).
The degree of extraction of vardenafil from the urine was determined by calculating the ratio of the amount of vardenafil extracted from the biological sample to the amount introduced into the dry residue of the control sample. The same concentration levels were used to determine the accuracy and precision; six samples for each level were prepared.
The short-term and long-term stability of vardenafil, as well as the stability of vardenafil during three freeze-defrost cycles, were studied on model urine samples containing 7 and 500 ng/ml of the medication.
RESULTS
Identification of vardenafil on chromatograms was carried out in absolute retention time, which was 5.820 ± 0.085 minutes under the described conditions of the analysis and the mass spectrum. The retention time of the internal standard (sildenafil) was 6.103 ± 0.052 minutes.
Urine sample chromatogram without medications, as well as urine sample chromatogram with vardenafil concentration of 300 ng/ml and the internal standard (sildenafil) of 200 ng/ml, are shown in Figures 1 and 2. The mass spectra of vardenafil and sildenafil are shown in Figures 4 and 5.
 | Figure 2. Chromatogram of model urine samples, containing 300 ng/ml vardenafil (1) and 200 ng/ml internal standard (sildenafil) (2). [Click here to view] |
 | Figure 3. A representative chromatogram of urine samples of rats treated Levitra, Bayer Pharma (1—vardenafil, 2—internal standard (sildenafil)). [Click here to view] |
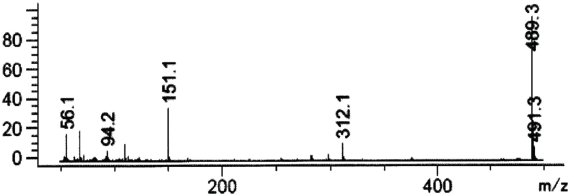 | Figure 4. Mass spectrum of vardenafil in SCAN mode 50–500 m/z (fragmentation 50 m/z). [Click here to view] |
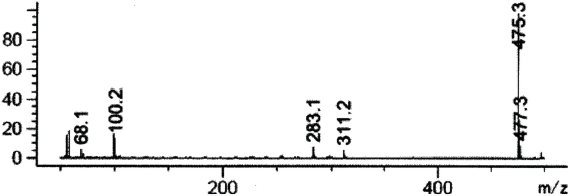 | Figure 5. Mass spectrum of sildenafil in SCAN mode 50–500 m/z (fragmentation 50 m/z). [Click here to view] |
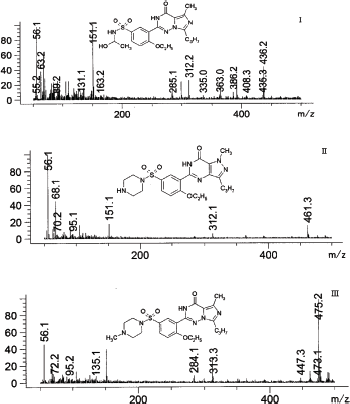 | Figure 6. Mass spectra of vardenafil extracted from rats urine: I—2-[2-ethoxy-5-(1-hydroxyethyl-amino)sulfonyl]phenyl}-5-methyl-7-propyl-1H,4H-imidazo[4,3-f][1,2,4]triazin-4-one (tR = 4.722 minutes), II—desethyl vardenafil (tR = 5.144 minutes), III—desmethyl vardenafil. (tR = 5.448 minutes). [Click here to view] |
The proposed method for the extraction and determination of vardenafil was used to analyze urine specimens of laboratory rats taking the study medication.
At the same time, the results obtained after the analysis of model urine samples containing vardenafil (Fig. 2) biological fluid samples of rats taking Levitra (Fig. 3) were compared with samples of pure rat urine (Fig. 1). Major metabolites were noted on the chromatograms of urine samples of rats taking Levitra, the peaks of which deviated and were absent on the chromatograms of control urine samples. Their identification was carried out with the obtained mass spectra.
The retention time of the metabolites was 4.72 minutes—degradation product of the piperazine cycle: 2-[2-ethoxy-5-(1-hydroxyethyl-amino)sulfonyl]phenyl}-5-methyl-7-propyl-1H,4H-imidazo[4,3-f][1,2,4]triazin-4-one, 5.14 minutes—desethyl vardenafil and 5.45 minutes—desmethyl vardenafil. Mass spectra of extracted metabolites are shown in Figure 6.
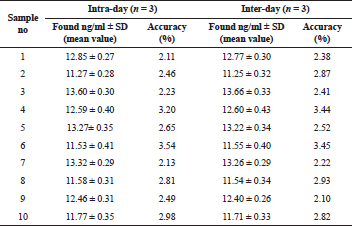
From 11.27 ± 0.28 to 13.60 ± 0.30 ng of vardenafil in 1 ml of daily urine of animals were determined by the proposed method. The total metabolites were about 50% of the concentration level of the medication.
Specificity
In the analysis of urine specimens, chromatograms do not show peaks with the retention time corresponding to vardenafil, its metabolites, and sildenafil.
The mass spectrum of vardenafil extracted from the urine corresponds to the mass spectrum of the standard sample of vardenafil and it is characterized by such signals of ions—489, 491 m/z.
Linearity and range
Quantitative analysis was carried out by the internal standard method. Applying the least squares method, the equation of the line, which describes the relationship between the ratio of peak areas of vardenafil to the internal standard and the concentration of vardenafil in urine, ng/ml, was calculated. The linear dependence for vardenafil was in the range of 7–500 ng/ml. The equation of the calibration graph in the concentration ranges from 7 to 500 ng/ml is described by the dependence Y = 0.0038 X − 0.0116, where: Y—the ratio between peak areas of vardenafil and internal standard, X—concentration of vardenafil, ng/ml.
The LOD of vardenafil by HPLC/MS on chromatograms was determined by the signal-to-noise ratio of 3:1 and the LOQ by the ratio of 5:1. The LOD of vardenafil was 5 ng/ml and the LOQ was 7 ng/ml.
Accuracy and precision
The results of the precision and accuracy of the evaluation of vardenafil in urine samples by the HPLC-MS are presented in Table 1, and in the urine of the rats taking Levitra tablets in Table 2. The developed method is accurate and reproducible since the data are repeatable within one day and on different days.
Matrix effects
The matrix effect, normalized by the internal standard for six samples of biological fluid, is on average 1.14; the average absolute deviation of the matrix effect is 2.54. According to the recommendations on validation, the CV of the matrix effect, normalized by the internal standard for six samples of urine, should not exceed 15%. The obtained results meet the established criteria and indicate the absence of the influence of endogenous components on the results of the quantitative determination of vardenafil in the biological matrices under study. The degree of extraction of vardenafil from urine and normalized matrix effects (n = 6) are given in Table. 3
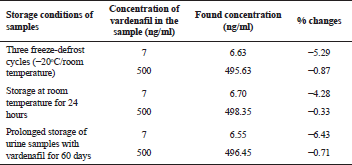
Stability
Vardenafil was stable in model urine samples stored at room temperature for 24 hours. Three freeze-defrost cycles of urine samples with vardenafil also demonstrated the stability of the medication. The deviation also did not exceed the permissible standards with prolonged storage of urine samples with vardenafil (within 60 days). The results of the studies are presented in Table 4.

