
INTRODUCTION
Liver diseases become one of the major world health problems, and the death rate caused by this disease is rising rapidly in the US over the last decade (Reinberg, 2018). There are various liver diseases, including metabolic disorder (Wilson’s disease and hemochromatosis), infection (virus, bacteria, fungi, and amoeba), liver cirrhosis, liver cancer, autoimmune, and xenobiotic substances (Anand and Lal, 2016). A comprehensive data about the amount of each kind of liver diseases in Indonesia is still limited except for hepatitis which its prevalence increases two times during 5 years (0.2% in 2013 and 0.4% in 2018) (NiHRD RI, 2019).
Regardless of the liver diseases causal, inflammation is considered as the main causes of progression of the disease chronicity (Marcellin and Kutala, 2018). Oxidants affect all stages of the inflammatory; moreover, the undoubted evidences emphasize that oxidative stress plays a crucial role in the development of inflammation (Lugrin et al., 2014). Stress oxidative induced by various factors contributes to the initiation and progression of liver diseases. A condition in which this disturbance continues to occur resulting in severe liver diseases. Extra-hepatic organs damages, such as brain impairment and kidney failure, are among other consequences of systemic oxidative stress arising during liver diseases (Li et al., 2015).
The external exposures (environmental pollutants/toxicant and irradiation), the aging process, pathological incidents, and other factors are unavoidable events, leading to oxidative stress (Pandey and Rizvi, 2012). Therefore, maintaining a balanced state of oxidant and antioxidant to prevent oxidative stress is a crucial part of reasonable health maintenance (Sochor et al., 2010). Plants produce various phytochemicals which have a significant source of exogenous antioxidant as dietary intake (Chen et al., 2016), flavonoids, and phenolic compound are a reputable plant-derived antioxidant (Khoddami et al., 2013). Ethnobotanical/ethnopharmacological research has valuable roles in the pharmacological studies (McClatchey et al., 2009), even in discovering novel drugs (de Albuquerque, 2010; Ntie-Kang et al., 2013).
National Institute Health Research and Development Republic of Indonesia (NiHRD RI) has compiled enormous valuable metadata via “The Community Based Exploration of Local Knowledge of Ethno-medicine and Medicinal Plant in Indonesia” known as RISTOJA held in 2012, 2015, and 2017 (Widodo et al., 2019). According to that research, there were about 381 taxonomically identified species of plants had been used for liver disease medication by Indonesian ethnic traditional healer (IETH). Among these, three most frequently used plants for medication, this disease, were Bambusa vulgaris Schrad, Curcuma longa L., and Curcuma zanthorrhiza Roxb which taken apart as the main ingredient of 52, 42, and 41 potions by 42, 34, and 33 IETHs throughout Indonesia, respectively. Those plants are well-studied and known their reputable antioxidant properties. This present study, therefore, was intended to evaluate antioxidant activities of some selected medicinal plants used for liver diseases medication by IETHs from the metadata and its correlation with phenolics and flavonoid contents.
MATERIAL AND METHODS
Materials
Plant samples were collected from the Province of Aceh [Piper sp., Poikilospermum erectum (Blanco) Merr.], Central Java [Baccaurea racemosa (Reinw. Ex Blume) Müll.Arg., Chromolaena odorata (L.) R.M.King & H.Rob.., Litsea glutinosa (Lour.) C.B.Rob., Nenga pumila (Blume) H.Wendl., Paspalum conjugatum P.J.Bergius., Scaevola taccada (Gaertn.), Ipomoea pes-caprae (L.) R. Br.], Yogyakarta [Intsia bijuga (Colebr.) Kuntze, Peronema canescens Jack], and East Java (Stellaria vestita Kurz, Macaranga subpeltata K.Schum. & Lauterb, Capparis sepiaria L.). These plants were authenticated in MPTMRDC—NiHRD RI. Methanol, Folin-Ciocalteau’s phenol reagent (FCR), Acetic acid, AlCl3, NaCO3, FeCl3·6H2O, FeSO4·7H2O, L-(+)-ascorbic acid were obtained from E. Merck (Darmstadt, Germany). 2,2′-diphenyl-2-picrylhydrazyl (DPPH), 2,2′-azino-bis(3-ethylbenzothiazoline-6-sulfonic acid) (ABTS), 2,4,6-Tris(2-pyridyl)-s-triazine (TPTZ), Trolox, Gallic acid, Quercetin, and Rutin were purchased from Sigma (Aldrich, USA). All materials used were analytical grade.
Preparation of methanolic extract
Preparation of methanolic extract was performed according to Mistriyani et al. (2018). Sample plants were washed, drained, oven-dried (40°C), grounded, and sieved (60 mesh). Finely powdered plant materials were macerated using methanol (1:10 w/v) as extracting solvent. The samples were mixed with 60% volume of solvent for 3 days (stirred every 6 hours), the solids were filtered and re-macerated using 40% volume of solvent for 3 days. Extracts were concentrated using vacuum rotary evaporator (Buchi) and then oven-dried (40°C). The methanolic extracts were then subjected to evaluation of antioxidant activities, determination of phenolics content and flavonoid contents.
Quantification of total phenolic contents
Total phenolic contents (TPC) of methanol extracts of plant samples was measured using calibrated UV-Vis spectrophotometer (Multiskan Sky—Thermo Scientific, USA) as described by Cicco et al. (2009) with slight modifications. The final condition of the test solution: 40 mg extract, 4% methanol, 10% FCR, and 5% CaCO3. A 40 μl of plant extract (1 mg/ml; 1 mg dissolved in 1 ml methanol) was mixed with 360 μl of distilled water and 100 μl of FCR, and the solution was shaken and left for 2 minutes. The reaction was neutralized using 500 μl of 10% CaCO3 and mixed until homogeneous. The mixture was incubated for 20 minutes at 40°C. A 150-μl test solution was included in the microplate, and the absorbance was measured at wavelength 732 nm. The TPC is expressed as mg gallic acid equivalent/g of the extract through linear regression prepared from gallic acid standards at various concentrations (0, 5, 10, 15, 20, and 25 μg/ml).
Quantification of total flavonoid contents
Total flavonoid content (TFC) was measured spectrophotometrically according to Li et al. (2013) with slight modification. The reaction mixture consisted of 100 µl extract [1,250 μg/ml (w/v)], 150 µl solution of 0.1-M AlCl3 (blank without AlCl3 and replaced with methanol 150 µl), 350-µl ultra-pure dH2O, 250-µl acetate buffer (pH 3.8), and added with methanol up to a total volume of 1,250 µl. The test solution was incubated at 35°C for 30 minutes. TFC is expressed as rutin equivalents per g extract (mg RE/g) via generating a standard curve with a series concentrations of 0–100 μg/ml of rutin (x-axis) against absorbance (y-axis). A 150 μl of solution was pipetted into the microplate, and the absorbance was measured with a UV-Vis spectrophotometer at wavelength 398 nm.
DPPH radical scavenging activity
2,2′-diphenyl-2-picrylhydrazyl (DPPH) radical scavenging activity of the sample extracts was determined according to Sharma and Bhat (2009) with a slight modification. The reaction was prepared to 1.0 ml total volume with final concentrations of methanol extract (0–100 μg/ml) and DPPH (70 μM). Absorbance at 515 nm was measured after 25–60 minutes (based on prior determined operating time). The percentage inhibition activity was calculated using [(A0 – A1)/A0] × 100, where A0: the absorbance of the control and A1: the absorbance of the extract or standard. The inhibition curves were generated and IC50 values were calculated. L-(+)-ascorbic acid (Vitamin C) with final concentration 0–5 μg/ml was used as the standard antioxidant.
Trolox equivalent antioxidant capacity assay
The assay was performed according to Dong et al. (2015) as follows: a fresh ATBS∙+ working solution was made by dissolving 38.4 mg of ABTS in 10 ml 2.5 mM K2S2O8, mixed completely and kept in the dark (room temperature; 12–16 hours). The solution was then diluted with methanol to obtain 0.70 ± 0.02 absorbance. A standard curve was generated by making a series with concentrations of 0–45 mM of Trolox. Ten mg plant extracts were dissolved in 1 ml methanol, sonicated (15 minutes), and diluted to get 100 μg/ml.
Ferric reducing antioxidant power assay
The reducing ability of the plant extracts was estimated using the ferric reducing antioxidant power (FRAP) assay according to Benzie and Strain (1996) with minor modifications. The FRAP reagent was produced by mixing acetate buffer (300 mM; pH 3.6), 10 mM TPTZ solution in 40-mM HCl, and 20-mM FeCl3∙6H2O solution in a volume ratio of 10:1:1 prepared by daily basis preparation. FeSO4∙7H2O was used to generate a standard curve using final concentration 100–1,000 μM/ml. The reaction mixture in a microtube 2 ml contained 1,350 μl of FRAP reagent and 150 μl methanolic extract sample or standard antioxidants [Quercetin, L-(+)-ascorbic acid] solution. The tube was then incubated for 30 minutes at 37°C, and the absorbance was recorded at 595 nm. The FRAP value was calculated as M Fe2+/g of sample using ferric chloride standard curve.
Data analysis
Antioxidant assays using 2,2′-diphenyl-1-picrylhydrazyl (DDPH) scavenging activity, trolox equivalent antioxidant capacity (TEAC), and FRAP, as well as the determination of phenolics and flavonoid contents were performed in triplicates. All data were expressed as mean ± standard deviation and processed using Excel (Microsoft Inc., USA). The chemometrics of principal component analysis (PCA) was performed using Minitab version 17 (Minitab Inc., USA).
RESULTS AND DISCUSSION
Oxidative stress is considered as a causative factor of the emergence and development of degenerative disorders. It represents a physiological imbalance of the homeostatic system, which may be due to either an abnormal elevation of reactive oxygen species (ROS) or deficiencies in antioxidant defense systems. The liver is the most exposed organ of ROS, implies that oxidative stress often initiates liver damage; therefore antioxidant has a crucial role in preventing the onset of liver disease. Ethnomedicinal research allows obtaining many plants potential to be explored as antioxidants. Many plants used for treating liver disease were reported to have antioxidant activities (Widodo et al., 2009); therefore, it is necessary to confirm the antioxidant activities of selected medicinal plants in vitro using reliable methods such as radical scavenging activity and reducing power.
DDPH free radical scavenging is one of the accurate and the most frequently employed assay for evaluating antioxidant activity. The test was based on the bleaching of the violet solution of a stable free radical DPPH in methanol into pale yellow (Nur Alam et al., 2012). DPPH free radical in methanol has the maximum absorbance at 515 nm. The higher the radical-scavenging activity of the extract, the lower the absorbance value at 515 nm. The kinetic reaction between samples analyzed with DPPH free radical was monitored as a function of time to determine the operating time. Figure 1 revealed the relationship between absorbance changes (y-axis) as a function of reaction time, revealing that operating time was in about 30–90 minutes depending on plant samples, as indicated that the absorbance value was stable at these operating times (Table 1). DPPH radical scavenging activity was expressed by inhibitory concentration (IC50), defined as the concentration of plant sample extracts necessary to scavenge 50% of DPPH radical, calculated by an equation generated from linear regression. Among plant samples evaluated, S. vestita demonstrated the lowest scavenging capacity against DPPH, as showed by its highest IC50 value. This plant is endemic to the high mountainous area of Semeru and is only used by a the IETH of Tengger ethnic in the East Jawa. In addition, the highest DPPH antiradical activity was found in the methanolic extract of M. subpeltata, as indicated by the lowest IC50 value. In general, the IC50 of leaves have lower values than those of barks of the studied plants (Table 1). The IC50 values of samples were higher than those of positive control; therefore, fractionation of extract was suggested to get fraction with more active antiradicals.
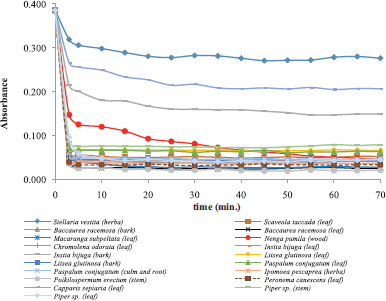 | Figure 1. Time course of scavenging of DPPH free radical by methanolic extract of the plant samples. The reaction mixture contained DPPH (70 mM) and methanolic plant extracts (100 μg/ml). The absorbance was measured at 515 nm. [Click here to view] |
 | Table 1. IC50 value of DDPH radical scavenging of methanolic crude extract of medicinal plants used for liver diseases medication along with reference sample [vitamin C or L-(+)-ascorbic acid]. [Click here to view] |
TEAC method, also known as ABTS [2,2′-azino-bis(3-ethylbenzothiazoline-6-sulfonic acid)] radical cation decolorization assay, was based on the measurement of color loss of ABTS·+ having blue-green color due to the presence of an antioxidant. Plant samples containing antioxidant compounds would reduce ABTS·+ to ABTS and decolorize it at wavelength 743 nm. Therefore, the decrease in absorbance of ABTS·+ could be used as an indication of antioxidant activity using this method. The standard calibration curve is constructed using Trolox, as a consequence, the antioxidant activity was expressed as TEAC values (in mM), calculated from a standard curve of Trolox (Seeram et al., 2006). Table 2 compiled TEAC values of 14 plant samples. The higher the TEAC value, the more active the plant sample as an antioxidant. Among these, the methanolic extract of B. racemosa leaves revealed the highest antioxidant activities using TEAC method, i.e., 354.88 ± 0.55 Trolox Equivalent (µM TE/100 µg). This result was in agreement with that of DPPH radical scavenging activities.
FRAP method was based on the capability of antioxidants to reduce the absorption of complex of Fe3+ ions and TPTZ due to the formation of Fe2+ ions at low pH at 595 nm (Benzie and Strain, 1996). FRAP value was obtained by comparing the changes of absorbance values in the sample mixture with those obtained from the increased concentrations of Fe3+. FRAP values were expressed as M of Fe2+ equivalents per g sample. Table 3 compiled FRAP values of plant samples in which the methanolic extracts of leaves of B. racemosa and Piper sp. showed the highest FRAP values, namely, 900.18 ± 15.41 and 899.17 ± 17.41, respectively. The FRAP assay is simple, quick, and reproducible to evaluate antioxidant capacity, in addition, it has a direct relation with phenolics content (Parameswari and Suriyavathana, 2012).
From 19 methanolic extracts of 14 plant samples, the leaves of B. racemose, M. subpeltata, and Piper sp. showed the highest antioxidant properties, as evaluated by DPPH radical scavenging assay, FRAP, and TEAC. Therefore, these methanolic extracts of three plants extracts will be subjected to further fractionation and in vivo antioxidant assay.
Classification of the plant samples using principal component analysis
Classification of the methanolic extracts of leaf, bark, and herb of plant samples was carried out using chemometrics of PCA, one of the unsupervised pattern recognition techniques (Che Man et al., 2011). The variables used were IC50 values of DPPH radical scavenging activity, TEAC, FRAP value, TPCs, and TFCs. Figure 2 revealed the score plot of PCA of 19 methanolic extracts of plant samples (leaf, bark, and herba), as shown in Table 1 for samples identification. Score plot of PCA was used for the classification among plant samples and it represented the sample projections expressed by the first principle component (PC1) which accounting the most variation in variables and second principle component (PC2) accounting the second largest variation of data variables. The eigenvalue indicated that PC1, PC2, and PC3 contributed to variable variations of 64.5%, 22.0%, and 11.1%, respectively, therefore, 97.6% of data variations could be described by three PCs. Based on the score plot, the plant samples could be classified into five groups, as clustered in Figure 2. The closer the score plot value, the closer of variables, therefore, the methanolic extract of leaves (code sample = 13) was closer in terms of antioxidant activities, TPCs, and TFCs with methanolic extract of culm and root of P. conjugatum (code sample = 12) and methanolic extract of C. odorata leaf (code sample = 7) (Yang et al., 2015).
 | Table 2. TEAC of methanolic crude extract of medicinal plants used for liver diseases medication. [Click here to view] |
 | Table 3. FRAP of methanolic crude extract of medicinal plants used for liver diseases medication along with reference sample [L-(+)-ascorbic acid]. [Click here to view] |
 | Figure 2. The PCA score plot expressed by first components (PC1) and second component (PC2) of 19 methanolic extract samples of: 1 = Stellaria vestita (herba); 2 = Baccaurea racemosa (leaf); 3 = Baccaurea racemosa (bark); 4 = Ipomoea pes-caprae (herba); 5 = Scaveola taccada (leaf); 6 = Nenga pumila (stem); 7 = Chromolaena odorata (leaf); 8 = Instia bijuga (leaf); 9 = Instia bijuga (bark); 10 = Litsea glutinosa (leaf); 11 = Litsea glutinosa (bark); 12 = Paspalum conjugatum (leaf); 13 = Paspalum conjugatum (culm and root); 14 = Macaranga subpeltata (leaf); 15 = Poikilospermum erectum (stem); 16 = Peronema canescens (leaf); 17 = Capparis sepiaria (leaf); 18 = Piper sp. (leaf); 19 = Piper sp. (stem). [Click here to view] |
In order to evaluate the correlation among variables, loading plot could be used (Fig. 3). Loading plot described how the vectors are pinned from the origin of PC1 = 0 and PC2 = 0. Loading plot was also understood as the weight of each variable to PCs. If two vectors are close, forming a small angle, the two variables are positively correlated. If among variables form an angle about 90°, they are not likely to be correlated, and when two variables are diverge and form a large angle (about 180o), they indicated a negative correlation. Phenolic compounds correlated with FRAP and TEAC positively and correlated negatively with the IC50 value of DPPH. The negative correlation between phenolics and IC50 indicated the positive correlation between phenolics content and antiradical scavenging activities. This indicated that phenolics compound affected significantly toward all antioxidant activities. In addition, flavonoid compounds do not contribute significantly toward antioxidant activities. Table 4 compiled the Pearson correlation as indicated with the coefficient of correlation (r) values among IC50 of DPPH radical scavenging activity, TEAC, FRAP, and TFCs. The higher the r-value, the higher the correlation of variables. Among each variable, the correlation between TEAC and TPC exhibited the highest r-value (0.945). These results were similar to those reported by Katalinic et al. (2006) and Thaipong et al. (2006). Figure 4 exhibited the scatter plot for the correlation between TEAC (x-axis) and TPC (y-axis) with the coefficient of determination (R2) of 0.8934. This indicated that phenolics contents contributed to 89.34% of TEAC activities of 19 methanolic extracts of plant samples.
 | Figure 3. The loading plot of PCA using variables of IC50 values of DPPH radical scavenging activity, TEAC, FRAP value, TPCs and TFCs. [Click here to view] |
 | Table 4. Pearson correlation among IC50 of DPPH radical scavenging activity, TEAC, FRAP, TPCs and TFCs. [Click here to view] |
 | Figure 4. The scatter plot for the correlation between TEAC (x-axis) and TPC (y-axis). [Click here to view] |
CONCLUSION
Among plant samples, the methanolic leaves extracts of B. racemosa, M. subpeltata, and Piper sp. showed the highest antioxidant properties as evaluated by DPPH radical scavenging activity, TEAC, and FRAP. The phenolics contents correlated with antioxidant activities. PCA successfully classified the plant samples according to antioxidant activities phenolic contents, and flavonoid contents. These three plants have promising antioxidant properties which support their utilization to prevent oxidative stress-related diseases including liver disease. A study on chemical compounds and their activity in a biological system is still needed to provide basic data on their use in traditional medicine.
ACKNOWLEDGMENTS
The authors would like to thank the Data Management Laboratory—NiHRD RI for providing a RISTOJA 2012-2017 set data and thank the Medicinal Plant and Traditional Medicine Research and Development Centre (MPTMRDC) for providing us with the research materials.
CONFLICT OF INTERESTS
Author declares that there are no conflicts of interest.
FINANCIAL SUPPORT AND SPONSORSHIP
None.
REFERENCES
Anand K, Lal UR. Hepatitis and medicinal plant: an review. J Pharmacogn Phytochem, 2016; 5(6):408–15.
Benzie IFF, Strain JJ. The ferric reducing ability of plasma (FRAP) as a measure of "antioxidant power": the FRAP assay. Anal Biochem, 1996; 239(1):70–6. CrossRef
Che Man YB, Rohman A, Mansor TST. Differentiation of lard from other edible fats and oils by means of Fourier transform infrared spectroscopy and chemometrics. J Am Oil Chem Soc, 2011; 88:187–92. CrossRef
Chen W, Jia Z, Pan M-H, Babu PVA. Editorial: natural products for the prevention of oxidative stress-related diseases: mechanisms and strategies. Oxid Med Cell Longev, 2016; 4628502. CrossRef
Cicco N, Lanorte MT, Paraggio M, Viggiano M, Lattanzio VA. Reproducible, rapid and inexpensive Folin-Ciocalteu micro-method in determining Phenolics of plant methanol extracts. Microchem J, 2009; 91:107–10. CrossRef
de Albuquerque UP. Implications of ethnobotanical studies on bioprospecting strategies of new drugs in semi-arid regions. Open Complement Med J, 2010; 2(2):21–3. CrossRef
Dong JW, Cai L, Xing Y, Yu J, Ding ZT. Re-evaluation of ABTS∙+ assay for total antioxidant capacity of natural products. Nat Prod Commun, 2015; 10(12):2169–72. CrossRef
Katalinic V, Milos M, Kulisic T, Jukic M. Screening of 70 medicinal plant extracts for antioxidant capacity and total phenols. Food Chem, 2006; 94:550–7. CrossRef
Khoddami A, Wilkes MA, Roberts TH. Techniques for analysis of plant phenolic compounds. Molecules, 2013; 18:2328–75. CrossRef
Li G, Yu S, Zhou Y-H, Chen Q-F. Spectrophotometric determination of flavonoids content in leaves of Fagopyrum cymosum complex. Asian J Chem, 2013; 25(13):7575–8. CrossRef
Li S, Tan H-Y, Wan N, Zhang Z-J, Lao L, Wong C-W, Feng Y. The role of oxidative stress and antioxidants in liver diseases. Int J Mol Sci, 2015; 16:26087–124. CrossRef
Lugrin J, Rosenblatt-Velin N, Parapanov R, Liaudet L. The role of oxidative stress during inflammatory processes. Biol Chem, 2014; 395(2):203–30. CrossRef
Marcellin P, Kutala BK. Liver diseases: a major, neglected global public health problem requiring urgent actions and large-scale screening. Liver Int, 2018; 38(1):2–6. CrossRef
McClatchey WC, Mahady GB, Bennett BC, Shiels L, Savo V. Ethnobotany as a pharmacological research tool and recent developments in CNS-active natural products from ethnobotanical sources. Pharmacol Ther, 2009; 123(2):239–54. CrossRef
Mistriyani, Riyanto S, Rohman A. Antioxidant activities of Rambutan (Nephelium lappaceum L) peel in vitro. Food Res, 2018; 2(1):119–23. CrossRef
National Institute of Health Research and Development (NiHRD) of Republic of Indonesia. Laporan Nasional Riset Kesehatan Dasar 2018. Badan Penelitian dan Pengembangan Kesehatan, 2019 (In Press).
Ntie-Kang F, Lifongo LL, Mbaze LM, Ekwelle N, Owono LCO, Megnassan E, Judson PN, Sippl W, Efange SM. Cameroonian medicinal plants: a bioactivity versus ethnobotanical survey and chemotaxonomic classification. BMC Complement Altern Med, 2013; 13:147. CrossRef
Nur Alam Md, Bristi NJ, Rafiquzzaman Md. Review on in vivo and in vitro methods evaluation of antioxidant activity. Saudi Pharm J, 2013; 21:143–52. CrossRef
Pandey KB, Rizvi SI. Ferric reducing and radical scavenging activities of selected important polyphenols present in foods. Int J Food Prop, 2012; 15(3):702–8. CrossRef
Parameswari G, Suriyavathana M. In-vitro antioxidant of Chromolaena odorata (L.) King & Robinson. IRJP, 2012; 2(3):187–92.
Reinberg S. U.S. deaths from liver disease rising rapidly. 19 July 2018 (HealthDay News). Availabel via https://www.webmd.com/digestive-disorders/news/20180719/us-deaths-from-liver-disease-rising-rapidly#1 (Accessed 25 January 2019).
Seeram NP, Henning SM, Lee R, Niu Y, Scheuller HS, Heber D. Catechin and caffeine contents of green tea dietary supplements and correlation with antioxidant activity. J Agric Food Chem, 2006; 54:1599–603. CrossRef
Sharma OP, Bhat TK. DPPH antioxidant assay revisited. Food Chem, 2009; 113:1202–5. CrossRef
Sochor J, Ryvolova M, Krystofova O, Salas P, Hubalek J, Adam V, Trnkova L, Havel L, Beklova M, Zehnale J, Provaznik I, Kizek R. Fully automated spectrometric protocols for determination of antioxidant activity: advantages and disadvantages. Molecules, 2010; 15(12):8618–40. CrossRef
Thaipong K, Booprakob U, Crosby K, Cisneros-Zevallos L, Byrne DH. Comparison of ABTS, DPPH, FRAP, and ORAC assays for estimating antioxidant activity from guava fruit extracts. J Food Compos Anal, 2006; 19:669–75. CrossRef
Widodo H, Rohman A, Sismindari. Pemanfaatan Tumbuhan Famili Fabaceae Untuk Pengobatan Penyakit Liver Oleh Pengobat Tradisional Berbagai Etnis Di Indonesia. Media Penelitian dan Pengembangan Kesehatan, 2019; 29(1):65–88. CrossRef
Yang M, Shen Q, Li L-Q, Huang Y-Q, Cheung H-Y. Phytochemical profiles, antioxidant activities of functional herb Abrus cantoniensis and Abrus mollis. Food Chem, 2015; 177:304–12. CrossRef