
INTRODUCTION
Ketorolac tromethamine is a non-steroidal anti-inflammatory drug having potent analgesic activity chemically which is 2-amino-2-(hydroxymethyl) propane-1,3-diol; 5-benzoyl-2,3-dihydro-1H-pyrrolizine-1-carboxylic acid (Fig. 1). It is a non-selective Cyclooxygenase (COX) inhibitor acting through the inhibition of prostaglandin synthesis by competitively blocking the enzyme COX (Banker and Anderson, 2009). Ketorolac is a safe and effective analgesic agent which can be administered intramuscularly or orally for the short-term management of acute postoperative pain, pain associated with rheumatoid or osteoarthritis, or dental pain for its low cost and safety. Ketorolac tromethamine (KT) has a short plasma half-life of 4–6 hours requiring its frequent administration rate. This may lead to gastric ulceration, bleeding, and other gastric complications in patients having a history of peptic ulcer disease or gastrointestinal bleeding or in geriatric patients for whom the treatment plan should be designed with much precaution (Chopra et al., 2008; Mohamed et al., 2015; Ong et al., 2007).
Several brands of KT tablets are available in Bangladesh which is most commonly used as analgesic to relief severe pain. The formulation properties and manufacturing methods play the key role on the quality of pharmaceutical dosage form; hence, it is usual that the quality of dosage form may differ with different available brands (The Pharmaceutical Codex, 1994). Based on the dose and the physical properties of drugs such as compressibility and flow properties of the blend/physical mixtures of drug and excipients, there are three methods of tablet manufacturing (Halbert, 1993). Direct compression is one of the processes of choice for its advantages over the other manufacturing methods for tablets, such as wet granulation for its high efficiency, reduced cycle time, less contact of moisture for thermolabile and moisture sensitive product, etc. (Beyer et al., 2001; Yasmeen et al., 2005; Zhang et al., 2003). Tablets manufactured by direct compression method have less chance of microbial contamination than those prepared by the wet granulation method and disintegrate into particle form of active pharmaceutical ingredients (APIs) instead of granules that directly come into contact with the dissolution media, hence show comparatively faster dissolution rate (Gohel, 2005; Ibrahim and Olurinola, 1991).
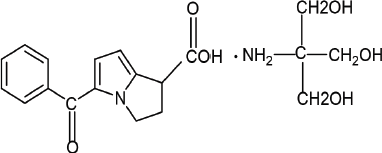 | Figure 1. Chemical structure of Ketorolac tromethamine. [Click here to view] |
In the present research work, cost effective, immediate release KT 10-mg tablets by direct compression method using different superdisintegratants, such as Crosscarmellose sodium, Microcrystalline cellulose, and Maize starch, have been developed and evaluated their compliance to various pharmacopoeial quality control parameters and made their comparison with marketed brands in terms of quality control parameters. In vitro pharmaceutical equivalency was also determined for both developed and marketed tablets. The purpose is also to reduce the disintegration time of the tablets to improve dissolution pattern. Quality of developed formulations and marketed brands were evaluated by determining physico-chemical characteristics (weight variation, friability, hardness, thickness, moisture content, disintegration, assay, and dissolution) of product following standard methods given in United States Pharmacopoeia (USP), British Pharmacopeia (BP), etc. Comparative study of developed formulation with marketed product (four brands coded as LKT1, MKT2, MKT3, and SKT4) was conducted based on physico-chemical properties and in vitro determination of pharmaceutical equivalency considering MKT2 as benchmark for high drug release.
MATERIALS AND METHODS
Materials
API KT was kindly gifted by Beximco Pharmaceuticals Ltd. Four different commercial brands of Bangladesh containing 10 mg of KT were purchased from retail pharmacy store and represented here by LKT1, MKT2, MKT3, and SKT4. Brands were randomly selected on the basis of company market share where in codes L stands for large market share; M stands for medium market share, and S stands for small market share. Microcrystalline Cellulose (Avicel PH-101), Crosscarmellose Sodium, Lactose, Maize starch, Talc, and Magnesium stearate were used as direct compression excipients. All other chemicals and reagents were purchased from Active Fine Chemicals, Ltd.
Instrumentation
UV-Vis spectrophotometer (Analytik Jena, Germany); Digital pH meter (Hatch Company, USA); Electronic hardness tester (Copley, England); Electronic friability tester (Copley, England); Tablet thickness tester (Mitutoyo, Japan); Tablet disintegration tester (Copley, England); Tablet dissolution tester (Copley, England); Scientech electronic balance (USA); Moister analyzer (Precisa, Switzerland); Sonicator (Wisd, Germany); Water Distillation machine (Merit w4000, UK) were used in this study.
Preparation of granules
All the ingredients were dispensed as per the batch size of Table 1 and shifted through 30 mesh sieve separately except Magnesium stearate and Talc. These above ingredients were mixed at geometric ratio and blended for 15 minutes in a large size poly bag using tumbling action. Then Magnesium stearate and Talc were mixed with the above blend by shifting through 30 mesh sieve and blended for further 3 minutes. Finally, blend was compressed using the single punch tablet machine (TSD-5 China).
Preformulation studies
Preformulation studies are primarily done to investigate the physical properties of the powder mixture and to establish its compatibility with other excipients.
Bulk density
Bulk density is calculated by the following formula (USP 29-NF-24, 2006a):
Bulk density = Weight of granules/Bulk volume
Tapped density
Tapped density is the ratio of total mass of powder to the tapped volume of the powder (USP 29-NF-24, 2006a), which can be determined by the following formula:
Tapped Density = Mass of the powder/Tapped volume of the powder
Angle of repose (θ)
Angle of repose, the measurement of friction forces in a loose powder, is defined as maximum angle possible between the surface of the pile of powder and horizontal plane (USP 29-NF-24, 2006b). It is defined as maximum angle possible between the surface of the pile of powder and the horizontal plane. To measure the angle of repose, the powder was allowed to flow freely through a funnel with height adjusted such a way that the tip of the funnel just touches the apex of the powder heap. Angle of repose can be calculated using following equation:
where θ is the angle of repose, h is the height in cm, and r is the radius in cm.
 | Table 1. Formulation of Ketorolac tromethamine immediate release tablet based on four different superdisintegrants. [Click here to view] |
Compressibility index and Hausner’s ratio
The compressibility index (Carr’s Index) and Hausner’s ratio (USP 29-NF-24, 2006a) of all the prepared powder blends were determined from their bulk density and tapped density values by following equation:
Hausner’s ratio was calculated as follows:
Hausner’s ratio = Tapped density/Bulk density
Quality evaluation of tablets
Weight variation
The weight of 20 tablets was determined individually using an electronic digital balance to evaluate weight variation among tablets. The average tablet weight and standard deviation were calculated and compared with the permissible limits (BP, 2012c).
Hardness test
Hardness tester was used to measure the hardness of the tablet. Ten tablets from each marketed brand and formulated preparation were randomly selected and their hardness was determined (BP, 2012e).
Thickness test
The crown thickness of individual tablets was measured with a Tablet thickness tester which is a type of a micrometer. Tablet thickness should be within the limit of ±5% variation (Banker and Anderson, 2009).
Friability test
For friability testing, 10 randomly selected tablets from each marketed brands and formulated tablets were initially weighed and placed in a friabilator chamber. The friability testing machine was operated at 25 rpm for 4 minutes (up to 100 revolutions). Thereafter, tablets were removed, dusted, and reweighed. The percent (%) friability was calculated by using following formula (BP, 2012d):
Loss on drying
Loss on drying (LOD) is an expression of the moisture content of solid formulation on a wet-weight basis, which is calculated as follows (BP, 2012a):
% LOD = wt of water in sample/total wt of wet sample × 100
Disintegration test
A digital tablet disintegration test apparatus was used for the disintegration test. A 900-ml beaker was filled with distilled water and maintained at 37°C ± 0.5°C. Six tablets from each brand and formulation were taken and placed in each of the cylindrical tubes of the basket and connected to the disintegration apparatus. To avoid the floating of tablets during upward and downward movement in water, discs were used. The time required to break each tablet into small particles and pass out through the mesh at the bottom of the tube is the disintegration time which was recorded (BP, 2012b).
Determination of dissolution rate (Ketorolac tromethamine)
The dissolution study of the formulated tablets and marketed brands was carried using USP standard dissolution apparatus II containing 600 ml of distilled water as a dissolution medium (Paddle method). Samples (10 ml) were collected at predetermined time intervals (5, 10, 15, 20, 30, and 45 minutes) and replaced with equal volume of fresh medium, filtered through 0.45-μm Whatman No. 1 filter paper and analyzed with a UV visible spectrophotometer at Æ›max 322 nm. The percentage of cumulative drug release of each tablet from formulated tablets and marketed brands was determined using the linear regression equation of the calibration curve (Fig. 2; Table 2). A 20.30 mg of standard KT was dissolved in 100 ml of dissolution media to prepare the standard stock solution. 1, 2, 3, 4, and 5 ml of this solution was diluted up to 50 ml with the dissolution media to produce concentration of 4.06, 8.12, 12.18, 16.24, and 20.30 μg/ml, respectively and absorbance of each sample was taken.
Test for content (assay)
From the stock solution of KT in methanol, a series of working solutions with concentrations of 4.06, 8.12, 12.18, 16.24, and 20.30 μg/ml were prepared in methanol to prepare a calibration curve measured at 322 nm. The limit of detection (LOD) and limit of quantification (LOQ) values were determined from the standard deviation of the residual calculated from the regression equation of calibration graph as described by Shrivastava and Gupta (2011) (Fig. 2; Table 2) to ascertain that the concentration of solutions used to make calibration curve is greater than LOQ. Using this curve, the amount of KT in each brand and formulation were determined.
Comparison of dissolution profiles
To consider the two pharmaceutical products similar, two adjustment factors (f1 and f2) comparing the dissolution profile of a pair of pharmaceutical products were applied to the dissolution data as a model independent approach. To ensure sameness of the curves, f1 values should be close to 0 and f2 values should be close to 100. Generally, f1 values up to 15 (0–15) and f2 values greater than 50 (50–100) ascertain sameness or equivalence of the two curves (Apurba et al., 2011; Mubengayi et al., 2016).
 | Figure 2. Calibration curve of Ketorolac tromethamine. [Click here to view] |
 | Table 2. Calculation of LOD and LOQ by estimation of y-residuals of regression line. [Click here to view] |
where n is the number of dissolution sample time points and Rt and Tt are the mean percent dissolution value at each time point t for the reference products and test sample dissolution profile, respectively.
Statistical analysis
Single factor analysis of variance study was conducted for the developed formulations using Microsoft excel software to establish the significant effect of the variable, here superdisintegrant concentration on dissolution data. p < 0.05 was considered significant and indicated main effects on optimizing formulations.
RESULTS AND DISCUSSION
KT 10-mg tablet was prepared by using direct compression method with the excipients tabulated in Table 1 by adjusting the concentration of super disintegrants, such as Crosscarmellose sodium, Crospovidone, Maize starch, and other ingredients. The study of pre-compression property was tabulated in Table 3. The Compressibility and Hausner’s ratio of various blends were calculated by using bulk density and tapped density data. The compressibility index was found in the range 12.50%–18.52%. The Hausner’s ratio was found in the range 1.13–1.23 which suggests that all the prepared granules possess good flowability. Angle of repose was found in the range of 15°–28.9°. From the compressibility index and angle of repose, results formulation FK4 and FK5 were found to have excellent flow property, whereas formulation FK1 and FK3 possessed good flow property. The result of the dissolution study of all the formulated and marketed tablets was shown in Figure 3. With 50% increase of Crosspovidone as superdisintegrant, the dissolution rate was increased from 84.10% to 96.09% at 5 minutes time interval with p < 0.05, but formulation of FK2 showed fair flowability. Formulation FK3 with Crosscarmellose sodium showed good dissolution and flow property of granules. Replacing half of the filler Microcrystalline cellulose with lactose did not cause any significant change in the dissolution property (p > 0.5) or the flow property of granules. So, in FK5, only disintegrant was changed to maize starch, which resulted in a decrease in the dissolution pattern from 88% to 78% at 5 minutes time interval, which is a significant result with p < 0.05. The moisture content was slightly increased for FK5. The post compression studies of formulated KT tablets are tabulated in Table 4 and marketed KT tablets are tabulated in Table 5. They reviled that all the quality parameters, such as friability, weight variation, hardness, disintegration time, assay, etc., are within the acceptance criteria limits for individual tests of marketed brands except SKT4 which showed higher moisture content. Difference (f1) and similarity (f2) tests were applied to the release rate to compare the dissolution profile. For KT tablet, brand MKT2 was considered as the benchmark for high dissolution rate. None of the three brands, namely, LKT1, MKT3, and SKT4 complies with the in-house reference standard MKT2 (Table 6) which may result from different excipients pattern of the formulations. Three developed formulations (FK1, FK4, and FK5) comply with the in-house reference standard MKT2 (Table 6). For higher moisture content of FK5, other two formulated products (FK1 and FK4) can be considered interchangeable with in-house reference standard (MKT2).
 | Table 3. Flow properties of formulation (Ketorolac tromethamine). [Click here to view] |
 | Figure 3. Percent release of ketorolac at different time interval of formulated and marketed tablets with standard deviation error bar. [Click here to view] |
 | Table 4. Evaluation of different formulations FKT1, FKT2, FKT3, FKT4, and FKT5. [Click here to view] |
 | Table 5. Evaluation of different brands LKT1, MKT2, MKT3, and SKT4. [Click here to view] |
.png) | Table 6. Comparative dissolution profile of formulated ketorolac tablets and different marketed brands. [Click here to view] |
CONCLUSION
Five different formulations of Ketorolac tromethamine 10 mg immediate release tablet have been developed by applying direct compression method successfully with accepted limit of quality control parameters among those, two developed formulated products (FK1 and FK4) are likely to perform similar with the in-house reference standard. FK4 can be considered as the best formulation with significant dissolution property (p < 0.05) and physicochemical behavior in both granulation and post-compression stage. The developed formulations can be arranged in the order of acceptability as FK4 > FK1 > FK3 > FK2 > FK5. Therefore, it can be anticipated that two developed generics (FK1 and FK4) can be considered interchangeable and subjected for further in vivo and in vitro pharmacokinetic studies. None of the tested marketed brands (LK1, MK3, and SK4) showed f1 and f2 value within the accepted limit which emphasizes the need for Good Manufacturing Practices (GMP) application by the pharmaceutical company and a continuous market monitoring of pharmaceutical products to ensure their equivalence to the reference products.
ACKNOWLEDGMENTS
The authors would like to thank the Bangladesh Council of Scientific and Industrial Research (BCSIR) for funding this research. The authors also would like to thank the Beximco Pharmaceuticals Ltd., Bangladesh for the supply of standard of Ketorolac tromethamine.
CONFLICT OF INTEREST
Authors have no conflict of interest to declare.
ETHICAL APPROVAL
There is no study involving human participants or animal studies performed by any of the authors.
FUNDING SOURCES
The authors received no external funding for this research.
REFERENCES
Apurba SA, Nazmul HK, Monjurul K, Nani GB, Khandoker SM, Jamaluddin ATM, Zakiur R. In vitro evaluation of the pharmaceutical equivalence of phenoxymethyl penicillin tablet formulations available in Bangladesh. J Pharm Res, 2011; 4(5):1445–7.
Banker GS, Anderson NR. Tablets. In: Lachman L, Lieberman HA, Kanig JL (eds.). The theory and practice of industrial pharmacy. 3rd edition, Lea and Febiger, Philadelphia, PA, pp. 296–300, 2009.
Beyer T, Day GM, Price SL. The prediction, morphology and mechanical properties of the polymorphs of Paracetamol. J Am Chem Soc, 2001; 123:5086–94. CrossRef
British Pharmacopeia. H.M. Stationery office. Appendix IXE, London, UK, vol. 5, p. A285, 2012a.
British Pharmacopeia. H.M. Stationery office. Appendix XIIA, London, UK, vol. 5, p. A320, 2012b.
British Pharmacopeia. H.M. Stationery office. Appendix XIIC, London, UK, vol. 5, p. A341, 2012c.
British Pharmacopeia. H.M. Stationery office. Appendix XVIIG, London, UK, vol. 5, p. A471, 2012d.
British Pharmacopeia. H.M. Stationery office. Appendix XVIIH, London, UK, vol. 5, p. A472, 2012e.
Chopra D, Sinha VR, Singh M. Thermal and isothermal methods in development of sustained release dosage forms of Ketorolac Tromethamine. E-J Chem, 2008; 5(2):316–22. CrossRef
Gohel MC. A review of co-processed directly compressible excipients. J Pharm Sci, 2005; 8(1):76–93.
Halbert GW. Pharmaceutical development. In: Griffin JP, Grady JO, Wells FO (eds.). The text book of pharmaceutical medicine. Greystone Books Ltd., Antrim, Northern Ireland, pp. 39–40, 1993.
Ibrahim YK, Olurinola PF. Comparative microbial contamination levels in wet granulation and direct compression methods of tablet production. Pharm Acta Helv, 1991; 66:293–301.
Mohamed MI, Soliman NA, Rahim SHAE, Development of a novel Ketorolac Tromethaminesublingual film. J Am Sci, 2015; 11(7):27–37.
Mubengayi CK, Ramli Y, Routaboul C, Gilard V, Karbane ME, Cherrah Y, Martinao MM, Essasi EM. Quality evaluation of Diclofenacformulations manufactured in DR Congo. Pharm Anal Chem Open Access, 2016; 2:112. CrossRef
Ong CKS, Lirk P, Tan CH, Seymour RA. An evidence-based update on Nonsteroidal anti-inflammatory drugs. Clin Med Res, 2007; 5(1):19–34. CrossRef
Shrivastava A, Gupta VB. Methods for the determination of limit of detection and limit of quantitation of the analytical methods. Chron Young Sci, 2011; 2:21–5. CrossRef
The Pharmaceutical Codex. Principle and practice of pharmaceutics. 12th edition, Pharmaceutical Press, London, UK, pp. 987–92, 1994.
United States Pharmacopeia and National Formulary (USP 29-NF 24). United States Pharmacopeia Convention, Rockville, MD, p. 2638, 2006a.
United States Pharmacopeia and National Formulary (USP 29-NF 24). United States Pharmacopeia Convention, Rockville, MD, p. 3017, 2006b.
Yasmeen R, Shoaib MH, Khalid H. Comparative study of different formulations of Atenolol. Pak J Pharm Sci, 2005; 18(1):49.
Zhang Y, Law Y, Chakrabarti S. Physical properties and compact analysis of commonly used direct compression binders. AAPS PharmSciTech, 2003; 4(4):489–99. CrossRef