
INTRODUCTION
Type 2 diabetes mellitus (T2DM) is the most abundant type of DM, which is estimated to account for approximately 90% of diabetic patients, with the remainder being made up of DM type 1 (American Diabetes Association, 2016; DeFronzo et al., 2015). In 2003, there were a reported 382 million people in the world with T2DM across all ages and this is predicted to reach 591 million by 2035. This is a 55% increase between 2003 and 2035, making DM a major global health problem (Akash et al., 2013; DeFronzo et al., 2015).
T2DM is a disease caused either by insulin resistance or impaired insulin secretion, or a combination of the two (DeFronzo et al., 2015). These lead to limited cellular glucose uptake, which could be due to phosphorylation of serine residue of the insulin receptor substrate (IRS) instead of a tyrosine residue (DeFronzo et al., 2015). This reduces glucose transporter type 4 translocation to cell membranes, and hence reduces glucose uptake (DeFronzo et al., 2015), causing glucose to remain at high levels in the blood, known as “hyperglycemia.” Hyperglycemia contributes to both microvascular and macrovascular complications, such as atherosclerosis, retinopathy, nephropathy, and neuropathy, which can be activated through inflammation and elevated inflammatory responses (Martín-Timón et al., 2014). Previous studies have shown that elevated inflammatory cytokines, such as interleukin-6 (IL-6) and tumor necrosis factor α (TNF-α), were found in hyperglycemic animal model and patients (Barma et al., 2011; Goyal et al., 2008; Stumvoll et al., 2005; Wellen and Hotamisligil, 2005). Moreover, it has been reported that various inflammatory cytokines levels increased in T2DM, especially TNF-α, IL-1, IL-6, and IL-1β (DeFronzo et al., 2015). These inflammatory cytokines bind to TNF receptors or Toll-like receptor-4 and induce serine phosphorylation of a family of IRS (DeFronzo et al., 2015). This evidence suggests that hyperglycemia may activate inflammation.
T2DM is commonly associated with obesity, which is determined by a body mass index of greater than 25 kg/m2 (DeFronzo et al., 2015; Kashima et al., 2015; Seshadri, 2013; Vaag and Lund, 2007). However, T2DM is not only observed in obese populations but is also prevalent in non-obese populations (Kashima et al., 2015; Seshadri, 2013; Vaag and Lund, 2007). Non-obese type 2 diabetic groups have a similar risk for diabetic complications as obese diabetic patients (Kashima et al., 2015). Moreover, plasma inflammatory cytokine levels in non-obese T2DM groups, such as IL-6, TNF-α, and IL-1β are elevated similarly to obese groups (Goyal et al., 2012). However, most reports present only the correlation of plasma inflammatory cytokine levels and hyperglycemic parameters, but not in organs or tissues, where the actual inflammatory effect could be a cause of complications in those organs (Fong et al., 2004). Therefore, internal organ inflammation, particularly in non-obese T2DM patients, needs to be of concern and studied to attempt to understand the pathology that is closely related to Asian diabetic populations (Ehses et al., 2009; Hong et al., 2016).
Therefore, this study aims to evaluate inflammatory cytokines levels and their expression in various internal organs, including in the brain, kidney, and liver of non-obese T2DM rat models [Goto-Kakizaki (GK)].
MATERIALS AND METHODS
Animal model
The animal experiments in this study were conducted according to the Guidance on the Operation of the Animals (Scientific Procedures) Act 1986 and the World Health Organization Guidelines for Breeding and Care of Laboratory Animals. All the protocols were approved by the committee of the Centre for Animal Research, Naresuan University, NU AE581023. All procedures were designed to minimize the pain, suffering, and distress of the animals involved.
Four-week-old adult male GK and Wistar rats were purchased from Nomura Siam International, Bangkok in Thailand. The number of animals used in this study was calculated from “Program R” software. The results from the calculation of the animal in each group were at least six. In this study, the n number of 7 was used. They were maintained in an environmentally control condition (22°C ± 1°C, 12 hours light/12 hours dark cycle) at the Centre for Animal Research, Naresuan University, Phitsanulok in Thailand. The weight of the animal models was monitored weekly. The glycemic parameters of the GK rat models, including their fasting blood glucose (FBG), hemoglobin A1c (HbA1c), and oral glucose tolerance test (OGTT) were performed once they were 7 weeks old to confirm the diabetic development prior to the treatment. At 14 weeks old, the animals were divided into three groups, including Wistar rats as a control group, untreated diabetic GK rats, and diabetic GK rats treated with metformin. In the metformin-treated group, the GK rats were treated with 15 mg/kg Glucophage® (Merck company, Germany) for 4 weeks. The glycemic parameter determination of the animal models was performed at several periods, including the baseline parameters at 14 weeks old and after the metformin treatment at 18 weeks old.
Internal organ isolation and serum collection
The GK rats were anesthetized by a 100 μg/kg pentobarbital injection with 150 units of heparin. The surgery area on the animals was cleaned with 70% ethanol or betadine solution. The skin was then pulled up and cut to open the chest. The internal organs, including the liver, kidney, and brain were collected in 1.5 ml RNase-free microcentrifuge tubes and immediately stored in liquid nitrogen. The blood was rapidly collected from the animals’ abdominal cavity into a Becton Dickinson company (BD) Vacutainer® after the thoracotomy. The collected blood was centrifuged at 3,000 × g for 10 minutes at 4°C, followed by serum collection which was then stored in liquid nitrogen until analysis.
Isolation of RNA and real-time polymerase chain reaction (PCR)
Total RNA was isolated from the frozen tissues using Arum™ Total RNA Mini Kit (BIO-RAD). For each sample, reverse transcription was performed with 3 μg of total RNA using the Tetra cDNA Synthesis kit Bio line®. Real-time PCR amplification was performed using SensiFAST™ SYBR® No-ROX Kit on aC1000 Touch™ Thermal Cycler Bio-Rad® with specific primers for IL-6, IL-1β, and TNF-α (Langnaese et al., 2008; Paz et al., 2003; Peinnequin et al., 2004). Relative gene expression was analyzed. Differences of cycle threshold number (CT) were calculated by normalizing the sample cycle threshold of the target gene with that of the internal control reference gene glyceraldehyde-3-phosephate dehydrogenase. The ΔΔ CT method was used to determine the relative abundance of expression using the Bio-Rad® CFX Manager™ 3.1 software.
Tissue homogenization
The frozen tissues were thawed and homogenized in a lysis buffer containing 20 mM Tris HCl (pH 6.8), 1 mM Na3VO4, and 5 mM NaF. The lysis buffer was mixed with the frozen tissue by adding 100 μl lysis buffer per 100 mg of frozen tissue. The tissue was then homogenized using a pestle and mortar. The tissue homogenate was centrifuged at 14,000 × g for 10 minutes at 4°C. The supernatant was collected into the Diethyl pyrocarbonate treated-H2O microcentrifuge tube.
Bradford assay
Fifty microliters of the protein samples was added into 2.5 ml of Bradford reagent (BIO-RAD, USA) and incubated at room temperature for at least 5 minutes. The sample absorbance was measured using a spectrophotometer at 595 nm. The protein concentration was determined using bovine serum albumin as a standard. The determined protein concentration was used to calculate and normalize the amount of protein used in the enzyme-linked immunosorbent assay (ELISA) method at 100 μg/ml.
Enzyme-linked immunosorbent assay
Determination of the inflammatory cytokines level by ELISA was performed using an 2,2’-azinobis-(3-ethylbenzothiazoline-6-sulfonate) (ABTS) ELISA Buffer Kit, Prepotech®. The ELISA reagents were prepared at room temperature by gentle mixing. First, the pre-coated 96-well plate was prepared by adding 100 μl of 1 μg/ml capture antibody to each well, which was then incubated overnight at room temperature. The following day, the plate was inverted to remove the liquid and blot the paper towel. After that, the plate was washed four times using 200 μl of washing buffer solution. Two-hundred microliters of the blocking solution was added into the well and then incubated for 1 hour. The plates were washed for four times again with washing buffer solution. Ten micrograms of tissue homogenates was added into the wells and incubated at room temperature for at least 2 hours. The plate was washed again and 100 μl of detection antibody was added and then incubated at room temperature for 2 hours. The plate was then washed again and 100 μl of Avidin-Horseradish peroxidase conjugated 1:2,000 was added and incubated at room temperature for 30 minutes. Then, the plate was washed and 100 μl of ABTS liquid substrate was added into the wells and incubated at room temperature for color development. The sample absorbance was measured using a spectrophotometer at 405 nm with the wavelength correction set at 650 nm.
Statistical analysis
Data were presented in the mean ± standard error of mean (SEM) and analyzed using Graph Pad Prism 5.0. The difference of the mean in each group was analyzed by analysis of variance or t-test. The p value < 0.05 was considered to be statistically significant.
RESULTS
Confirmation of non-obese diabetic model of Goto-Kakizaki rats
Several glycemic parameters were performed to ensure that the lean type 2 diabetic animal model was valid for study. Confirmation of the non-obese or lean animal model was done by measuring their body weight and the growth rate at 7, 14, and 18 weeks old. The results show that the body weight of the Wistar rat group was significantly higher than the GK rats at 7, 14, and 18 weeks old (178.2 ± 4.0, 421.7 ± 15.9, 451.9 ± 15.9 vs 141.2 ± 4.1, 295.9 ± 3.2, 308.6 ± 3.9, p < 0.05) (Fig. 1A). The glycemic parameters of the animal models were then measured, which included the FBG level and the percentage of HbA1c. The results reveal that the FBG level of the GK rats before treatment (at baseline) was significantly higher than the Wistar rats (132.4 ± 2.69 ng/dl vs 84.00 ± 4.50 ng/dl, p < 0.05) (Fig. 1B). The results show that the percentage of HbA1c of the GK rats before treatment (at baseline) were significantly higher than the Wistar rats (6.600 ± 0.09030 vs 4.120 ± 0.03887) (Fig. 1C). The OGTT results show that the plasma glucose level 2 hours after the intake of glucose was significantly higher in the GK rats compared to the Wistar rats (281.5 ± 6.179 vs 114.1 ± 5.86, p < 0.05) (Fig. 1D).
Metformin reduced fasting blood glucose level and the percentage of HbA1c in non-obese T2DM rats
We found that FBG levels significantly decreased after 4 weeks of the metformin treatment when compared to the FBG levels before treatment (126.7 ± 2.802 ng/dl vs 176.3 ± 11.64 ng/dl, p < 0.05) (Fig. 2A). Similar to FBG, the percentage of HbA1c in the GK rats also significantly decreased compared to the Wistar rat group (5.508 ± 0.1098 vs 6.600 ± 0.09030, p < 0.05) (Fig. 2B).
Non-obese diabetes increased TNF-α cytokines level in serum
The inflammatory cytokines level in serum was measured by ELISA. The results show that there was no significant difference of the IL-6 level from serum between the three groups (control = 120.9 ± 19.47 ng/ml, diabetic = 102.0 ± 4.88 ng/ml, and diabetic treated with metformin = 94.32 ± 3.63 ng/ml, p > 0.05) (Fig. 3A). The serum TNF-α level of the diabetic group was significantly higher when compared to control group (208 ± 28.51 ng/ml vs 290.4 ± 19.56 ng/ml, p < 0.05) (Fig. 3B). Moreover, the TNF-α level in the diabetic group treated with metformin was significantly lower than that of the diabetic group (290.4 ± 19.56 ng/ml vs 177 ± 30.32 ng/ml, p < 0.05) (Fig. 3B). The serum IL-1β level in the three groups was not significantly different (control = 125.8 ± 25.78 ng/ml, diabetic = 103.7 ± 6.40 ng/ml, and diabetic treated with metformin = 94.93 ± 14.51 ng/ml, p > 0.05) (Fig. 3C).
 | Figure 1. The FBG level (A), percentage of HbA1c (B), OGTT at 2 hours after glucose administration for 2 hours before treatment (C), and mean body weight of Wistar rat and GK rat in 7, 14, and 18 weeks old (D) (*p < 0.05 is significant). [Click here to view] |
 | Figure 2. The FBG level (A) and percentage of HbA1c (B) after metformin treatment for 4 weeks when compared to before treatment in their group (*p < 0.05 is significant). [Click here to view] |
 | Figure 3. The serum inflammatory cytokines level in the control group, diabetic group (DM), and diabetic group treated with metformin for 4 weeks (DM + metformin) (*p < 0.05 is significant between the control group and diabetes group) (#p < 0.05 is significant between the DM group and metformin group). [Click here to view] |
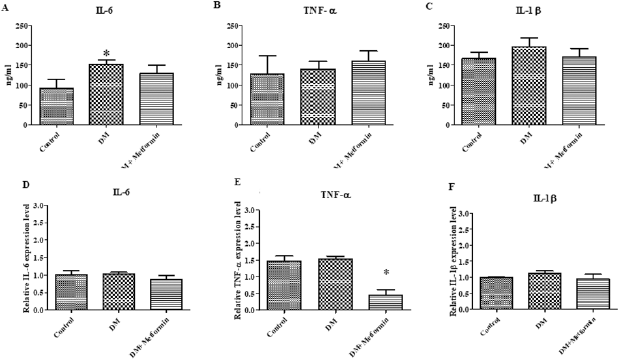
Non-obese diabetes increased IL-6 and IL-1β cytokines levels and their expression in the liver
The level of inflammatory cytokines and their expression in the liver were determined. The results show that the level of IL-6 from liver tissue extracts of the diabetic group was significantly higher than that of the control group (133.2 ± 11.60 ng/ml vs 172 ± 10.84 ng/ml, p < 0.05). However, metformin treatment was unable to reduce the level of liver IL-6 (Fig. 4A). The relative mRNA expression level of IL-6 in the diabetic group was significantly higher than that of the control group (0.4807 ± 0.018 vs 1.865 ± 0.35, p < 0.05) (Fig. 4D). Moreover, metformin treatment may significantly reduce IL-6 mRNA expression (1.865 ± 0.35 vs 0.9852 ± 0.08, p < 0.05) (Fig. 4D).
There was no significant difference between the TNF-α levels from the liver tissue extracts in the three groups (control = 85.53 ± 8.12 ng/ml, diabetic = 78.72 ± 8.11 ng/ml, and diabetic treated with metformin = 80.79 ± 10.36 ng/ml, p > 0.05) (Fig. 4B). Metformin treatment was unable to reduce the relative mRNA expression level of TNF-α in the three groups (control = 0.93 ± 0.47, diabetic = 1.58 ± 0.17, and diabetic treated with metformin = 1.213 ± 0.27, p < 0.05) (Fig. 4E).
In addition, the level of IL-1β from the liver tissue extract of the diabetic group was significantly higher than in the control group (111.72 ± 2.816 ng/ml vs 312 ± 28.99 ng/ml, p < 0.05). However, metformin treatment could not reduce the level of liver IL-1β (Fig. 4C). Similar to the cytokine level, the IL-1β relative mRNA expression level was significantly higher than in the control group (0.7284 ± 0.01 vs 1.134 ± 0.17, p < 0.05) (Fig. 4F), which is also not different when treated with metformin (0.98 ± 0.08, p < 0.05) (Fig. 4F).
 | Figure 4. The liver inflammatory cytokines level in the control group, diabetic group (DM), and diabetic group treated with metformin for 4 weeks (DM + metformin) (Fig. 3A–C). The liver mRNA inflammatory cytokines level in the control group, diabetic group (DM), and diabetic group treated with metformin for 4 weeks (DM + metformin) (Fig. 3D–F) (*p < 0.05 is significant between the control group and diabetes group) (#p < 0.05 is significant between the diabetes group and metformin group). [Click here to view] |
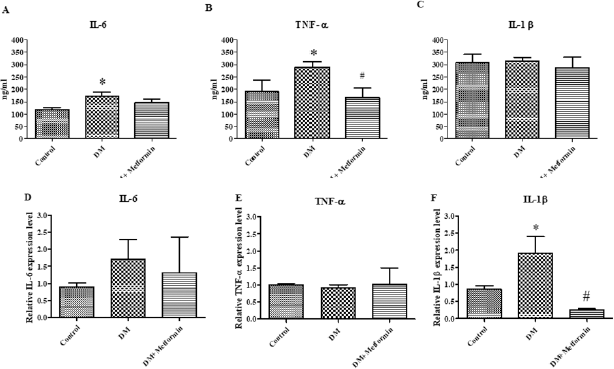
 | Figure 5. The kidney inflammatory cytokines level in the control group, diabetic group (DM), and diabetic group treated with metformin for 4 weeks (DM + metformin) (Fig. 4A–C). Inflammatory cytokines mRNA level after treatment for 4 weeks in kidney (*p < 0.05 is significant between the control group and diabetes group) (Fig. 4D–F). [Click here to view] |
 | Figure 6. The brain inflammatory cytokines level in the control group, diabetic group (DM), and diabetic group treated with metformin for 4 weeks (DM + metformin) (Fig. 5A–C). Inflammatory cytokines mRNA level after treatment for 4 weeks in brain (*p < 0.05 is significant between the control group and diabetes group) (#p < 0.05 is significant between the diabetes group and metformin group) (Fig. 5D–F). [Click here to view] |
Non-obese diabetes only increased kidney IL-6 cytokines levels
The level of inflammatory cytokines and their expression in the kidney were determined. The kidney inflammatory cytokine level results were similar to the findings from the liver. The IL-6 level of the diabetic group was significantly higher than the control group (diabetes = 152.5 ± 10.83 ng/ml, control = 92.84 ± 20.73 ng/ml) (Fig. 5A). The mRNA expression of inflammatory cytokines was also measured in the kidney, with the results showing that there was no significant difference in the mRNA expression level of IL-6 between the three groups (control = 1.017 ± 0.10, diabetic = 1.035 ± 0.04, and diabetic treated with metformin = 0.871 ± 0.11, p < 0.05) (Fig. 5D).
There was no significant difference between the TNF-α levels from the kidney tissue extracts between the three groups (control = 127.7 ± 46.87 ng/ml, diabetic = 140.5 ± 19.23 ng/ml, and diabetic treated with metformin = 160.2 ± 25.36 ng/ml, p > 0.05) (Fig. 5B). The mRNA expression level of TNF-α was not significantly different in the control group compared to the diabetic group (control = 1.473 ± 0.14, diabetic = 1.533 ± 0.08, p < 0.05). However, the TNF-α mRNA expression level of the metformin treated diabetic group was significantly lower than the control group (diabetic = 0.45 ± 0.16, control = 1.533 ± 0.08, p < 0.05) (Fig. 5E).
In addition, the level of IL-1β from the kidney tissue extracts of the diabetic group was also not significantly different when compared to control group and the metformin treated diabetic group (control = 166.8 ± 15.36 ng/ml, diabetic = 196.2 ± 22.44 ng/ml, and diabetic treated with metformin = 170.9 ± 20.86 ng/ml, p > 0.05) (Fig. 5C). There was no significant difference to the mRNA expression level of IL-1β between the three groups (control = 1.00 ± 0.01 ng/ml, diabetic = 1.127 ± 0.07 ng/ml, and diabetic treated with metformin = 0.955 ± 0.13, p < 0.05) (Fig. 5F).
Non-obese diabetes increased IL-6 and TNF-α cytokines levels and their expression in the brain
The level of inflammatory cytokines and their expression in the brain were determined. Measurement of the levels of inflammatory cytokines for each group was performed after 4 weeks. The results show that the IL-6 levels of the diabetic group were significantly higher than the control group (diabetic = 173.6 ± 14.6 ng/ml, control = 118 ± 7.4 ng/ml, p<0.05) (Fig. 6A and B). Meanwhile, the IL-6 levels of the diabetic treated with metformin group were not significantly lower than the diabetic group (diabetic treated with metformin = 148.6 ± 11.9 ng/ml) (p > 0.05) (Fig. 6A). There was no significant difference of the IL-6 mRNA expression level between the three groups (control = 0.901 ± 0.11, diabetic = 1.716 ± 0.56, and diabetic treated with metformin = 1.313 ± 1.05, p > 0.05) (Fig. 6D).
The TNF-α level from the brain was significantly higher than that of the control group (diabetic = 290.4 ± 19.5 ng/ml, control = 190.1 ± 47.7 ng/ml) (Fig. 6B). The TNF-α levels in the diabetic treated with metformin group was significantly lower than the diabetic group (diabetic treated with metformin = 167.2 ± 37.8 ng/ml, diabetic = 290.4 ± 19.5 ng/ml, p < 0.05) (Fig. 6B). Similar to IL-6, there was also no significant difference between the TNF-α mRNA expression levels in the three groups (control = 1.00 ± 0.04, diabetic = 0.916 ± 0.09, and diabetic treated with metformin = 1.027 ± 0.47, p > 0.05) (Fig. 6E).
The level of IL-1β in the brain tissue extracts from the three groups was not significantly different (control = 307.4 ± 32.9 ng/ml, diabetic = 313.7 ± 14.1 ng/ml, and diabetic treated with metformin = 286.0 ± 43.4 ng/ml, p > 0.05) (Fig. 6C). The IL-1β mRNA expression levels of the diabetic group were significantly higher than that of the control group (diabetic = 1.91 ± 0.488, control = 0.85 ± 0.09, p < 0.05). In addition, the IL-1β mRNA expression levels in the diabetic treated with metformin group were significantly lower than the diabetic group (diabetic treated with metformin = 0.241 ± 0.03, diabetic = 1.91 ± 0.488, p < 0.05) (Fig. 6F).
DISCUSSION
In this study, spontaneous non-obese type 2 diabetes (T2DM) in GK rats was used as an animal model of lean T2DM. The glycemic parameters performed at 14 weeks old to create “diabetic-like model” using human diagnostic criteria from the American Diabetes Association’s 2017 guidelines (American Diabetes Association, 1978). In addition, the growth rate of the GK rats was evaluated and compared with the Wistar rats when they were 14 and 18 weeks old. The findings show that glycemic parameters, including fasting blood glucose (FBG), OGTT, and HbA1c confirmed that the GK rats expressed the phenotype of the “type 2 diabetic-like” model. Moreover, the results from the growth rate analysis confirmed that the model used in this study expressed phenotype of the non-obese (lean) diabetic-like model.
Metformin is an anti-diabetic drug that is prescribed all over the world. Treatment with metformin has shown significant reductions in glycemic parameters, FBG, and %HbA1c. Previous studies suggest that metformin could lower FBG level by reducing the rate of hepatic gluconeogenesis and improve insulin sensitivity, which is also found in the current study (Hundal et al., 2000; Ou et al., 2006). Previous research using a GK rat model has reported that metformin also decreased blood glucose levels after 4 weeks of treatment, with dosage relative to body weight, such as 100 mg/kg of body weight, or twice daily treatments of 60 mg/kg body weight of metformin (Inouye et al., 2014; Sena et al., 2011). Therefore, metformin has also been found to decrease blood glucose levels in humans and animal models. The dosage used in this study was 15 mg/kg body weight, which is lower than previous studies (Sena et al., 2011), but was the same dosage that provided cardioprotection as reported by Apaijai et al. (2012).
Hyperglycemia is an important risk factor of diabetic complications. It has been reported that prolonged hyperglycemia and the excessive production of advanced glycation end products could activate NF-κβ, which is a predominant signaling molecule regulating inflammatory cytokines expression (Shoelson et al., 2006). Moreover, hyperglycemia could induce oxidative stress by increasing reactive oxygen species production. This could lead to activation of NF-κβ and release inflammatory cytokines such as TNF-α (Busik et al., 2008). Inflammation was reported to be involved in the development of diabetic complications. Calle and Fernandez (2012) reported that the inflammatory response in diabetic patients was a result of an overload of adipose tissue and glucose. The inflammatory cytokine was produced by adipose tissue activating the inflammatory response via the NF-κβ signaling pathway, in the same way as the hyperglycemic condition (Calle and Fernandez, 2012). Xue et al. (2011) reported that the adipose tissue weight of GK rats was lower than Wistar rats, which may imply that the inflammation in GK rats could potentially not be a result of adipose tissue inflammation, but may partially be due to hyperglycemia. The major findings from the present study show that inflammation in the diabetic group occurred in various internal organs as a result of increasing level of inflammatory cytokines (IL-6, TNF-α, and IL-1β). In this study, both the level of inflammatory cytokines and the relative mRNA expression of pro-inflammatory cytokines, including IL-6, TNF-α, and IL-1β, were evaluated by ELISA and real-time PCR, respectively. Our results show that both the cytokine level and the relative mRNA expression of IL-6 and IL-1β in the liver increased in the diabetic group compared to the control group. However, there was no significant difference between the relative mRNA expression and cytokine levels of TNF-α in the liver between the three groups. The liver IL-6 level in the diabetic group treated with metformin significantly decreased in comparison to the diabetic group. However, the relative mRNA and protein expression of TNF-α and IL-1β in the diabetic treated with metformin group did not significantly decrease when compared with the diabetic group. There was a correlation between the liver IL-6 and IL-1β mRNA and cytokine level results, with the exception of IL-6 relative mRNA expression in the diabetic treated with metformin group, which greatly decreased. It is noteworthy to mention that the inflammation in non-obese diabetics has not previously been reported. We may potentially claim that the present study is the first that has reported the inflammatory cytokine levels and gene expression in a lean model. The only comparable studies were reported in obese models. The study by Arras and colleagues showed that there was IL-6 expression in the liver, which could be a cause of insulin resistance (Apaijai et al., 2012; Schmidt-Arras and Rose-John, 2016; Sena et al., 2011). Moreover, Negrin et al. reported that the expression of IL-1β increased in hepatic cells of type 2 diabetes ob/ob mice model (Calle and Fernandez, 2012; Carvalho Vidigal et al., 2012; Negrin et al., 2014), which is similar to the findings of Hotamisligil et al. that TNF-α increased relative to obesity (Hotamisligil et al., 1995; Xue et al., 2011). Interestingly, Kim et al. showed that metformin reduced the expression of IL-6 by repressing signal transducer and activator of transcription 3 and suppressor of cytokine signaling 3 production (Suzuki et al., 1995). This is consistent with Araújo who found that the levels of IL-1β and TNF-α could be reduced after treatment with metformin (Nakamura et al., 1993).
In the kidney, the mRNA expression of all cytokines in the diabetic group was not significantly different compared to the control group, whereas only the TNF-α relative mRNA expression in the diabetic treated with metformin group significantly decreased in comparison to the diabetic group. Conversely, the IL-6 level significantly increased in the diabetic group compared to the control group. However, there was no significant difference between the mRNA expression and cytokine level in the kidney between the diabetic and control groups. Although there was no difference in the level of cytokines and their relative expression, they slightly increased in comparison to the control group. Despite this study finding, there was no significant increase in the level of inflammatory cytokines, few studies have demonstrated different results. It is noteworthy, however, to point out that the other studies used obese models. The study by Suzuki et al. (1995) showed that IL-6 relative mRNA expression levels significantly increased in the kidneys of diabetic rats. Similarly, Nakamura et al. (1993) study reported that TNF-α relative mRNA expression levels significantly increased in Streptozotocin-induced diabetic rats. Additionally, Sakai and Wada (2015) reported that diabetes increased the number of IL-1β and IL-1β receptors. The present study found that metformin-treated T2DM could reduce diabetic inflammation in the kidney and decrease diabetic nephropathy.
In the brain, only IL-1β relative mRNA expression level significantly increased in the diabetic group, while it decreased in the diabetic treated with metformin group. Moreover, IL-6 and TNF-α cytokine levels increased in the diabetic group in comparison to the control group. However, the level of TNF-α significantly decreased in comparison to the diabetic group. The relative mRNA expression and cytokine level in the brain results of the diabetic treated with metformin group also slightly increased, but not significantly in comparison with the control and diabetic groups. In the diabetic treated with metformin group, the level of inflammatory cytokines slightly decreased but not significantly when compared with the diabetic group. The only information that could be retrieved online regarding brain cytokines levels was from Srodulski et al. (2014), who reported that IL-6 and TNF-α also significantly increased in the brain tissue of the diabetic model of Sprague–Dawley rats which expresses human amylin in pancreatic β-cells.
Lastly, in the serum, only the TNF-α protein expression level significantly increased in the diabetic group and decreased in the diabetic treated with metformin group. Goyal et al. (2012) reported that TNF-α significantly increased in non-obese diabetics in comparison to their control group. The findings in the non-obese model in this study were similar to the previous studies on obese diabetic animal models and also in the human sample that there was an increase in TNF-α in serum (Afzal et al., 2017; Pickup et al., 2000).
There were discrepancies in this study between the cytokine levels and mRNA expression in some internal organ tissues. This could be due to the complicated and varied post-translational mechanisms involved in turning mRNA into protein, and the protein may differ substantially in their in vivo half-lives or protein turnover (Greenbaum et al., 2003). However, the mRNA expression level results were more reliable than the protein expression level because the relative mRNA expression level was evaluated by real-time PCR, which is more sensitive and specific to very small amounts of mRNA in tissue homogenate. Additionally, due to the biology of GK rats that present as non-obese and mild hyperglycemia, the severity of hyperglycemic state in GK rats could be insufficient to worsen the inflammatory processes, and hence lessen the severity of diabetic complications.
Some limitations of this study need to be addressed. It seems that small animal experiments remain essential to understand the fundamental mechanisms underlying the etiology, physiology, and pathology of diabetes. Determination of the cellular and molecular changes in organ level could possibly be performed in the animal model, whereas studying in isolated human internal organs from the patients seem to be unpractical. However, information from small animal study might be insufficient to provide an absolute conclusion on real pathophysiology of the diseases in human. Therefore, any findings from animal experiments should be validated with real clinical settings. The inflammatory cytokines measured in this study, including IL-6, TNF-α, and IL-1β, are pro-inflammatory cytokines that are usually expressed in metabolic diseases, but no specific cause of organ complications. Determination of infiltrated or accumulation of leukocytes in the internal organ tissues, by immunohistochemistry, could provide some useful information concerning the organ inflammation and should be considered for further investigation. Moreover, several organs can be affected by diabetic complications as a result of inflammation than the liver, kidney, and brain which were studied in this research. Diabetic complications can also develop in the heart, nervous system, vascular system, and in the eyes. Therefore, it is suggested that further study should determine the specific inflammation cytokines which match with complications in those particular organs, such as IL-1β and TNF-α for the eyes, and IL-1, IL-12 in the vascular system. This information could be useful both for drug development and in preventing unexpected diabetic complications.
In conclusion, this study has reported internal organ inflammation that was activated in non-obese diabetic models and decreased after treatment with metformin, which provides useful information for further investigation into other organs.
ACKNOWLEDGMENT
This study was financially supported by Naresuan University Research endowment fund and National Research Council of Thailand Grant ID number R2559A017, R2560C138. We would like to thank Faculty of Allied Health Sciences, Naresuan University for providing research grant for master’s degree study and scholarship for Podsawee Mongkolpathumrat, the Royal Golden Jubilee PhD Program—Thailand Research Fund (No. PHD/0087/2556) for Jantira Sanit and (No. PHD/0125/2558) for Kantapich Kongpol, and Naresuan University scholarship for Nuttikarn Nokkaew. We are grateful to the Centre for Animal Research, Naresuan University for their excellent technical assistance. We would like to thank ProofRead4Sure service to English proofreading and editing.
AUTHORS’ CONTRIBUTION
Podsawee Mongkolpathumrat, Panyupa Pankhong, and Sarawut Kumphune conceived and designed the experiments; Podsawee Mongkolpathumrat, Nuttikarn Nokkaew, Punyanuch Adulyaritthikul, Kantapich Kongpol, and JantiraSanit performed the experiments in animal treatment; Podsawee Mongkolpathumrat, Panyupa Pankhong, and Sarawut Kumphune analyzed the data, wrote, and prepared the manuscript.
CONFLICTS OF INTEREST
The authors declare no conflicts of interest.
REFERENCES
Afzal N, Anjum R, Javaid K, Shahzad F, Kashif M, Zafar A, Zaman S, Nagi AH. Serum level of il-6 in patients of type- ii diabetes mellitus with and without retinopathy: a comparative study. Bangladesh J Med Sci, 2017; 16(4):525–9. CrossRef
Akash MSH, Rehman K, Chen S. Role of inflammatory mechanisms in pathogenesis of type 2 diabetes mellitus. J Cell Biochem, 2013; 114:525–31. CrossRef
American Diabetes Association. 2. Classification and Diagnosis of Diabetes. Diabetes Care, 2016; 39 Suppl 1:S13–22. CrossRef
American Diabetes Association. Diabetes care. American Diabetes Association, Alexandria, VA, 1978.
Apaijai N, Pintana H, Chattipakorn SC, Chattipakorn N. Cardioprotective effects of metformin and vildagliptin in adult rats with insulin resistance induced by a high-fat diet. Endocrinology, 2012; 153:3878–85. CrossRef
Barma PD, Ranabir S, Prasad L, Singh TP. Clinical and biochemical profile of lean type 2 diabetes mellitus. Indian J Endocrinol Metab, 2011; 15:S40–3. CrossRef
Busik JV, Mohr S, Grant MB. Hyperglycemia-induced reactive oxygen species toxicity to endothelial cells is dependent on paracrine mediators. Diabetes, 2008; 57:1952–65. CrossRef
Calle MC, Fernandez ML. Inflammation and type 2 diabetes. Diabetes Metab, 2012; 38:183–91. CrossRef
Carvalho Vidigal FD, Guedes Cocate P, Gonçalves Pereira L, Cássia Gonçalves Alfenas RD. The role of hyperglycemia in the induction of oxidative stress and inflammatory process. Nutr Hosp, 2012; 27:1391–98.
DeFronzo RA, Ferrannini E, Groop L, Henry RR, Herman WH, Holst JJ, Hu FB, Kahn CR, Raz I, Shulman GI, Simonson DC, Testa MA, Weiss R. Type 2 diabetes mellitus. Nat Rev Dis Primers, 2015; 1:15019. CrossRef
Ehses JA, Lacraz G, Giroix MH, Schmidlin F, Coulaud J, Kassis N, Irminger JC, Kergoat M, Portha B, Homo-Delarche F, Donath MY. IL-1 antagonism reduces hyperglycemia and tissue inflammation in the type 2 diabetic GK rat. Proc Natl Acad Sci USA, 2009; 106:13998–4003. CrossRef
Fong DS, Aiello L, Gardner TW, King GL, Blankenship G, Cavallerano JD, Ferris FL, Klein R. Retinopathy in diabetes. Diabetes Care, 2004; 27:s84–7. CrossRef
Goyal R, Faizy AF, Islam N. Effect of hyperglycemia on inflammatory markers in patients with Type 2 Diabetes. 2008. [Online]. Nature Precedings; doi:10.1038/npre.2008.1567.1. CrossRef
Goyal R, Faizy AF, Siddiqui SS, Singhai M. Evaluation of TNF-α and IL-6 levels in obese and non-obese diabetics: pre- and postinsulin effects. N Am J Med Sci, 2012, 4:180–4. CrossRef
Greenbaum D, Colangelo C, Williams K, Gerstein M. Comparing protein abundance and mRNA expression levels on a genomic scale. Genome Biol, 2003; 4:117. CrossRef
Hotamisligil GS,Arner P,Caro JF,Atkinson RL, Spiegelman BM. Increased adipose tissue expression of tumor necrosis factor-alpha in human obesity and insulin resistance. J Clin Invest, 1995;95:2409–15. CrossRef
Hong SB, Lee JJ, Kim SH, Suh YJ, Han JY, Kim YS, Nam M. The effects of adiponectin and inflammatory cytokines on diabetic vascular complications in obese and non-obese patients with type 2 diabetes mellitus. Diabetes Res Clin Prac, 2016; 111:58–65. CrossRef
Hundal RS, Krssak M, Dufour S, Laurent D, Lebon V, Chandramouli V, Inzucchi SE, Schumann WC, Petersen KF, Landau BR, Shulman GI. Mechanism by which metformin reduces glucose production in type 2 diabetes. Diabetes, 2000; 49:2063–9. CrossRef
Inouye KA, Bisch FC, Elsalanty ME, Zakhary I, Khashaba RM, Borke JL. Effect of metformin on periimplant wound healing in a rat model of type 2 diabetes. Implant Dent, 2014; 23:319–27. CrossRef
Kashima S, Inoue K, Matsumoto M, Akimoto K. Prevalence and characteristics of non-obese diabetes in Japanese men and women: the Yuport Medical Checkup Center Study. J Diabetes, 2015; 7:523–30. CrossRef
Kim YD,Kim YH,Cho YM,Kim DK,Ahn SW,Lee JM,Chanda D,Shong M,Lee CH, Choi HS. Metformin ameliorates IL-6-induced hepatic insulin resistance via induction of orphan nuclear receptor small heterodimer partner (SHP) in mouse models. Diabetologia, 2012; 55:1482–94. CrossRef
Langnaese K, John R, Schweizer H, Ebmeyer U, Keilhoff G. Selection of reference genes for quantitative real-time PCR in a rat asphyxial cardiac arrest model. BMC Mol Biol, 2008; 9:53. CrossRef
Martín-Timón I, Sevillano-Collantes C, Segura-Galindo A, del Cañizo-Gómez FJ. Type 2 diabetes and cardiovascular disease: have all risk factors the same strength? World J Diabetes, 2014; 5:444–70. CrossRef
Nakamura T, Fukui M, Ebihara I, Osada S, Nagaoka I, Tomino Y, Koide H. mRNA expression of growth factors in glomeruli from diabetic rats. Diabetes, 1993; 42:450. CrossRef
Negrin KA,Roth Flach RJ,DiStefano MT,Matevossian A,Friedline RH,Jung D,Kim JK, Czech MP. IL-1 signaling in obesity-induced hepatic lipogenesis and steatosis. PLoS One, 2014; 9:e107265–e65. CrossRef
Ou HY, Cheng JT, Yu EH, Wu TJ. Metformin increases insulin sensitivity and plasma beta-endorphin in human subjects. Horm Metab Res, 2006; 38:106–11. CrossRef
Paz Y, Frolkis I, Pevni D, Shapira I, Yuhas Y, Iaina A, Wollman Y, Chernichovski T, Nesher N, Locker C, Mohr R, Uretzky G. Effect of tumor necrosis factor-alpha on endothelial and inducible nitric oxide synthase messenger ribonucleic acid expression and nitric oxide synthesis in ischemic and nonischemic isolated rat heart. J Am Coll Cardiol, 2003; 42:1299–305. CrossRef
Peinnequin A, Mouret C, Birot O, Alonso A, Mathieu J, Clarencon D, Agay D, Chancerelle Y, Multon E. Rat pro-inflammatory cytokine and cytokine related mRNA quantification by real-time polymerase chain reaction using SYBR green. BMC Immunol, 2004; 5:3. CrossRef
Pickup JC, Chusney GD, Thomas SM, Burt D. Plasma interleukin-6, tumor necrosis factor α and blood cytokine production in type 2 diabetes. Life Sci, 2000; 67:291–300. CrossRef
Sakai N, Wada T. Revisiting inflammation in diabetic nephropathy: the role of the Nlrp3 inflammasome in glomerular resident cells. Kidney Int, 2015; 87:12–4. CrossRef
Schmidt-Arras D, Rose-John S. IL-6 pathway in the liver: From physiopathology to therapy. J Hepatol, 2016; 64:1403–15. CrossRef
Sena CM, Matafome P, Louro T, Nunes E, Fernandes R, Seiça RM. Metformin restores endothelial function in aorta of diabetic rats. Br J Pharmacol, 2011; 163:424–37. CrossRef
Seshadri KG. Non obesity, autoimmunity and the missing pieces of diabetes in the adult. Int J Diabetes Devlop Ctries, 2013; 33:69–70. CrossRef
Shoelson SE, Lee J, Goldfine AB. Inflammation and insulin resistance. J Clin Invest, 2006; 116:1793–801. CrossRef
Srodulski S, Sharma S, Bachstetter AB, Brelsfoard JM, Pascual C, Xie XS, Saatman KE, Van Eldik LJ, Despa F. Neuroinflammation and neurologic deficits in diabetes linked to brain accumulation of amylin. Mol Neurodegener, 2014; 9:30. CrossRef
Stumvoll M, Goldstein BJ, van Haeften TW. Type 2 diabetes: principles of pathogenesis and therapy. Lancet, 2005; 365:1333–46. CrossRef
Suzuki D, Miyazaki M, Naka R, Koji T, Yagame M, Jinde K, Endoh M, Nomoto Y, Sakai H. In situ hybridization of interleukin 6 in diabetic nephropathy. Diabetes, 1995; 44:1233. CrossRef
Vaag A, Lund SS. Non-obese patients with type 2 diabetes and prediabetic subjects: distinct phenotypes requiring special diabetes treatment and (or) prevention? Appl Physiol Nutr Metab, 2007; 32:912–20. CrossRef
Wellen KE, Hotamisligil GS. Inflammation, stress, and diabetes. J Clin Invest, 2005; 115:1111–19. CrossRef
Xue B, Sukumaran S, Nie J, Jusko WJ, DuBois DC, Almon RR. Adipose tissue deficiency and chronic inflammation in diabetic Goto-Kakizaki rats. PLoS One, 2011; 6:e17386. CrossRef