
INTRODUCTION
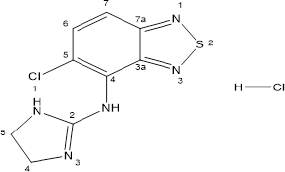
Tizanidine hydrochloride (Figure 1) is 5-chloro-N-(4,5-dihydro-1H-imidazol-2-yl)-2,1,3-benzothiadiazol-4-amine hydrochloride and a central alpha-2 adrenoceptor agonist. It is used for the treatment of patients who show spasticity due to cerebral or spinal injury (dose could be from as low as 2–36 mg/day) (Coward, 1994; Smith et al., 1994; Wagstaff and Bryson, 1997)
There is no data available on ultra-performance liquid chromatography (UPLC) methods for quantitation of related impurities in Tizanidine tablets. However, Tizanidine tablets monograph is listed in United States Pharmacopoeia USP43-NF38 which describes organic impurities by high performance liquid chromatography (HPLC) method for the quantitative estimation of only three known related compounds namely Tizanidine related compound A, Tizanidine related compound B and Tizanidine related compound C. The literature review indicates additional related impurities identified in Tizanidine (Reddy et al., 2008).
| Figure 1. Structure of Tizanidine hydrochloride. |
Literature reveals, several analytical methodologies used for the estimation of Tizanidine, either as a single entity or as combined entity with another drug. These methods include spectrophotometric and HPLC methods (Brandalise et al., 2017; Devarajan and Sivasubramanian, 2006; Mantri et al., 2005; Ramaa et al., 2006; Reddy et al., 2008; Samel and Raman, 2009; Subramanian et al., 2004; Vijayakumar et al., 2010). Recent findings have revealed that even significantly low levels of impurities affect the safety as well as the efficacy of a drug product.
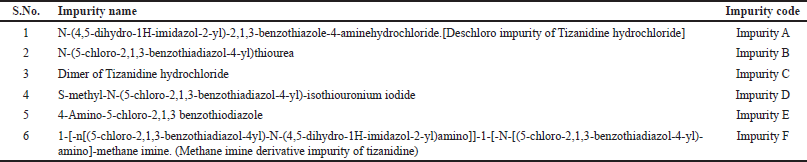
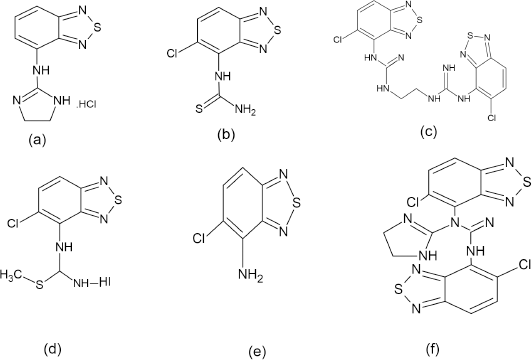
Current research work describes quantitation of all known related impurities of Tizanidine hydrochloride Tablets as given in Table 1. Chemical structure of these impurities is given in Figure 2. The operating principle of HPLC and UPLC are the same. Conventional HPLC’s use column particle size of about 5 μm, while the UPLC’s use sub 2-μm particle size. Thus, HPLC systems can handle pressures up to 6000 psi, whereas UPLC systems can handle pressures up to 15,000 psi. According to Van Deemter equation, the efficiency of a chromatographic process increases with the decrease in column particle size. Smaller the particle size the height equivalent to theoretical plates reduces significantly. In both HPLC an UPLC, the precision and accuracy levels are comparable. However, UPLC offers major advantage with improved sensitivity, faster run time, and reduced solvent consumption. These efficiency advantages make UPLC a sought-after technique in quality control laboratories. The aim of this study is to develop a quantitative UPLC method which is sensitive, precise, accurate, stability indicating, and quick. This method would also meet the regulatory requirements of ICH (International Council of Harmonisation) and USP (United States Pharmacopeia) validation guidelines for quantitative estimation of related impurities in Tizanidine hydrochloride tablets. Testing labs can use this method for regular testing as well as for stability testing.
MATERIALS AND METHODS
Materials
Tizanidine hydrochloride (Purity 99.6%), Tizanidine hydrochloride tablets 2/4 mg, and related impurities of Tizanidine hydrochloride were obtained from Dr Reddy’s Laboratories, Hyderabad, India as gift samples. Acetonitrile used for mobile phase was of HPLC grade and procured from Merck. Sodium perchlorate and orthophosphoric acid are AR grade chemicals procured from Merck. Triethylamine used was also AR grade and procured from Merck. Purified water for UPLC was obtained through Milli Q Water generating system. 0.45 µ Millipore Durapore hydrophilic membrane filters were used for sample solution filtration.
| Table 1. List of related impurities of Tizanidine hydrochloride. |
| Figure 2. Structure of Tizanidine Impurities. (a) Impurity A (b) Impurity B (c) Impurity C (d) Impurity D (e) Impurity E (f) Impurity F. |
Equipment
Waters Acquity UPLC with solvent manager to handle two mobile phases, auto injector and photo diode array detector. Waters Empower 2 chromatographic data system. Sonicator, pH meter (Mettler) and Micro balance (Mettler), Water bath and vacuum filtration pump. Syringe filters were used for the sample filtration.
Method
Chromatography conditions
The chromatography system used was Waters Acquity UPLC. The analytical column was ethylene bridged hybrid (BEH) C8 with dimensions of 100 × 2.1, 1.7 µm. Binary gradient mode elution mode was set to operate the chromatograph to achieve separation of all the related impurities of Tizanidine hydrochloride. Mobile phase A was made by mixing acetonitrile and buffer in the ratio of 5:95 (v/v). Buffer for mobile phase A was made with 0.24% sodium perchlorate solution containing 0.6 ml/l triethyl amine and pH adjusted with orthophosphoric acid to 3.6. Mobile phase B was a mixture of acetonitrile and buffer in the ratio of 70:30 (v/v). Buffer for Mobile phase B was made with 0.67% sodium perchlorate containing 1.7 ml/l of triethylamine and pH adjusted to 2.6 using orthophosphoric acid.
Gradient program (T/%B) used was as Initial/0, 1.00/0, 5.00/20, 11.00/50, 13.00/20, 16.00/0, and 20.00/0. The flow rate was 0.5 ml/minute with 2 μl injection volume, oven temperature for column was 60°C and UV detector set at 230 nm. UPLC operation, data collation, and integration of chromatogram was performed using Waters Empower 2 software.
Diluent preparation
Diluent was prepared by mixing Mobile phase B and Acetonitrile in 80:20 (v/v) ratio.
Preparation of resolution solution
Considering that Tizanidine related impurity A and Tizanidine hydrochloride elute very closely, resolution solution in the diluent was prepared using a mixture of Tizanidine related Impurity A of concentration 0.001 mg/ml and Tizanidine hydrochloride of concentration 0.2 mg/ml to demonstrate method suitability.
Standard preparation
Tizanidine hydrochloride stock standard solution of concentration of 0.69 mg/ml was prepared by dissolving in diluent with little sonication. Tizanidine standard stock solution was further diluted to obtain concentration of 1.725 µg/ml. Diluted standard solution was filtered through 0.45 µm Durapore hydrophilic membrane filter prior to injecting in the chromatographic system.
Test preparation
Sample solution was prepared by crushing not less than 20 tablets of Tizanidine hydrochloride into fine powder. Tizanidine sample solution of concentration 0.5 mg/ml was prepared with tablet powder equivalent to 25 mg of Tizanidine in 50 ml of diluent with sonication for 15 minutes with intermittent shaking. About 2 ml of test preparation solution was filtered through 0.45 µm Durapore hydrophilic membrane filter prior to injecting into the chromatographic system.
RESULTS AND DISCUSSION
Forced degradation study
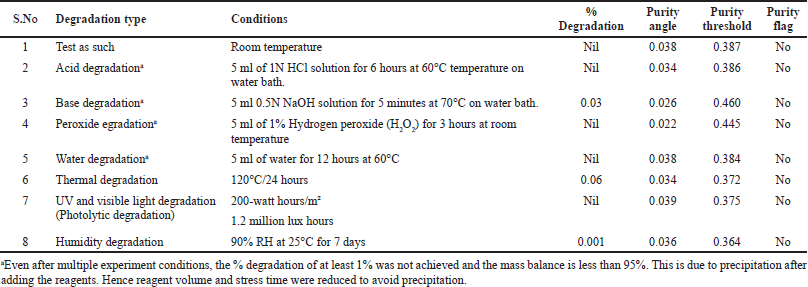
Forced degradation study was performed in accordance with the ICH guidance by exposing the Tizanidine hydrochloride tablets as well as the placebo. Degradation study didn’t yield significant degradation. This was due to precipitation after adding reagents. Thus, the reagent volume and stress time was reduced to avoid precipitation. There were no interfering peaks at the retention time of Tizanidine, tizanidine placebo, or at the retention time of the tizanidine related impurities. Chromatographic review did not throw up any purity flags. About 0.06% degradation was achieved under thermal conditions and 0.03% under alkali conditions. Result showed lower purity angle as against the purity threshold and there is no placebo interference. Details of the degradation levels are summarized in Table 2.
Sample preparation optimization
Sample preparation technique is critical and has significant impact on precision and accuracy of the method. Diluents such as acetonitrile, methanol, and various combination with buffer were tried to obtain good extraction of the active drug and ensure accurate response. Acetonitrile as well as methanol produced complete solubilization of the analyte and all impurities. However, the acetonitrile was selected as it gave strong analyte response, good peak shapes, and higher recovery.
Chromatographic condition optimization
Commonly used columns like C8 and C18 were evaluated. C8 sorbent was selected as it is less retentive compared to C18 sorbent. C18 was found not suitable, due to low resolution and asymmetric peak shape. Bonded BEH column was chosen considering low pH of the mobile phase and to avoid column bleeding. Separation between the most closely eluting impurity Tizanidine related impurity A and Tizanidine was achieved on the Waters Acquity BEH C8 column of dimensions 100 × 2.1, 1.7 µm. Varied composition of mobile phase using acetonitrile and methanol were studied. Good response and separation were seen with the mixture of mobile phase A composed of Sodium perchlorate, Triethylamine buffer (pH 3.6) and acetonitrile in ratio 95:5 (v/v) and mobile phase B Sodium perchlorate, Triethylamine buffer (pH 2.6), and acetonitrile in the ratio 30:70 (v/v) in gradient elution mode. Peaks were well separated at flow of 0.5 ml/minute with column temperature 50ºC and injection volume of 2 µl. To overcome the appearance of an impurity close to the Tizanidine peak, the column oven temperature was increased to 60ºC. This change ensured resolution of all the impurity peaks. The wavelength for measurement was selected as UV 230 nm based on the absorption maxima. Results were statistically assessed as a part of the method validation using mean, relative standard deviations, standard deviation, correlation coefficient considering 95% confidence interval at appropriate places.
| Table 2. Degradation study – results of interference from degradation products. |
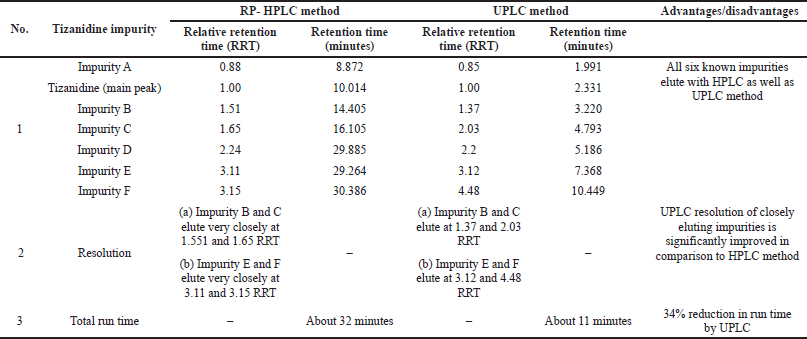
| Table 3. Comparison of RP-HPLC and developed UPLC method. |
Literature method assessment
RP-HPLC method for Tizanidine hydrochloride referred in the literature was compared with the current developed UPLC method (Reddy et al., 2008). Advantage with the UPLC method was that the resolution between Impurity B and C, as well as between Impurity E and F improved significantly. Also, the run time was significantly reduced from about 32 minutes by RP-HPLC method to less than 11 minutes by the developed UPLC method. A detailed comparison of the RP-HPLC and developed UPLC method for Tizanidine hydrochloride is shown in Table 3.
Method Validation
The developed UPLC method was validated on the lines of ICH Q2R1 guideline. Parameters such as system suitability test, specificity, limit of detection (LOD), limit of quantitation (LOQ), linearity and range, precision, accuracy, solution stability, and robustness were run in order to demonstrate the capability of the method.
System suitability
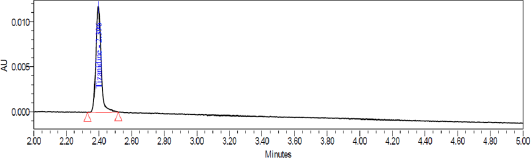
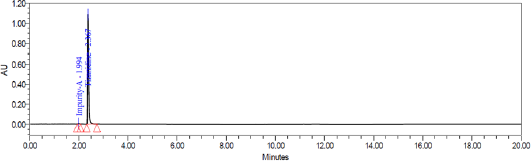
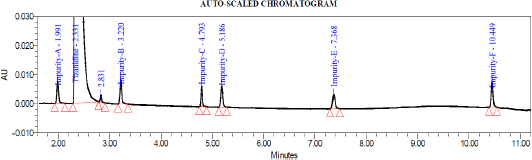
System suitability test was conducted by injecting resolution solution and six replicate injections of diluted tizanidine standard solution. The resolution of 5.6 was obtained between Tizanidine related Impurity A and Tizanidine. Peak area of six replicates of the tizanidine standard solution injection had an RSD (Relative standard deviation) of 0.9%. The relative retention time of Tizanidine impurity A, Tizanidine impurity B, Tizanidine impurity C, Tizanidine impurity D, Tizanidine impurity E, and Tizanidine impurity F were about 0.85, 1.37, 2.03, 2.30, 3.12, and 4.48, respectively. Tizanidine standard chromatogram and resolution solution showing separation of Tizanidine related impurity A and Tizanidine are shown in Figures 3 and 4, respectively.
| Figure 3. Tizanidine standard chromatogram. |
| Figure 4. Resolution chromatogram: Separation of Tizanidine impurity A and Tizanidine. |
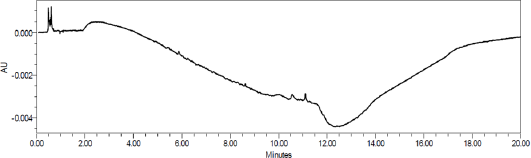
| Figure 5. Placebo chromatogram. |
Specificity
The study was conducted with placebo to establish the interference of placebo. The chromatograms of placebo showed no peaks at the retention time of Tizanidine and the known impurities. Placebo chromatogram is shown in Figure 5. Degradation study indicate that there are no interfering peaks at retention time of Tizanidine, tizanidine placebo, or at the retention time of the tizanidine related impurities. The purity angle was less than the purity thresholds.
Limit of detection (LOD) and limit of quantitation (LOQ)
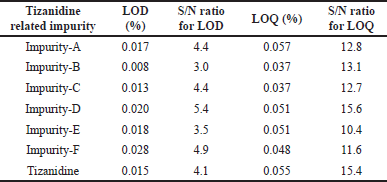
The LOD and LOQ concentrations were established using signal-to-noise ratio method by spiking all known impurities and Tizanidine hydrochloride in the placebo. LOD was established as 0.017%, 0.008%, 0.013%, 0.020%, 0.018%, 0.028%, and 0.015% for Tizanidine Impurity A, B, C, D, E, F, and Tizanidine, respectively. Similarly, the LOQ was established as 0.057%, 0.037%, 0.037%, 0.051%, 0.051%, 0.048%, and 0.055% for Tizanidine Impurity A, B, C, D, E, F, and Tizanidine, respectively. The details of LOD and LOQ for each impurity are summarized along with signal to noise ratio in Table 4.
| Table 4. Tizanidine related impurities LOD and LOQ levels with S/N ratio. |
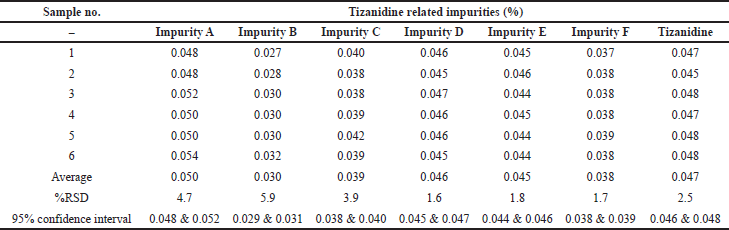
| Table 5. Precision of Tizanidine related impurities at LOQ level. |
| Figure 6. Typical chromatogram depicting all the impurities at LOQ level. |
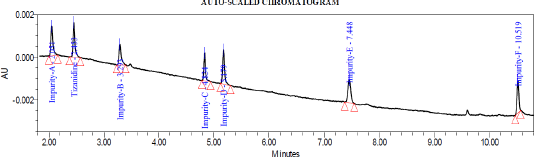
Precision was performed with six preparations of Tizanidine hydrochloride and all known related impurities of Tizanidine at limit of quantification level. The % RSD observed to be 4.7%, 5.9%, 3.9%, 1.6%, 1.8%, 1.7%, and 2.5% for Impurity A, B, C, D, E, F, and Tizanidine, respectively. Details are tabulated in Table 5. Typical chromatogram depicting all the impurities at LOQ level is shown in Figure 6.
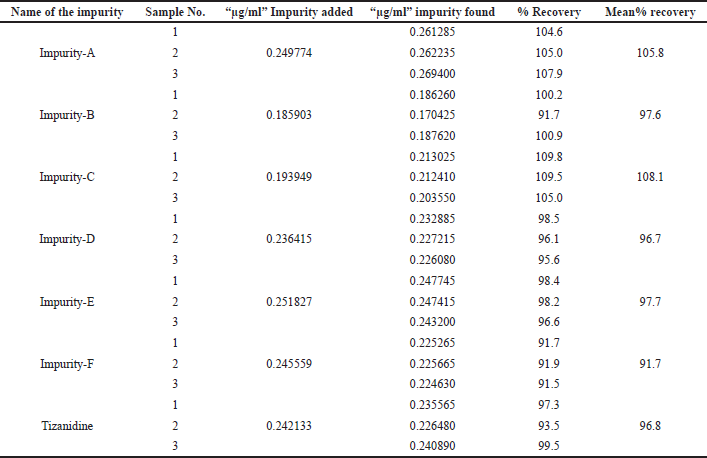
Accuracy was performed with three test preparations, with all known related impurities, and Tizanidine at limit of quantification level. The % mean recovery was observed to be 105.8%, 97.6%, 108.1%, 96.7%, 97.7%, 91.7%, and 96.8% for Impurity A, B, C, D, E, F, and Tizanidine, respectively. Details are tabulated in Table 6.
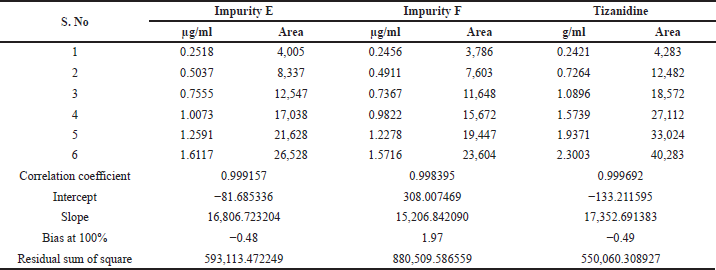
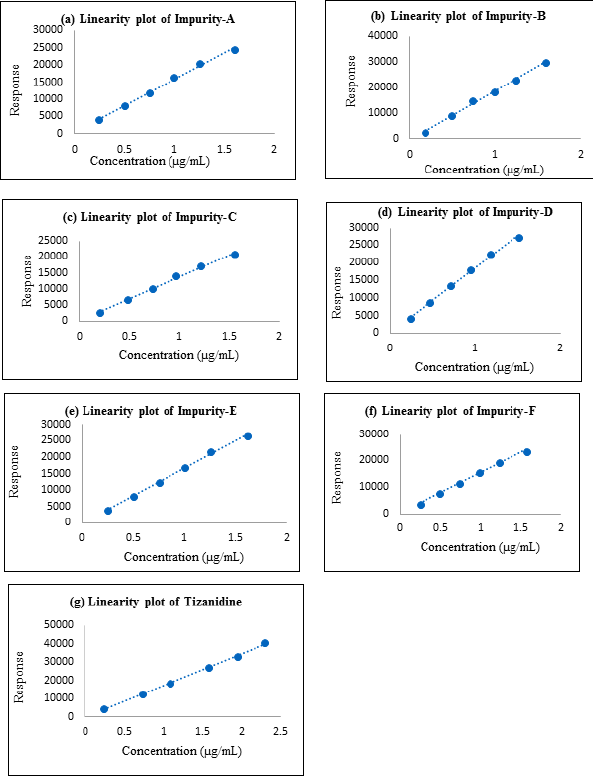
Linearity and range
Linearity and range were established by drawing a graph of concentration against the peak area response for the six known related impurities and Tizanidine hydrochloride and determining the correlation coefficient. The linearity of method for each impurity was assessed by drawing a six-point calibration graph in the range between LOQ and 150% levels. Linearity plot results are shown in Table 7 and linearity graphs are shown in Figure 7. The correlation coefficient value was more than 0.997 and Bias for 100% was not more than ± 5% for all known impurities and Tizanidine hydrochloride. This shows the method is sensitive in the given range, and the method can quantify all the known tizanidine related impurities.
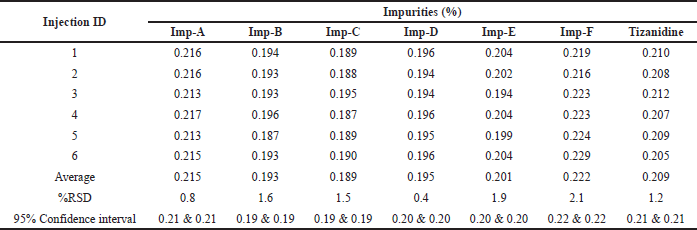
Precision
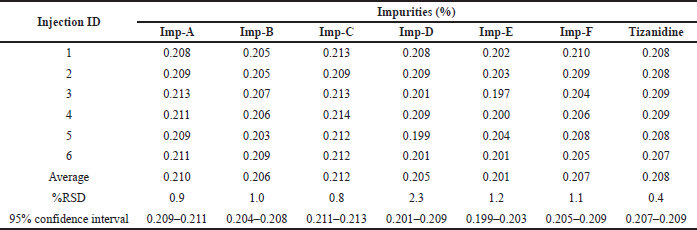
Method precision was checked by injecting six samples prepared by spiking test preparation with all known related impurities at 0.2% levels. The % RSD was found to be 0.8%, 1.6%, 1.5%, 0.4%, 1.9%, 2.1%, and 1.2% for the related impurity A, B, C, D, E, F, and Tizanidine at 95% confidence interval, respectively. The individual impurity level, RSD, and 95% confidence intervals are detailed in Table 8 as a part of method precision. Typical chromatogram depicting all impurities is shown in Figure 8.
Intermediate precision was checked by injecting six samples prepared by spiking test preparation with all known related impurities at 0.2% level on different day. The % RSD was found to be 0.9%, 1.0%, 0.8%, 2.3%, 1.2%, 1.1%, and 0.4% for the related impurity A, B, C, D, E, F, and Tizanidine at 95% confidence interval, respectively. The individual impurity level, RSD and 95% confidence intervals are detailed in Table 9 as a part of intermediate precision.
Accuracy
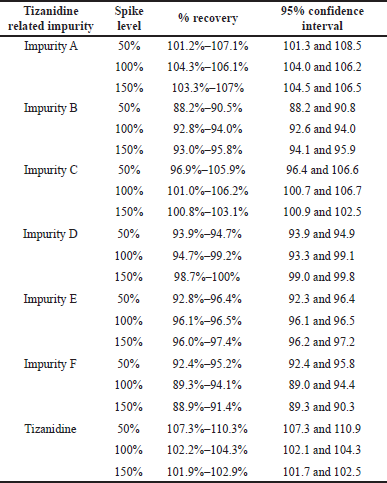
The accuracy of test method for all known related impurities and tizanidine was performed by spiking impurities in the test preparation. Three samples each for 50% and 100% levels and six samples at 150% levels were prepared by spiking and injected into the chromatographic system. The percentage recovery of tizanidine impurity A, B, C, D, E, F, and Tizanidine across the 50%, 100%, and 150% levels were in the range 88.2%–110.3% at 95% confidence intervals. The accuracy data is tabulated and presented in Table 10.
Solution stability
Solution stability for the Mobile phase, Tizanidine standard, Tizanidine test solution was established for a period of 5 days at bench top conditions. The mobile phase was assessed for the % impurity from initial to 5 days and it was observed to be below 0.02% and total impurities below 1.5%. The Tizanidine standard and test solution was assessed by evaluating the similarity factor of the standard solution which was observed to be between 1.0 and 1.03 from initial to 5 days. % total impurity was found maximum to an extent of 2.2%.
| Table 6. Accuracy of Tizanidine related impurities at LOQ level. |
| Table 7. Linearity plot details of Tizanidine and its impurities. |
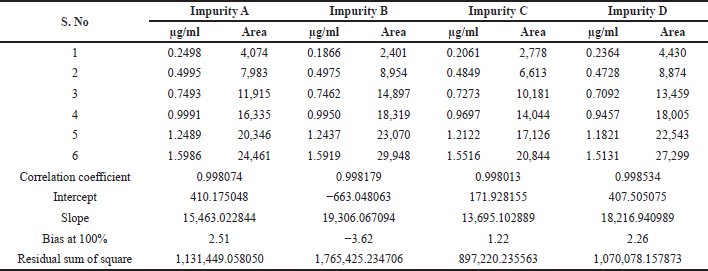
| Table 7 (continued). Linearity plot details of Tizanidine and its impurities. |
| Figure 7. (a) Linearity plot of impurity A; (b) Linearity plot of impurity B; (c) Linearity plot of impurity C; (d) Linearity plot of impurity D; (e) Linearity plot of impurity E; (f) Linearity plot of impurity F; (g) Linearity plot of Tizanidine. |
| Table 8. Method precision for the Tizanidine impurities and Tizanidine. |
| Figure 8. Precision – typical chromatogram depicting all the impurities. |
| Table 9. Intermediate Precision for the Tizanidine impurities and Tizanidine. |
| Table 10. Accuracy data with spike level of 50%–150% of test preparation. |
| Table 11. Robustness – impact of system suitability for intentional changes in method parameters. |
Similarly, stability for the resolution solution for system suitability was established for a period of 5 days under refrigerator conditions. The % assay difference of related impurity A was assessed at initial and up to 5 days period. It was observed to be below 3.5%.
Robustness
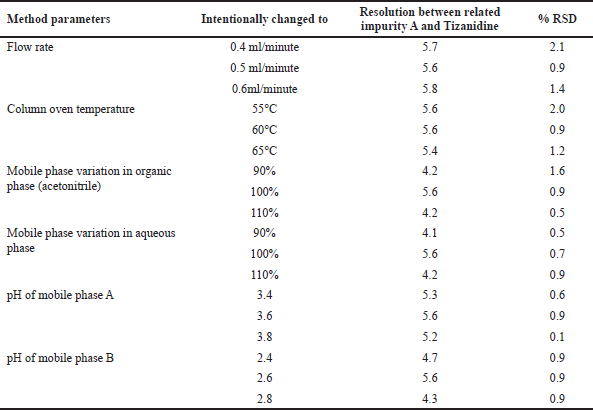
Robustness of the UPLC method was verified by making intentional changes in flow rate, column oven temperature, composition of the organic phase and aqueous phase in mobile phase A and B, pH of buffer for mobile phase A and B. In each of the cases the UPLC method met the system suitability requirements of resolution and %RSD criteria. Details of the intentional changes and the outcomes are listed in Table 11.
CONCLUSION
In conclusion, a single, sensitive, precise, accurate, quick, and robust UPLC method was developed for quantitation of all known Tizanidine impurities in Tizanidine tablets. The specificity of the method was demonstrated by no interference from the degradation studies of the tablet formulation and placebo. The method is advantageous owing to it being one single method for all the known Tizanidine related impurities, LOD in range 0.008%–0.028%, LOQ in the range 0.037%–0.057%, lower runtime and simple sample preparation technique. Considering that quality control laboratories need efficient and cost-effective methods that are quick, low-cost considering solvent usage, and stability indicating, this UPLC method can be directly used for day to day and stability monitoring in the testing laboratories. In addition, the method can be used for testing of multiple samples due to the robust solution stability of mobile phase as well as the standard and sample solutions.
AUTHOR CONTRIBUTIONS
Each of the authors contributed as part of design, data collection, and interpretation. They also took part in drafting and revising portions of the article critically. All authors meet the qualification requirements in line with the international committee of medical journal editors.
ACKNOWLEDGMENTS
The author thanks Dr.Reddy’s Laboratories for providing gift samples of Tizanidine hydrochloride, Tizanidine Hydrochloride tablets and Tizanidine related impurities.
AUTHOR CONTRIBUTIONS
All authors made substantial contributions to conception and design, acquisition of data, or analysis and interpretation of data; took part in drafting the article or revising it critically for important intellectual content; agreed to submit to the current journal; gave final approval of the version to be published; and agree to be accountable for all aspects of the work. All the authors are eligible to be an author as per the international committee of medical journal editors (ICMJE) requirements/guidelines.
FUNDING
There is no funding to report.
CONFLICTS OF INTEREST
The authors report no financial or any other conflicts of interest in this work.
ETHICAL APPROVALS
This study does not involve experiments on animals or human subjects.
PUBLISHER’S NOTE
This journal remains neutral with regard to jurisdictional claims in published institutional affiliation.
REFERENCES
Brandalise M, Ferreira PCL, Meneghini L, Pereira AG, Froelich PE, Bergold AM. Stability-Indicating method for determination of Tizanidine Hydrochloride by LC-CAD method using chemometric approach. Drug Anal Res, 2017; 01:61–6. CrossRef
Coward DM. Tizanidine: neuropharmacology and mechanism of action. Neurology, 1994; 44:S6–10. CrossRef
Devarajan, Sivasubramanian L. Simultaneous spectrophotometric determination of valdecoxib and tizanidine in tablets. Indian J Pharm Sci, 2006; 68:240–2.
Mantri S, Moorthy NN, Kartthikeyan C, Trivedi P. Simultaneous spectrophotometric methods for the estimation of nimesulide and tizanidine in a tablet dosage form. Indian J Pharm Sci, 2005; 67:501–4.
Ramaa CS, Deshpande DK, Shirode AR, Wamorkar VV, Kakad AB, Kadam VJ. Reverse- phase high performance liquid chromatographic determination of tizanidine and valdecoxib in tablets. Indian J Pharm Sci, 2006; 68:514–6. CrossRef
Reddy GM, Krishna SR, Rao MVNB, Satish BV, Himabindu V. Identification and characterization of potential impurities of tizanidine hydrochloride ACAIJ, 2008; 7(8):586–90
Samel A, Raman B, Simultaneous estimation of related impurities of tizanidine hydrochloride in its active pharmaceutical ingradient by reversed-phase liquid chromatography. Asian J Chem, 2009, 21(1):176–82.
Smith C, Birnbaum G, Carter JL, Greenstein J, Lublin FD. Tizanidine treatment of spasticity caused by multiple sclerosis: results of a doubleblind, placebo-controlled trial. Neurology, 1994; 44:S34–43.
Subramanian G, Pandey S, Udupa N. RP-HPLC estimation of rofecoxib and tizanidine in combination tablets. Indian J Pharm Sci, 2004; 66:699–701.
Vijayakumar EKS, Gore VG, Mahajan A, Kumar M. Isolation and characterization of a process impurity in tizanidine hydrochloride. Indian J Pharm Sci, 2010; 72(3):360–2. CrossRef
Wagstaff AJ, Bryson HM, Tizanidine. A review of its pharmacology, clinical efficacy and tolerability in the management of spasticity associated with cerebral and spinal disorders. Drugs, 1997; 53:435–52. CrossRef